
Intuit
@t_Intuit

What symbols does the trader recommend buying?
Purchase History
پیام های تریدر
Filter
Intuit
تحلیل موشکافانه بیت کوین: آیا موج زیگزاگ ایدهآل، قیمت را به سقف تاریخی میرساند؟
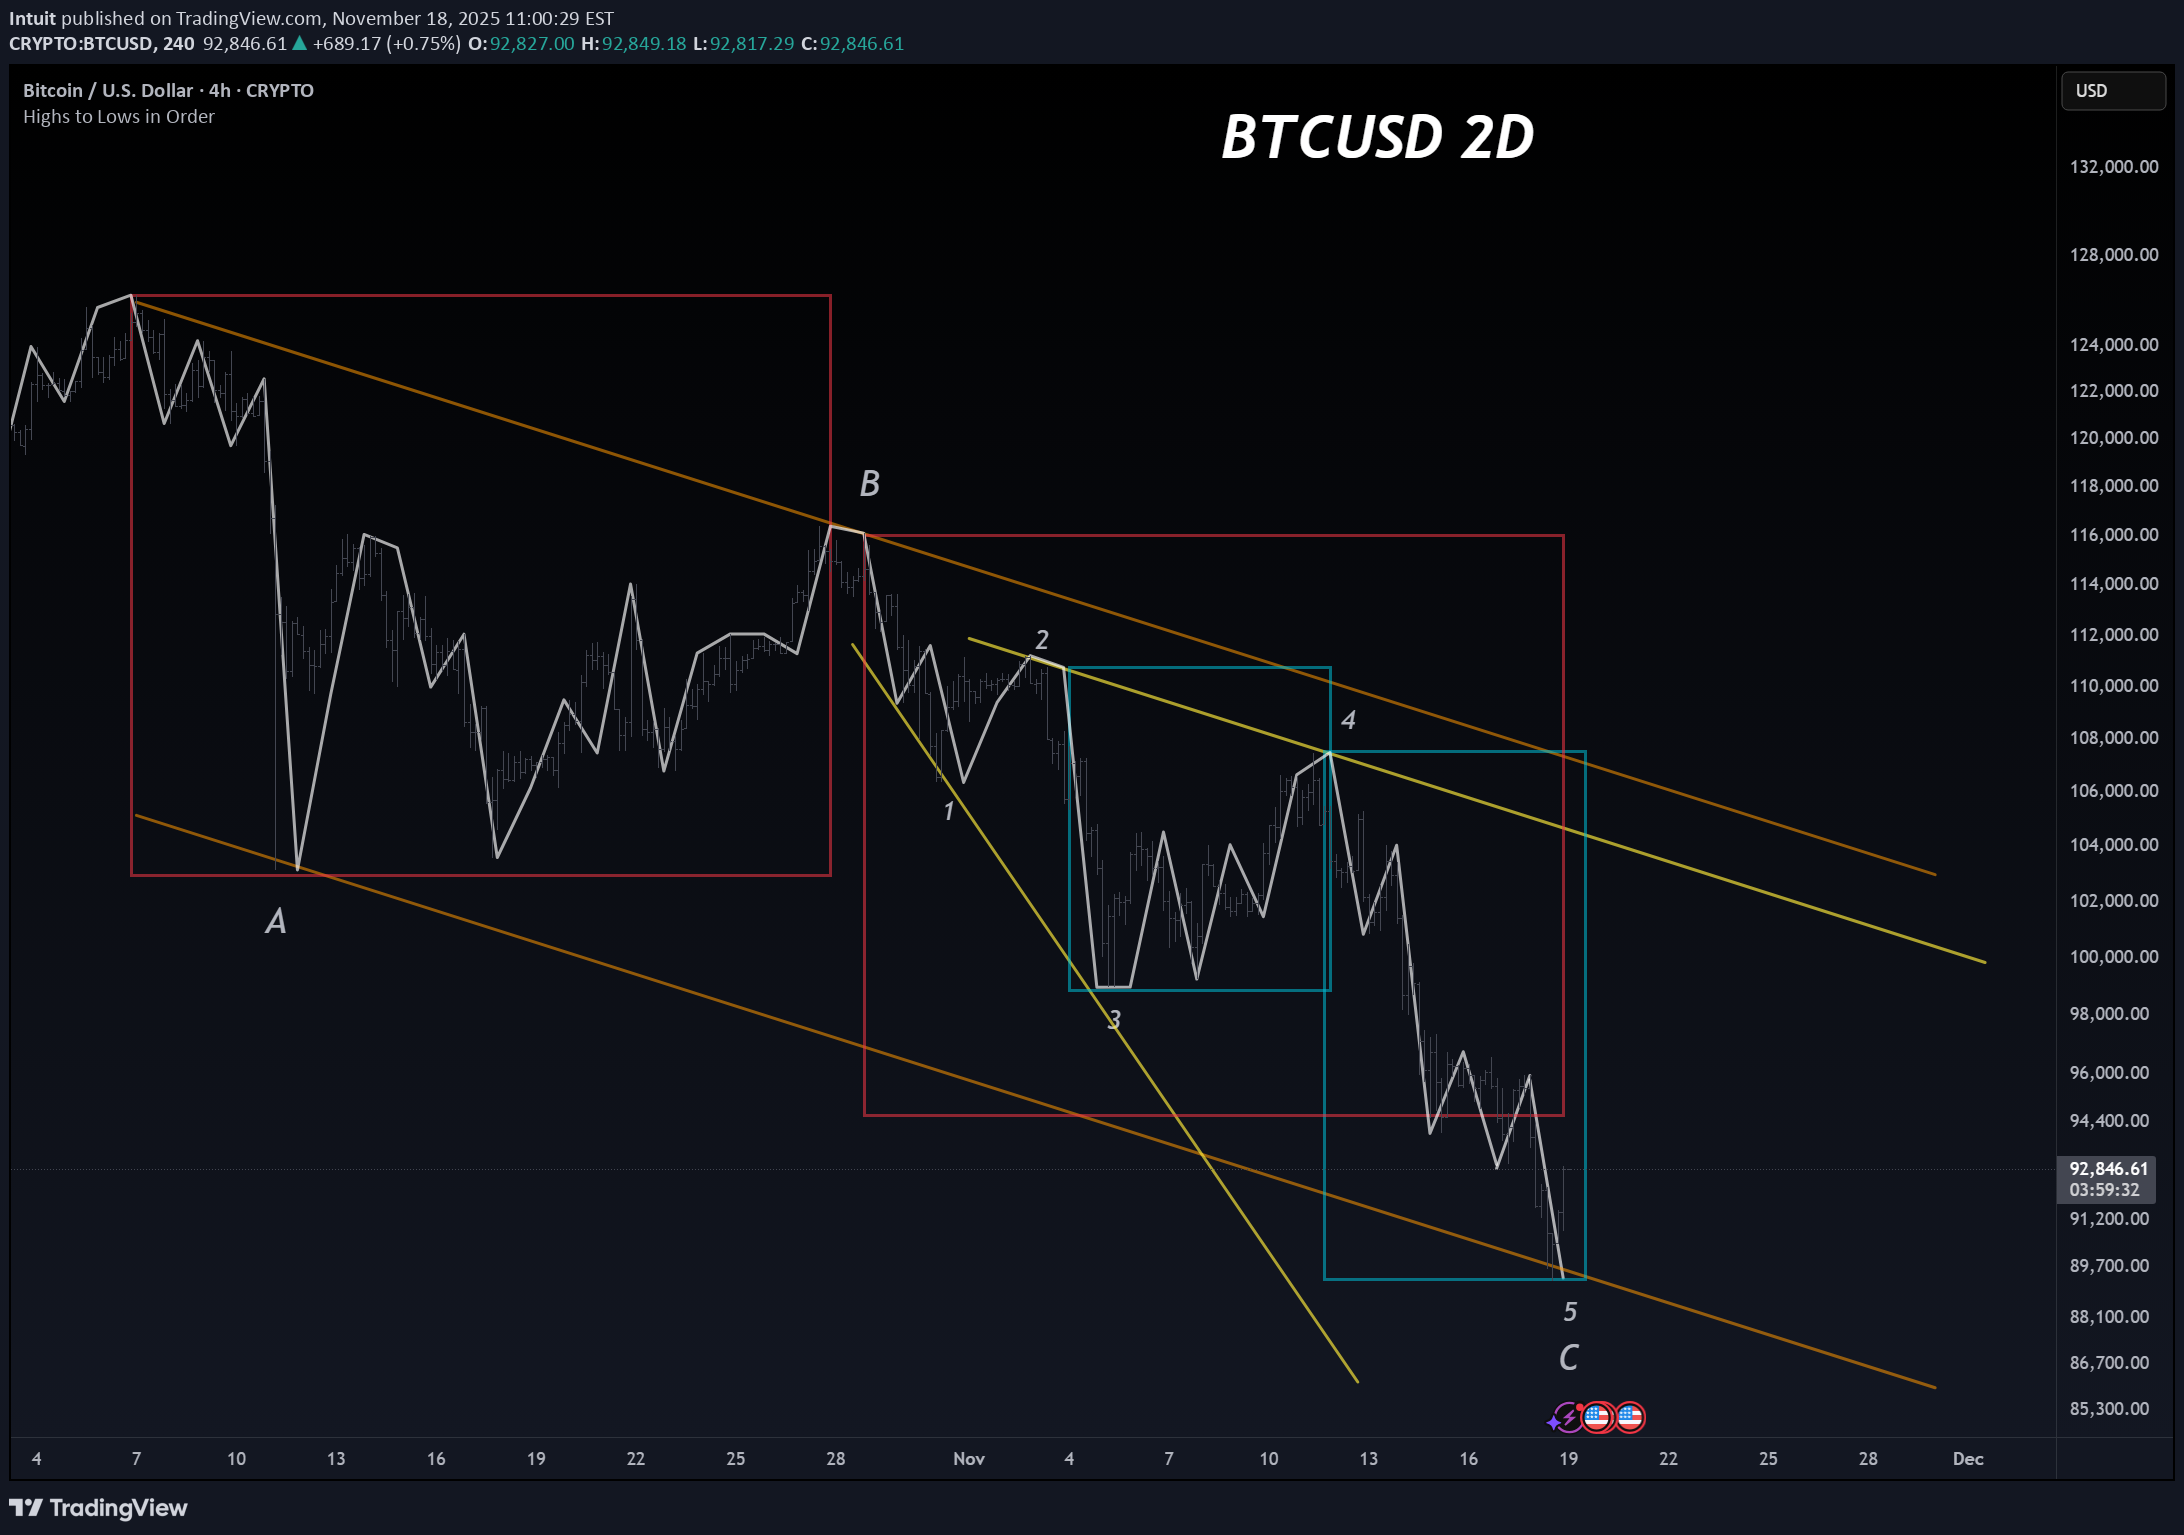
BTC has formed into a near-perfect zigzag with a near-perfect terminal wave-C. Highest Degree (Zigzag pattern): Wave-C = A+B in time Wave-C is the most complex and time consuming part of the pattern (common for terminal impulses) There's clear alternation in time/price for all waves Wave-B retraced <0.618% of wave-A (required for zigzags) Channeling confirms end of all waves clearly Wave-C (Terminal pattern): Wave-3 = 1.382 * Wave-1 in price (common in 5th wave extensions) Wave-3 = (Wave-1+Wave-2)0.5 in time Wave-4 = ~1.618 * Wave-2 Wave-4 = ~(Wave-2+Wave-3) in time, Wave-4 alternates with wave-2 in price/time Wave-5 = 1.618(Wave-3) in price Wave-5 = (Wave-3+Wave-4) in time Channels as an expanding wedge, expected for 5th-wave extensions Sentiment indicators are also reading near all time lows, as low as it was during the covid lows and FTX lows. Given this setup as an isolated pattern, and with the high probability Bitcoin is towards the middle of a long-term pattern, this is a strong setup for a move towards ATH. To confirm it, we should see wave-C being full retraced in less than half the time it took to form.
Intuit
الگوی زیگزاگ صعودی بیت کوین: آیا موج انفجاری به سمت ۲۵۰ هزار دلار آغاز میشود؟
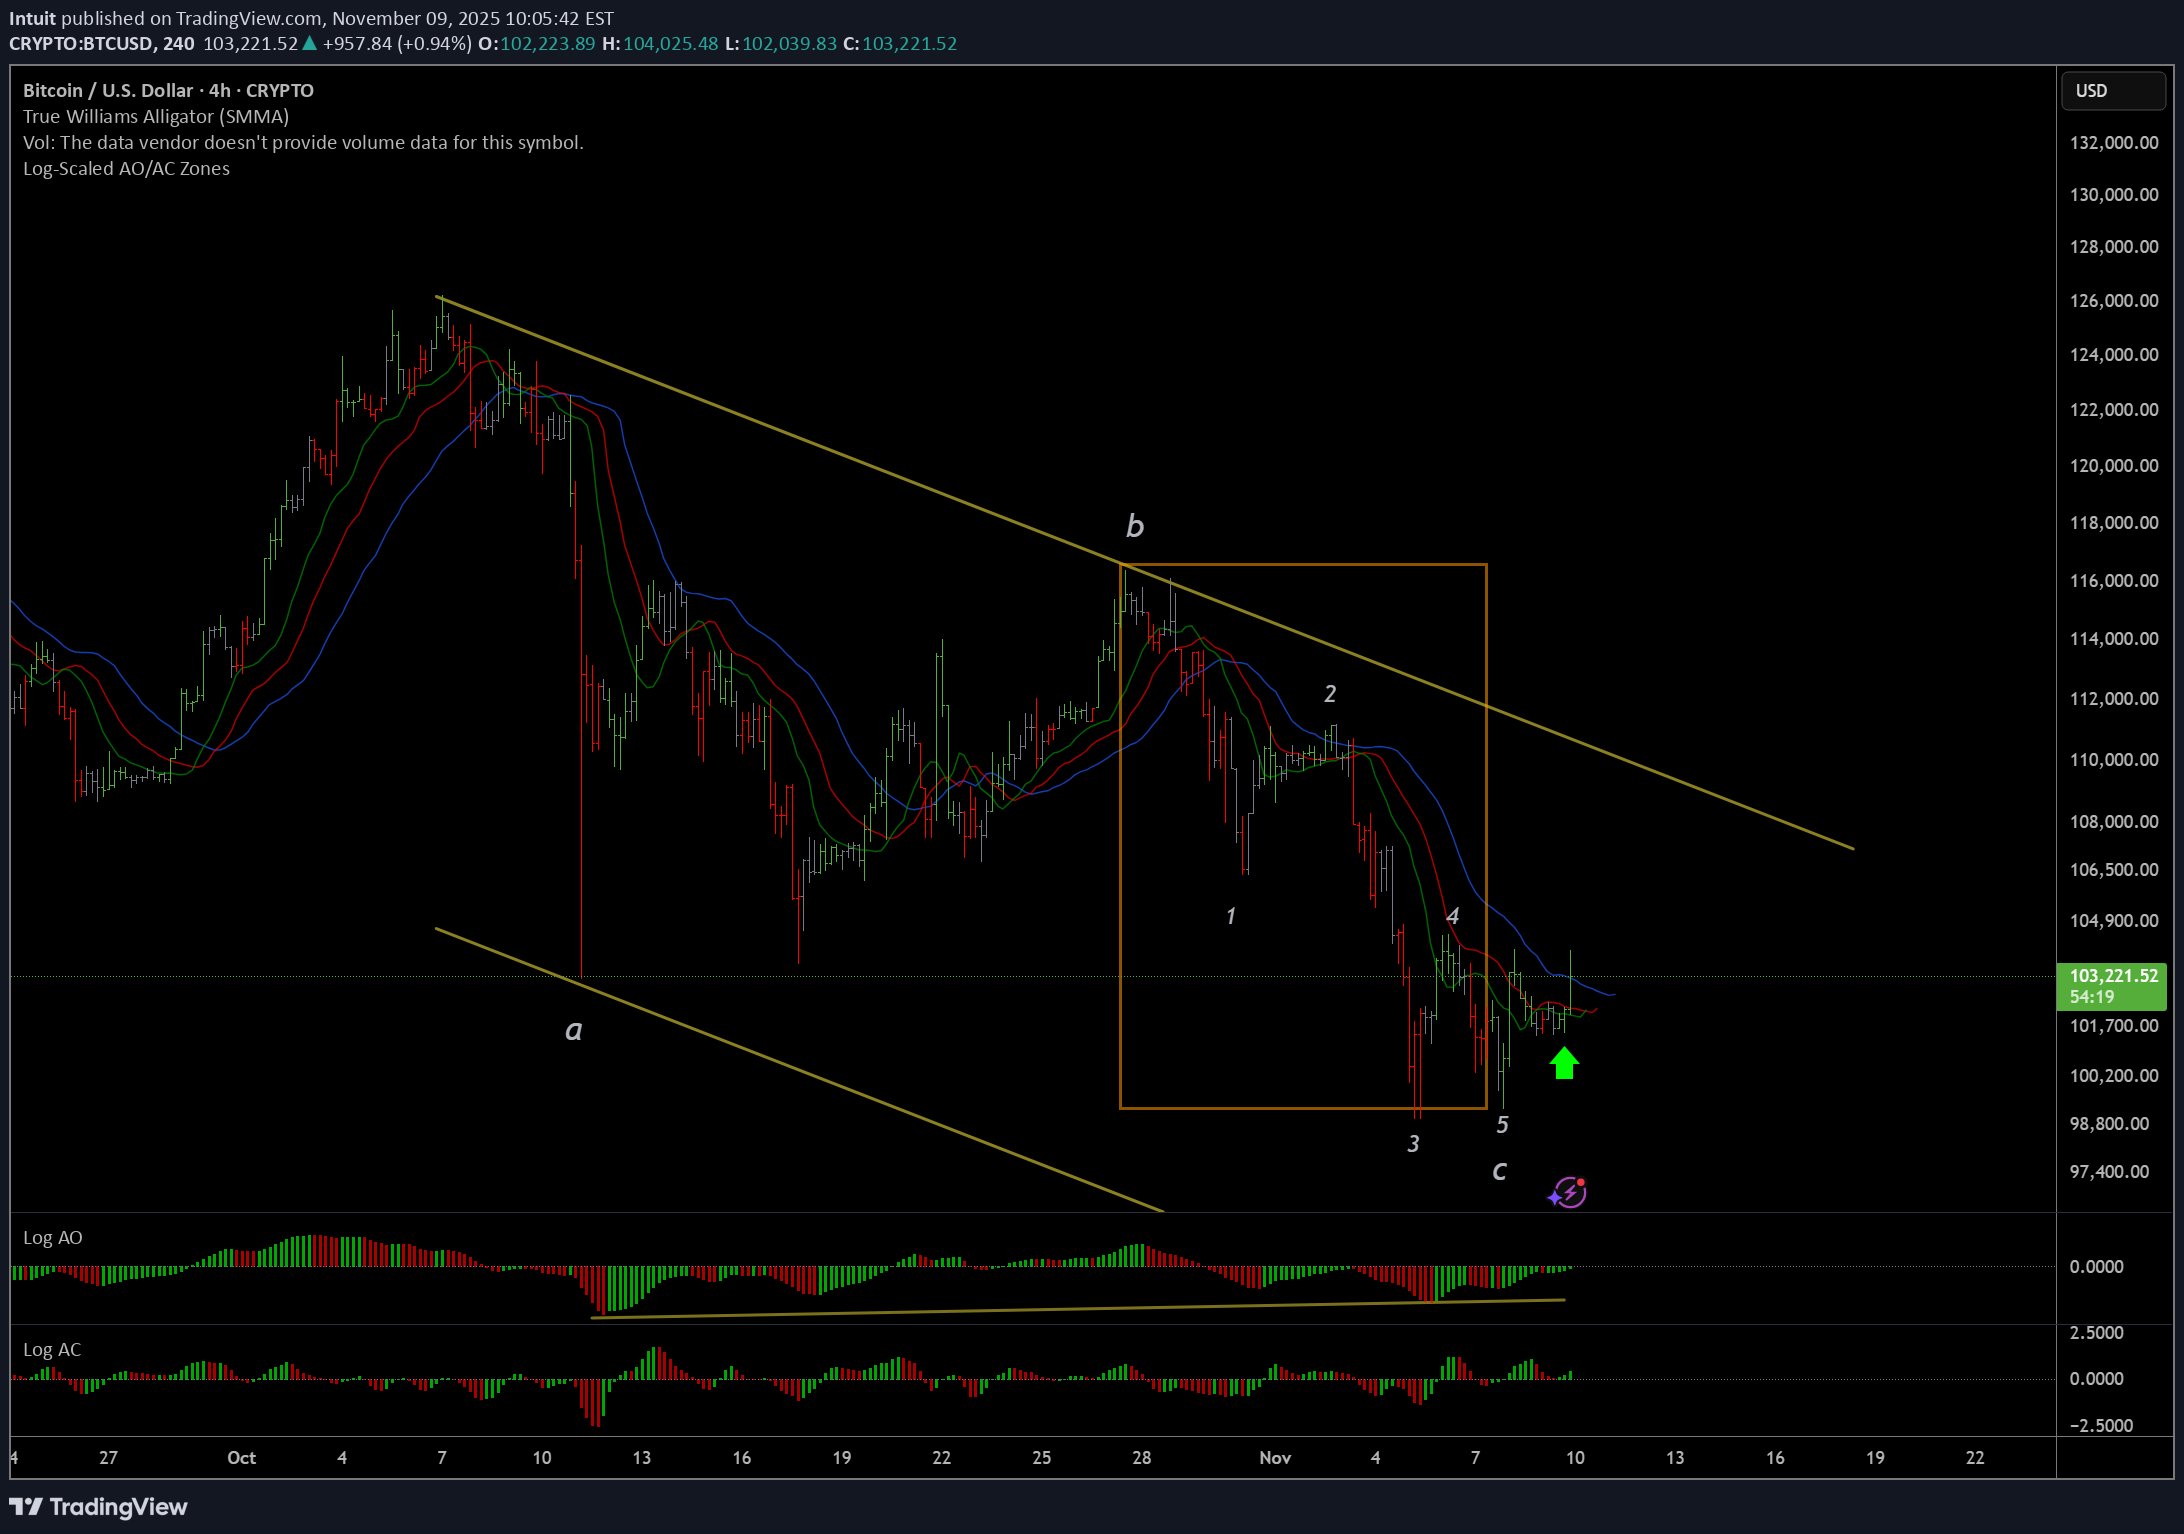
As an isolated, short-term pattern, BTC has formed into a near-perfect zigzag pattern. Wave-A is a violent monowave. Wave-B retraces exactly 61.8% of A and is structurally a flat pattern and a polywave. Wave-C relates to (A+B)/2 in time, 80% of wave-A in price, and is an impulsive wave. Beyond the Neowave considerations, there's also a clear bullish momentum divergence, multi-peak AO, daily/4hr 1st wiseman, and 4hr 2nd wiseman (fractal). Given all these considerations, and without considering the longer-term pattern, we are set for a decent bounce here which could potentially go to new all time highs. After speaking privately with Glenn Neely, he also thinks BTC is nearing the final blow-off phase which could take us as high as $250k, and ending sometime early next year. While I personally feel less confident about any long-term count now given multiple possibilities, at the very least, I think it's a good idea to be on the long-side here unless we clearly break through the $98-93k range. Especially because of this short-term pattern in isolation meeting all the normal signals I look for in a bottom pattern. As things continue to develop it may be easier to see a single longer-term count emerging, especially as we near the conclusion of the long-term pattern. For now, it doesn't make a big difference what exactly the count for the long-term wave up is, just that there's a very high probability it is not yet finished and we are hitting a short-term bottom now.BTC has probably formed an x-wave in the short-term. Good idea to take profit now, given that this short-term bounce isn't supported by the longer-term charts. The retesting of the bottom of the weekly trendline looks very bearish in combination with the weekly momentum, so I'd guess we see more downside probably for the rest of the year at the very least. That would at minimum give enough time for the weekly momentum to cross the zero line and "reset." However, it's certainly still possible that this could retrace all of wave-c on the weekly chart and begin a longer-term bear market. We'll have to wait and see what happens.It's definitely possible that instead of an x-wave, this could be wave-4 of c, and wave-c is a 5th wave extension terminal impulse. That would probably end around $91k which is a confluence of wave-5 of c being equal to waves-1 and 3, and wave-C (on weekly charts) being retraced 61.8%. Either way, most scenarios at this point are favoring more downside, we'll have to wait and see what happens to be sure how low it can go.
Intuit
تحلیل عمیق سولانا: ریزش از خط روند چندساله و پیشبینی کف قیمتی!
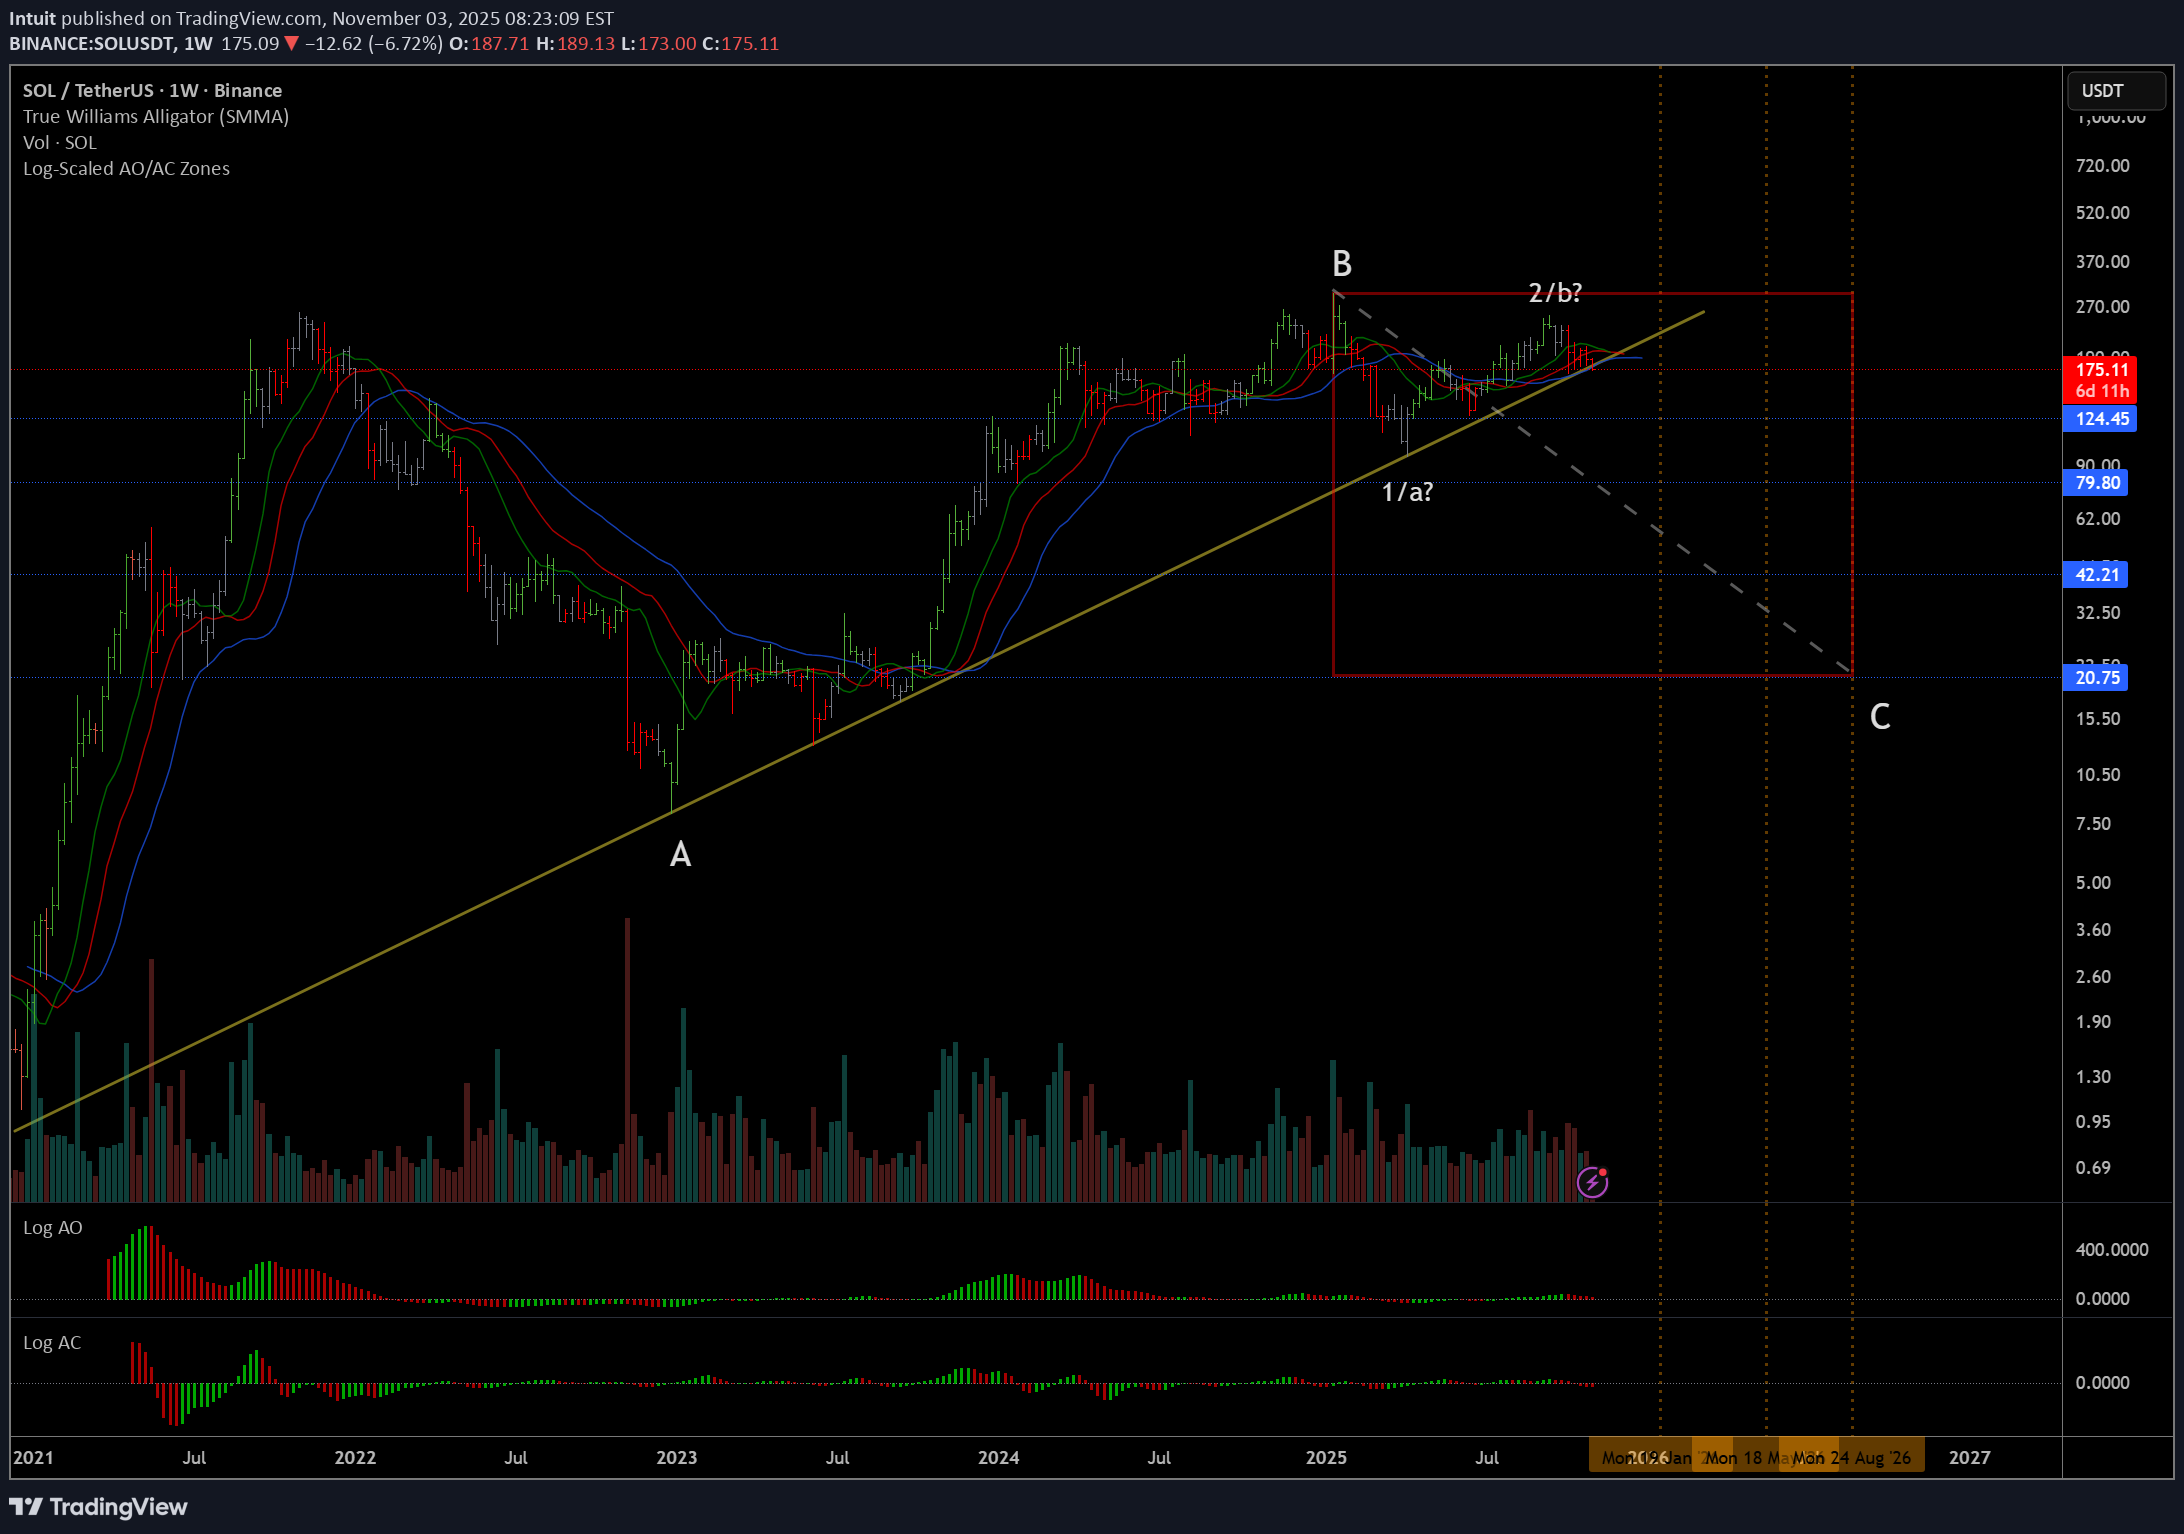
SOL is breaking down from this multi-year trendline which has 4 solid touch points. It's difficult to say how low it will go, worst case is probably around $20, but there are definitely other paths it could take as well. Without forecasting the exact future price, I will say that probabilities are favoring a continuation of the downtrend which began in January after Trump launched his memecoin on Solana. After we see how fast and far this drops, we can probably get a better idea of what is developing here. Right now, it looks like wave-B ended in January, and we are in a very large wave-C now, but there are some other possibilities as well. The wave-B possibility is closest to the middle so that's the one I am favoring now.
Intuit
MSTR Headed to Balance Sheet Insolvency?

If my wave forecast is correct and BTC trades down toward $23K (ie. 80% log retracement level of the 2023-2025 bull run), MicroStrategy (Strategy) becomes balance sheet insolvent: liabilities (convertible debt + preferreds like STRK/STRF/STRD/STRC) would exceed assets. That doesn’t mean automatic bankruptcy. Their convertibles only cost ~$35M/yr in interest, and even with ~$550–$680M/yr on ~$6.43B at 8–10% in preferred dividends layered on top, they can still cover fixed obligations short-term by liquidating BTC or issuing more equity. That keeps them out of Chapter 11 in the near term. But the trade-off is ugly: Massive dilution from issuing stock at distressed prices, or Selling BTC at $23K just to stay afloat. The real problem is the refinancing wall starting late 2027. With equity wiped on paper and ~$1.1B coming due by early 2028, any refinancing deal will be extremely punitive, handing creditors cheap equity or forcing fire-sale BTC disposals. Market pricing implication: Equity = option value only. Common stock would likely collapse into deeply distressed single digits (<$10), well below NAV, because shareholders sit behind $8.2B in converts and $6.4B+ in high-yield preferreds. So even if BTC really does retrace all the way to $23k, MSTR doesn’t go to $0 right away, but the stock trades like a distressed, over-leveraged call option on Bitcoin, with survival depending entirely on a rebound before maturities hit. BTC Forecast:BTC making new all time highs means that MSTR is likely to follow suit eventually. I still think MSTR could be in serious trouble when a large bear market (> -80%) happens on BTC (which has happened multiple times on BTC historically), but it seems less likely that will happen from this point as BTC charts are turning bullish again.
Intuit
BTC Double Zigzag Ending on Terminal Impulse (Elliott Wave)

BTC has formed into a double zigzag from the low in 2023 until now. This is the same count that my friend Glenn Neely (the founder of Neowave) is following. At this point there aren't really any other counts that appear to make sense. Especially considering the terminal impulse that wave-c has formed (see Daily chart). We've already begun breaking down from the rising wedge pattern, which is a strong indication that wave-c has concluded. Beyond just Elliott Wave/Neowave considerations, this has also formed long-term momentum divergences on the AO, and a clear weekly wiseman right at the end of wave-5 of c, perfectly aligned with the 0.5(a+b) time target for wave-c. This perfect confluence of signals here is a very strong signal the market has topped out long-term, and could retrace all the way back to ~$23k in the worst case scenario. Other potential retracement levels are labeled on the chart. If this does end up breaking $125k, then it may be a good idea to flip bullish as the bull cycle could continue for an unknown amount of time after that. For now, probabilities are starting to stack up indicating that the top is in and a big retracement is coming.From a William's perspective, I see this long-term set up as exceedingly bearish: 2D and 3D charts have closed under the gator. Both charts have all three wisemen. Both charts have created multi-peaks and have crossed or are approaching the zero line on the AO. 1W and 1M both have first wisemen (1M closes in 2 days). Virtually all charts have twin or multi-peaks, long-term divergences, and are beginning to turn red on the AO. This all aligns perfectly with the Wave theory price/time/structure targets which indicate that we've already hit the top. We've also retraced wave-5 of c faster than it was formed, broken down clearly from the rising wedge pattern, and even retested the bottom trendline before heading lower. (see daily rising wedge chart) The only bullish thing to note on these charts is the 1D first wisemen, but this signal is fairly weak given the rest of the set up. On the flip side, in the less likely scenario where this does break up above $125k and reverse the long-term wisemen and other signals, it would be a strong buy signal. However, that alternative scenario seems much less likely at this point, so unless it does break $125k, it's best to remain bearish based on Neowave theory and William's indicators.Given that we are starting to veer off course here, unless we see a sharp move down this week, the terminal count for wave-c is probably incorrect and we could still see more upside from here. The terminal is not totally invalid yet, and even if we get one more wave up it's possible that this last dip was wave-4 and the next wave up will be wave-5 of c. But it's also possible a wider bull market continuation could happen from this point IF the long-term top signals are invalidated AND a wave-5 doesn't form after the invalidation. At the least, the very short-term seems to be pointing up now while the long-term is still awaiting a confirmation (or invalidation) of the long-term top signals. Given the very early-stage nature of the top signals, the probability that they will hold is not extremely high, but high enough to warrant some level of caution as long as they still remain valid.The short-term bounce being almost fully retraced at this point is a good sign that the top signals are more likely to hold now. Whether the daily chart has formed into a 5th wave failure or a diametric doesn't really matter. The long-term counts (either double zigzag or diametric) are still completely valid and the chances of a much deeper pull back and multi-year bear market beginning from the all time high is significant.BTC has made a new all time high, as I stated previously this means that it is best to flip bullish as long-term bear signals are being reversed into long-term bull signals. While the wave count for the bullish case remains unclear, it is best to assume that the uptrend will continue until there is more information.
Intuit
My Last Tradingview Chart

I will no longer be posting to Tradingview because of their new rules which they've retroactively applied to my previous posts. The new rule is that you cannot use "private indicators." Even though my indicators are just slightly tweaked indicators that are fully public (only changed to scale them logarithmically and nothing else), they've still retroactively removed almost half of my charts for whatever asinine reason. I cannot even make these indicators public because the developer who published them originally has unfortunately passed away. Unless they fix this I will no longer be posting here. Really sad to see after posting here for almost 12 years.
Intuit
TRX Bullish Diametric (Elliott Wave)

Based on the time similarity here, TRX has formed into a potential bullish diametric pattern. The breakout from this sleeping gator range should indicate the next trend. Momentum and wave structure is favoring upside from here, but a break down from the range could quickly change that. Above the green horizonal line is an early bullish confirmation, and below the red horizonal line is an early bearish confirmation.There's not really much clarity here with wave structure, and either of these counts could be right (but good chance that both are actually wrong). The most important signal here is to wait and see which direction we break from this range before taking a position.This has broken the first daily fractal above the sleeping gator, so there's a good chance we are beginning a new uptrend now.Based on this short-term zigzag, and the fact that a pullback tends to happen right after a confirmation, we'll likely see a dip back towards the 0.243-0.239 range. Assuming support continues to hold, that is likely going to be a better re-entry point.
Intuit

The last few weeks on BTC have formed a huge whipsaw pattern, constantly faking out in each direction. This is common for an expanding triangle pattern, and this current triangle also has very good time relations (and lack of fibonacci price relations). Wave-e also broke beyond the a-c trendline as is standard for expanding triangles.Last week I said that we'd get one final run up to the highs and BTC would double top while some alts made new all time highs. This is exactly what has happened, and based on this expanding pattern, as well as the longer-term chart that I published in December, I believe the top is in for the rest of the year.The next move down should be extremely large and violent, probably ending somewhere around 30k towards the middle of this year. The b-wave recovery after that will likely be slow and followed by another c-wave before we finally end this major correction sometime in 2026.Shorting BTC September 2025 futures on OKX with $9,000 in premium seems like the best long-term play for this setup, because they are currently trading at 109k and the premium will eventually go to 0 as this collapse begins to accelerate.Funny enough, this did end up squeezing out the very last little bit of my price/time target, and reversed perfectly on my time target, and stopped right under my upper price target. Despite very briefly breaking ATH, I believe that we're still headed much lower from here. This was just the final part of the whipsaw pattern.Looks like wave-e of the expanding triangle formed a 2nd x-wave and a contracting triangle as the final phase of a triple combination, adding to the whipsaw even more. If this were to breakout and make a new all time high, then the chances that this can continue up are high. But for now odds seem to favor the downside from here.Based on the size of the retracement off of today's drop, there's a good chance that this continues to make at least one more new high. Support seems relatively strong here, especially considering the long-term break out of the weekly and monthly wisemen. Next move up should go at least to $120-130k by February.Based on the recent choppiness of the market I am very cautious trading this one in either direction until things start to clear up more. Downside still seems very likely but I am happy to stay out of this market until things start to clear up. If I see a clear trade set up, I will publish a new chart. The slightly bullish forecast from above is not a trade, and even if it did get another small wave up it's likely not going to go very far and will probably be completely retraced.
Intuit

XRP is one of the few cryptos that still looks pretty bullish. After reversing the daily wiseman signal from Jan 4th, and with the gator open to the upside, the chances of the uptrend continuing from here are relatively high.Upside targets will probably relate to the first wave up by a fibonacci ratio, putting XRP at least at $4.50 and as high as $7.00 by February.ATH 🎉Starting to see some weakness here, it might be early to close but I made 1500% trading this on 50x leverage so I am happy with that, and the risks to the downside are significant from here. The long-term bearishness on BTC (check my December chart), and the sentiment has spooked me out of this trade.
Intuit

ETH has created a perfect zigzag pattern, with a triangle for wave-B. Since wave-B is a limiting contracting triangle, wave-C should relate to wave-a of B by 100% in price, and end around the apex of the triangle timewise. Both of these requirements have been perfectly fulfilled, and the standard time target of (a+b)/2=c is also satisfied.On top of this wave pattern, we also have the first wiseman forming on the 4hr, as well as momentum divergences on multiple shorter-term charts. At the higher timeframes, ETH and BTC have both hit long-term fibonacci targets, time targets, monthly/weekly/daily wisemen, and momentum divergences. All of these long-term and short-term signals and wave patterns are indicating a potential long-term top, and at the least a significant pull back to new lows.The 4hr wisemen on ETH gives us a good way to minimize our risk on this trade by putting our stops at today's highs. From here, we should quickly retrace all of wave-C faster than it was formed to get confirmation that the zigzag is over. After we have confirmation, we can be very confident that we are heading to new lows and will probably end this wave somewhere around $3,090 to $2,770This one ran our stops and reversed us into a long, so for now I will assume that the uptrend will continueA new 4hr wisemen formed and the zigzag is still valid, so this is likely a good place to re-enter shortsWe've broken down from the channel and almost completely retraced wave-c much faster than it was formed. This is a strong confirmation we will head lower towards new lows as forecasted a couple days ago. Likely target is around $2,830 within the next 2 weeks, with the potential to go lower to around $2,380 (btw this new tradingview platform update is trash and only allows you to update trades once, so for now I will just use notes instead of trade updates)Good time to start scaling out of these shorts. It seems like ETH will make a retest of the highs one more time. Most likely we won't be able to bust through the highs here and it will double top, followed by a much larger crash. For now, it is probably time to start looking for longs to catch this final run up.
Disclaimer
Any content and materials included in Sahmeto's website and official communication channels are a compilation of personal opinions and analyses and are not binding. They do not constitute any recommendation for buying, selling, entering or exiting the stock market and cryptocurrency market. Also, all news and analyses included in the website and channels are merely republished information from official and unofficial domestic and foreign sources, and it is obvious that users of the said content are responsible for following up and ensuring the authenticity and accuracy of the materials. Therefore, while disclaiming responsibility, it is declared that the responsibility for any decision-making, action, and potential profit and loss in the capital market and cryptocurrency market lies with the trader.