Technical analysis by Intuit about Symbol BTC: Buy recommendation (11/9/2025)

Intuit
الگوی زیگزاگ صعودی بیت کوین: آیا موج انفجاری به سمت ۲۵۰ هزار دلار آغاز میشود؟
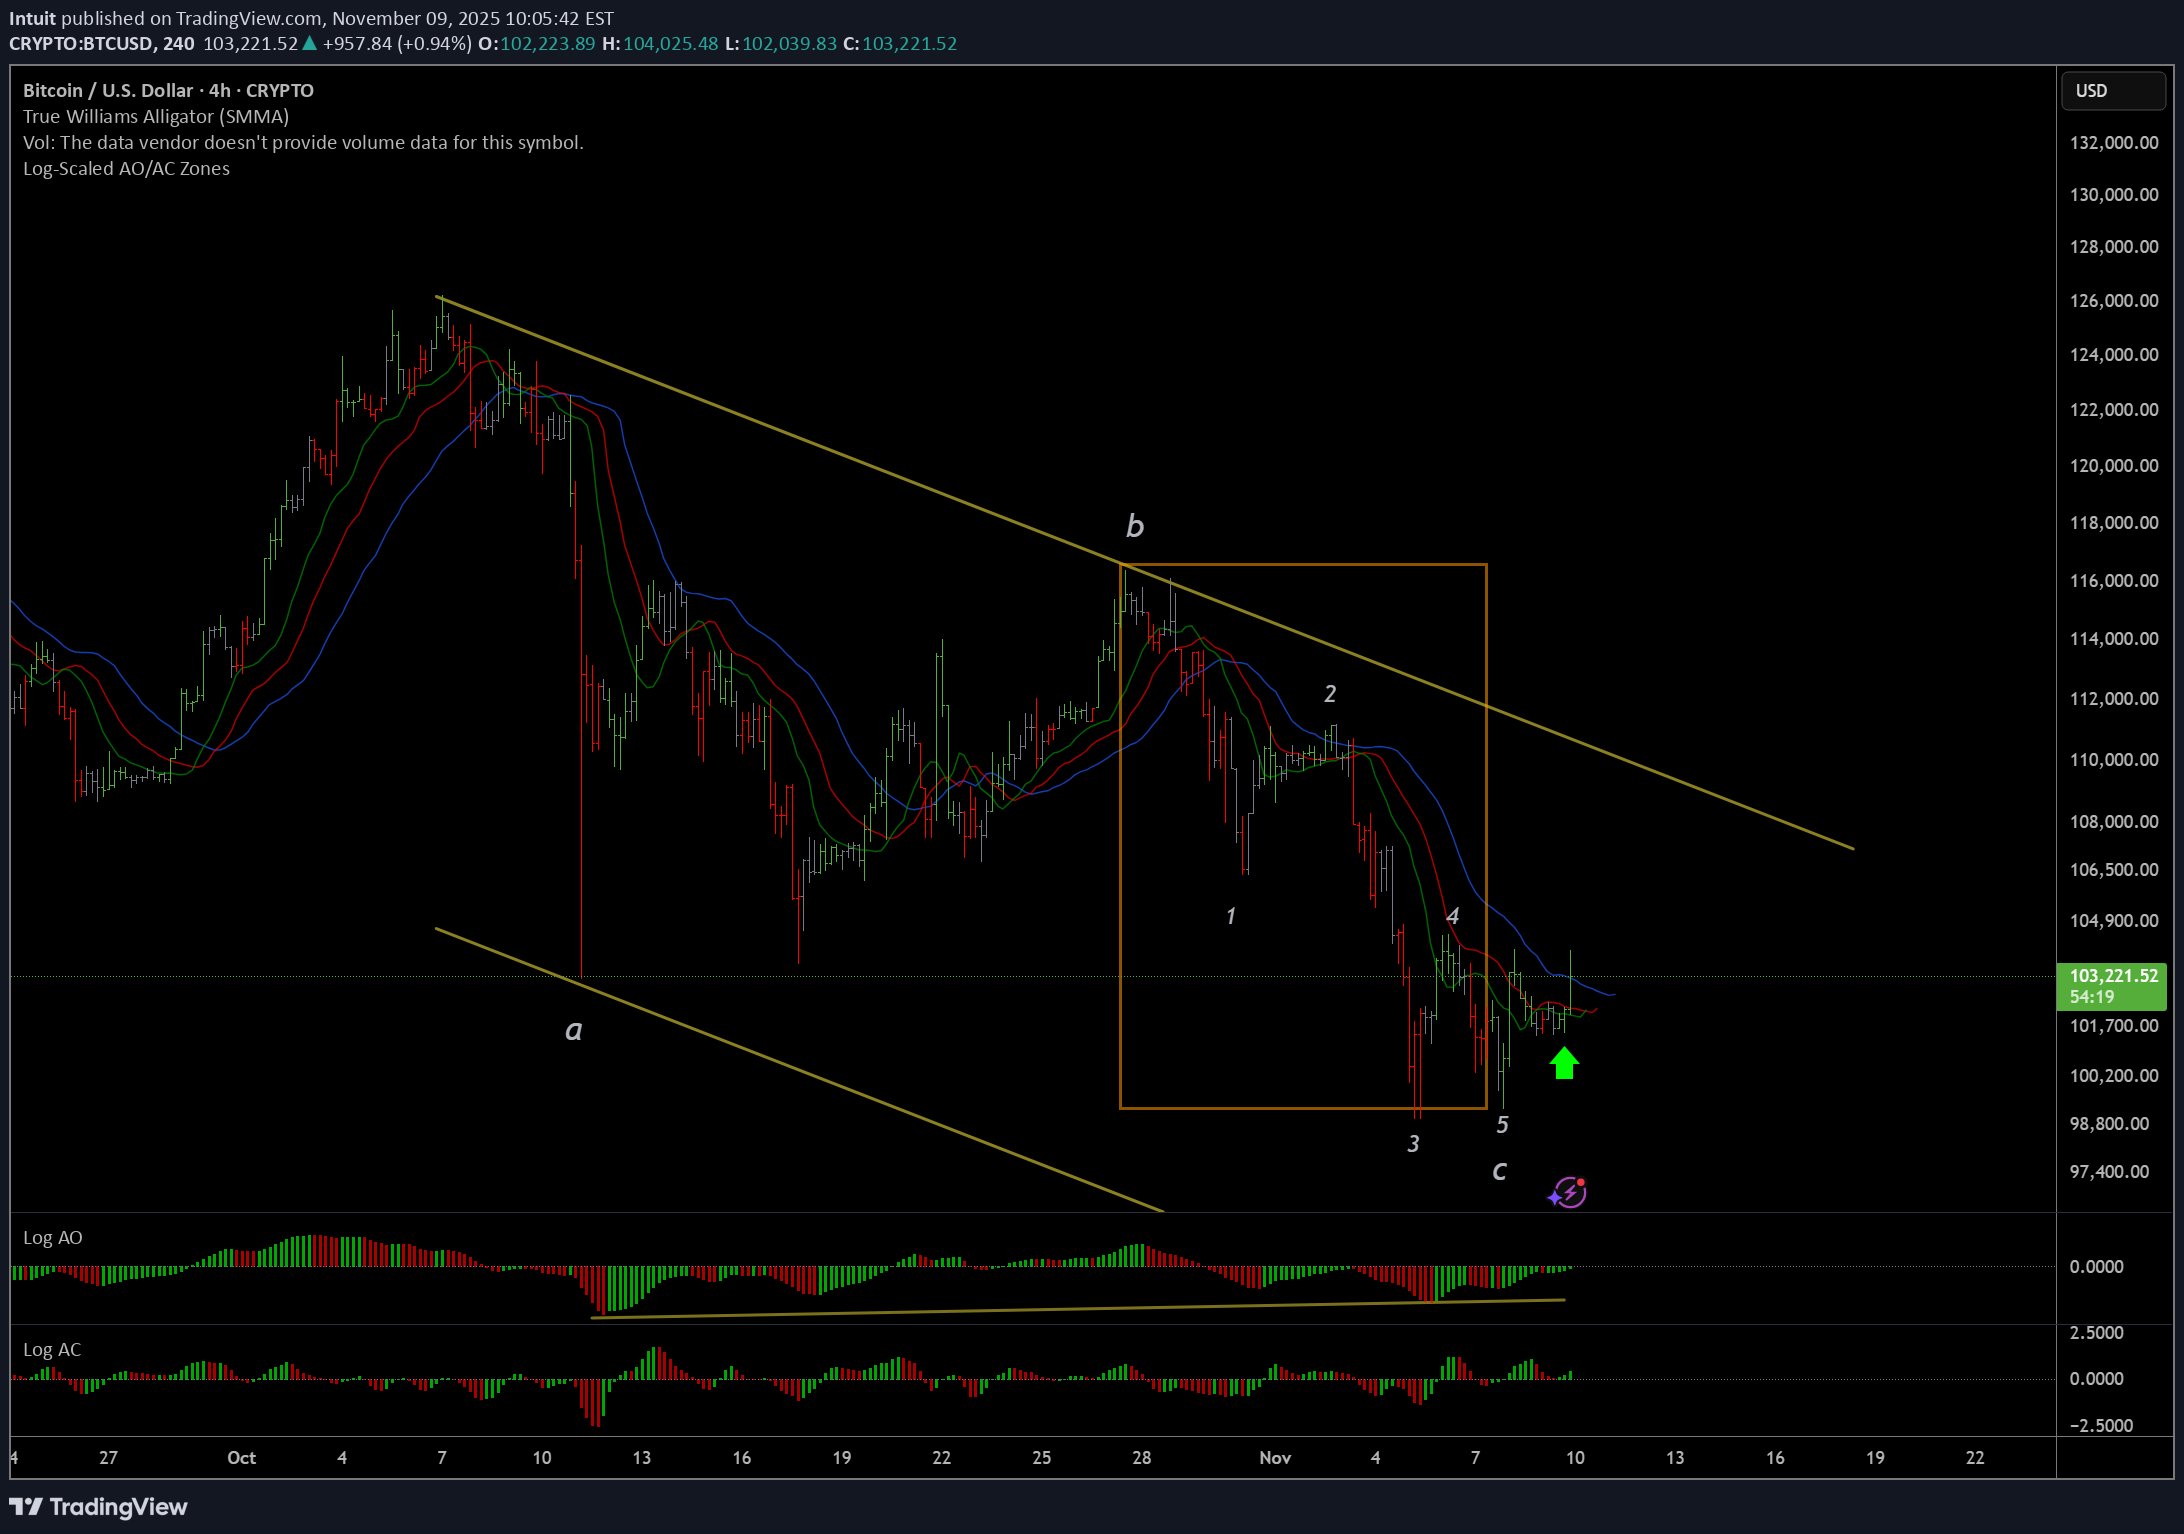
As an isolated, short-term pattern, BTC has formed into a near-perfect zigzag pattern. Wave-A is a violent monowave. Wave-B retraces exactly 61.8% of A and is structurally a flat pattern and a polywave. Wave-C relates to (A+B)/2 in time, 80% of wave-A in price, and is an impulsive wave. Beyond the Neowave considerations, there's also a clear bullish momentum divergence, multi-peak AO, daily/4hr 1st wiseman, and 4hr 2nd wiseman (fractal). Given all these considerations, and without considering the longer-term pattern, we are set for a decent bounce here which could potentially go to new all time highs. After speaking privately with Glenn Neely, he also thinks BTC is nearing the final blow-off phase which could take us as high as $250k, and ending sometime early next year. While I personally feel less confident about any long-term count now given multiple possibilities, at the very least, I think it's a good idea to be on the long-side here unless we clearly break through the $98-93k range. Especially because of this short-term pattern in isolation meeting all the normal signals I look for in a bottom pattern. As things continue to develop it may be easier to see a single longer-term count emerging, especially as we near the conclusion of the long-term pattern. For now, it doesn't make a big difference what exactly the count for the long-term wave up is, just that there's a very high probability it is not yet finished and we are hitting a short-term bottom now.BTC has probably formed an x-wave in the short-term. Good idea to take profit now, given that this short-term bounce isn't supported by the longer-term charts. The retesting of the bottom of the weekly trendline looks very bearish in combination with the weekly momentum, so I'd guess we see more downside probably for the rest of the year at the very least. That would at minimum give enough time for the weekly momentum to cross the zero line and "reset." However, it's certainly still possible that this could retrace all of wave-c on the weekly chart and begin a longer-term bear market. We'll have to wait and see what happens.It's definitely possible that instead of an x-wave, this could be wave-4 of c, and wave-c is a 5th wave extension terminal impulse. That would probably end around $91k which is a confluence of wave-5 of c being equal to waves-1 and 3, and wave-C (on weekly charts) being retraced 61.8%. Either way, most scenarios at this point are favoring more downside, we'll have to wait and see what happens to be sure how low it can go.