
IbrahimTarek
@t_IbrahimTarek

What symbols does the trader recommend buying?
Purchase History
پیام های تریدر
Filter
IbrahimTarek
شکست تاریخی بیت کوین: نقشه راه خرید BTC تا سقف ۱۰۳,۰۰۰ دلار!

📈 BTCUSD – Trading Plan Summary (Breakout Setup) 🔍 Market Context Bitcoin has successfully broken above the major descending trendline, which has rejected price multiple times in the past. This breakout signals a potential shift in momentum from bearish → bullish. 📌 Trade Setup 🎯 Entry $87,600 Confirmed breakout of the downtrend line with bullish follow-through. 🛡️ Stop-Loss $80,000 Placed below key structural support to protect against a false breakout. 🎯 Take Profit Targets TP1: $97,800 TP2: $103,000 This zone represents a major supply area and previous consolidation region before the breakdown. 📊 Technical Reasons for the Trade Multi-touch downtrend line break, indicating a shift in market structure. Formation of a higher low, supporting bullish reversal potential. Clean momentum candles breaking away from resistance. Target zone aligns with strong historical supply. 📉 Risk Management Risk remains defined with SL at $80,000. If price closes back below the broken trendline, bullish structure becomes invalid. 📌 Summary Bitcoin is presenting a high-probability breakout setup with clear risk and well-defined upside targets. Holding above $87,600 keeps momentum bullish toward $97.8K–$103K.is achived
IbrahimTarek
DOTUSD

Technical Analysis – DOT/USDT (4H timeframe) Current Price Action: DOT is currently trading around $4.35, sitting inside the highlighted entry zone ($4.20–$4.35). The structure shows a bullish harmonic pattern (likely a bullish Gartley/Butterfly), suggesting potential upward movement. Support & Stop Loss Levels: Strong support is located at $4.20–$4.35 (entry zone). Deeper support lies around $3.60–$3.47, which is also marked as the stop-loss level to protect against downside risk. Resistance & Target Levels: Target Zone 1: $5.01 – $5.13 (first profit-taking area). Target Zone 2: $5.45 – $5.59 (secondary target if bullish momentum continues). Major resistance beyond this lies near $7.32, but that’s a longer-term objective. Trend Outlook: The chart suggests a potential bullish breakout from the accumulation range. As long as price holds above $4.20, the bias remains bullish. A confirmed close above $5.13 would likely accelerate the move toward $5.45–$5.59. Risk Management: Entry should be considered within the $4.20–$4.35 range. Place a stop loss at $3.60 to limit downside risk. Risk-to-reward ratio (R:R) is attractive (around 1:2 or better), making this setup technically favorable. Conclusion DOT is showing a bullish technical setup with entry opportunities in the $4.20–$4.35 zone. If price holds above support, upside targets are $5.01–$5.13 (first take-profit) and $5.45–$5.59 (second take-profit). The bullish outlook is invalidated if price breaks below $3.60.
IbrahimTarek
TSLA

Technical Analysis (Weekly Chart – TSLA, NASDAQ): Current Price: $395.94 (+12.85% in the latest session), showing strong bullish momentum. Support Zone (Buy Area): The chart highlights an attractive buying range between $300–330, where multiple moving averages converge, acting as dynamic support. Stop-Loss: Placed at $200, which sits well below the long-term trendline and previous key support. This ensures risk control in case of a major reversal. Target Zone: The bullish projection is toward the $608–650 area, aligning with previous resistance levels and a strong supply zone from 2021–2022. Trend & Structure: The stock recently broke out of a consolidation pattern (A–B–C–D) with strength, supported by high volume and upward momentum. Long-term moving averages (200-week shown in black) are flattening and turning up, signaling a potential multi-year bullish reversal. If price sustains above $330, the bullish scenario remains valid with the probability of continuation toward $600+. Outlook: Short-term: Possible minor retracement to $330–350 before resuming the uptrend. Medium- to Long-term: Bullish trend continuation toward $608–650. Risk: A breakdown below $300 would weaken the bullish case, and a fall under $200 would invalidate it completely. 📌 Summary: Tesla shows a strong bullish setup on the weekly chart. Entry zone is $300–330 with stop-loss at $200. The first major target is $608–650, offering an excellent risk–reward ratio for long-term investors.
IbrahimTarek
ADA
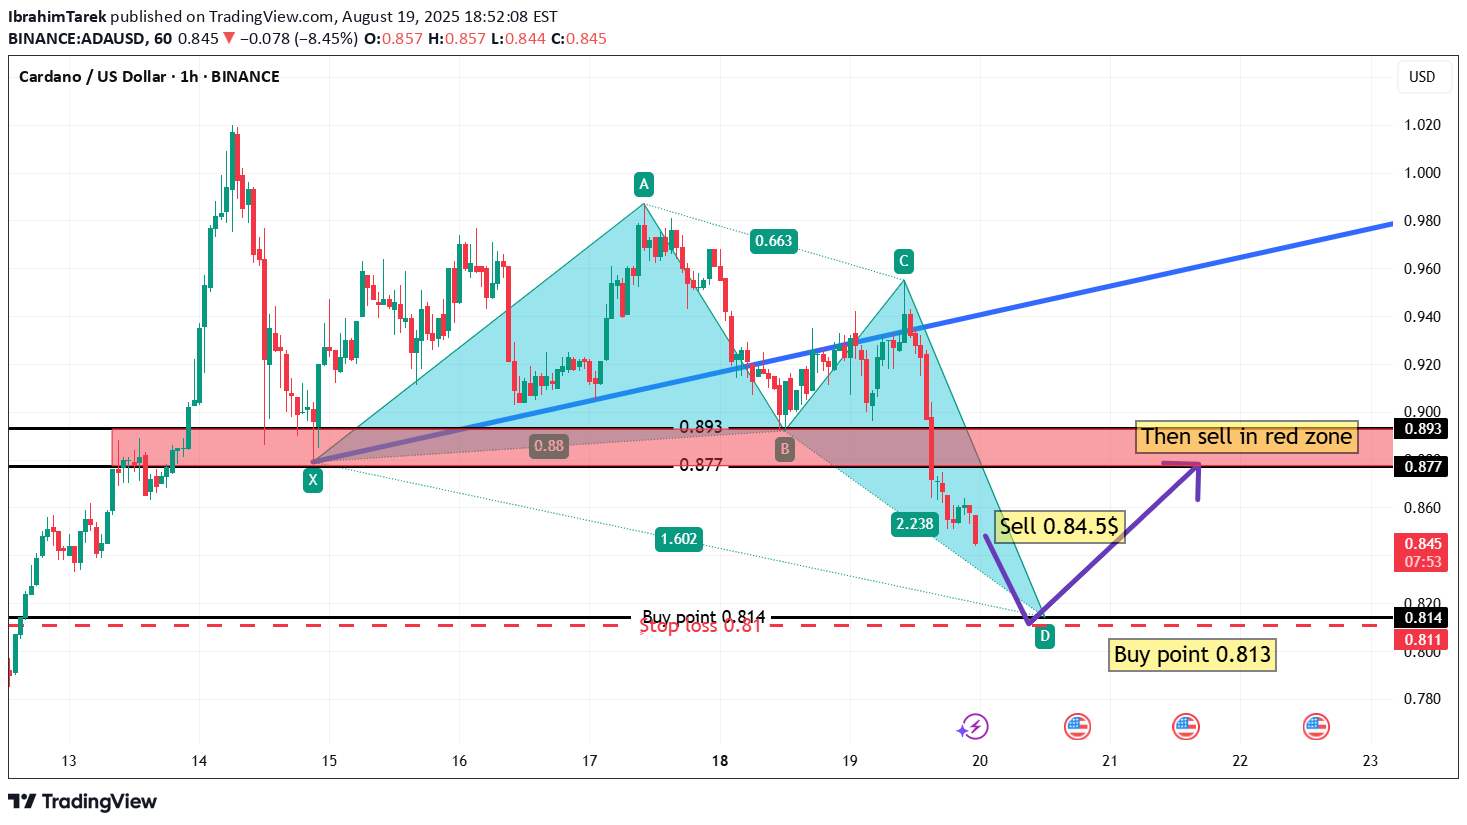
📉 Expected Scenario: The price is expected to decline towards 0.813 – 0.814 (buy zone). From there, a corrective rebound may occur towards 0.85. The move could then extend further into the 0.877 – 0.893 red zone, which is considered the optimal area to re-enter short positions. Any break below 0.81 would invalidate the bullish scenario and open the door for further downside.
IbrahimTarek
LINK/USDT
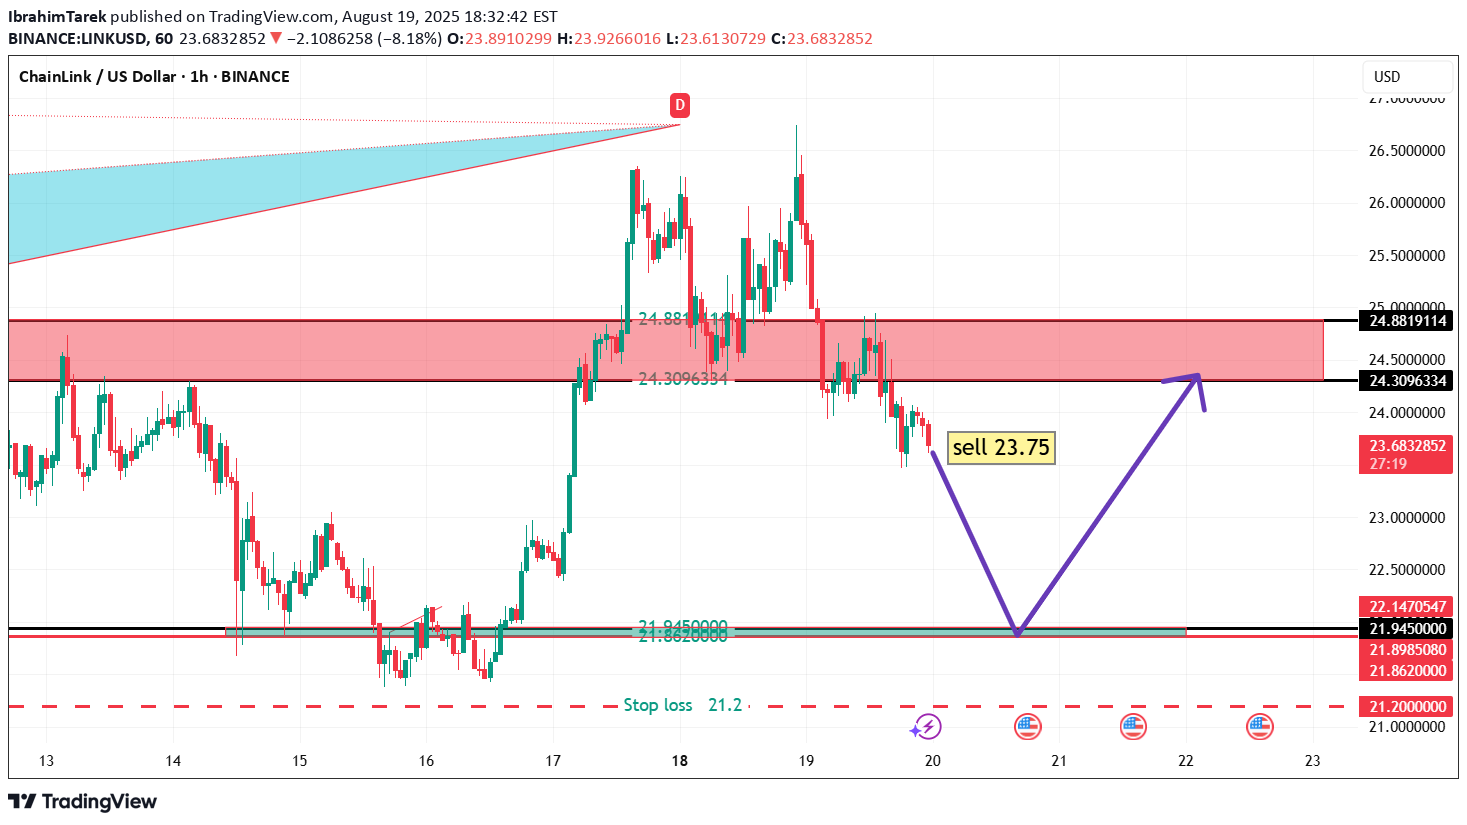
Technical Analysis (LINK/USDT – 1H Chart) Chainlink is currently trading around 23.65 after failing to hold above the short-term support. Based on the chart structure: The price is expected to extend its decline towards the green demand zone at 22.00 – 22.20, where buyers are likely to step in. A stop loss is placed at 21.20, just below the lower boundary of this demand zone. From there, a potential rebound is anticipated, targeting the red supply zone at 24.30 – 24.90, which has acted as a strong resistance area previously. Outlook: Bearish move towards support first, followed by a bullish correction into the highlighted resistance zone.
IbrahimTarek
ADA
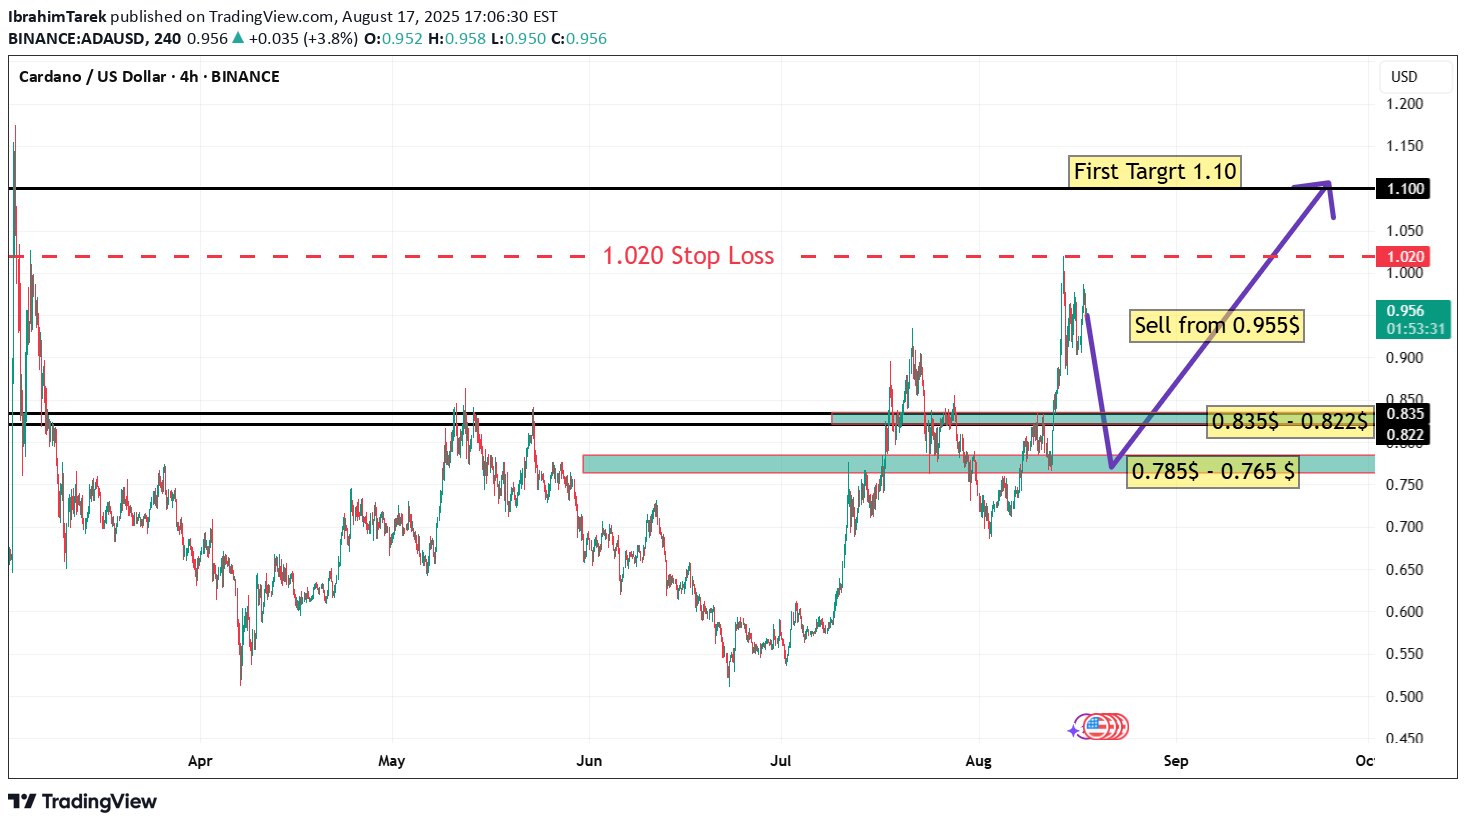
🔎 ADA/USDT Chart Analysis (4H – Binance) Key Levels Highlighted: Sell Zone: around 0.955$ Stop Loss: 1.020$ (above major resistance) Downside Targets: First support zone: 0.835 – 0.822$ Second, deeper support zone: 0.785 – 0.765$ Upside Target (if bullish breakout occurs): 1.10$ 📊 Possible Scenarios: ✅ Bearish Scenario (as shown on the chart): Price is currently testing 0.955$ resistance, which used to be a broken support. As long as the price stays below 1.020$, probability favors a move down toward 0.835 – 0.822$. If that zone breaks, the next target will be the 0.785 – 0.765$ demand area. These zones are potential buy levels for a rebound. ✅ Bullish Alternative Scenario: If the price closes above 1.020$ with strong momentum → the stop loss will be triggered. In that case, the structure flips bullish, targeting 1.10$ as the first upside objective. A breakout above 1.10$ may extend toward 1.18 – 1.20$. 📌 Key Notes: The support areas (0.835 – 0.822$ and 0.785 – 0.765$) are strong demand zones. The trading plan is based on selling at resistance and buying at support. Risk management is crucial due to ADA’s high volatility. Mid-term trend is still ranging/accumulation between 0.75$ – 1.10$. ✅ Summary: Short entry: 0.955$ Take Profit 1: 0.835$ Take Profit 2: 0.785$ Stop Loss: 1.020$ If price breaks above 1.020$ → target becomes 1.10$.
IbrahimTarek
NVDA
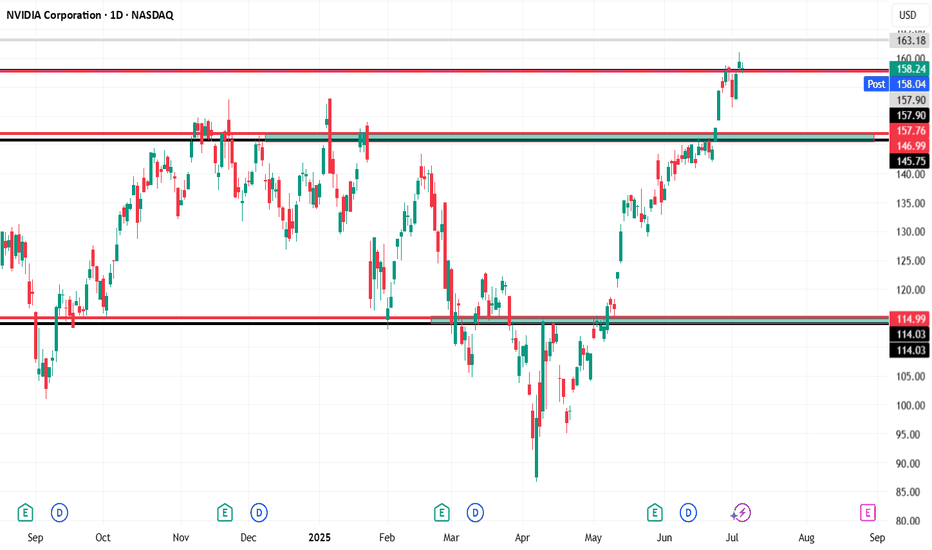
📊 NVIDIA (NVDA) – Daily Chart Technical Analysis Entry Point: A long position is considered at $158, assuming the price holds above $157.78. Resistance & Target: The first target is set at $163, which is a clear resistance zone on the chart based on historical price reactions. If momentum continues beyond that, higher targets could be considered in future analysis. Stop Loss: A tight stop-loss is placed just below key support at $157 to manage risk. 🔄 Weekly Bearish Scenario: If the price closes below $157, this invalidates the bullish setup: The first downside target would be $146, which is a previously established support zone. A further drop could extend toward $115, especially if broader market weakness or sector rotation occurs. 📌 Key Technical Zones: Support Zones: $157.78, $157.00 (critical for bullish continuation) Resistance Zones: $158.12, $163.18 Multiple historical rejections and price consolidations are noted near these zones, highlighting their significance. Summary: As long as NVDA remains above $157.78, the outlook remains bullish targeting $163. However, a confirmed breakdown below $157 could shift the sentiment sharply bearish, targeting $146 and possibly $115.achived
IbrahimTarek
IbrahimTarek
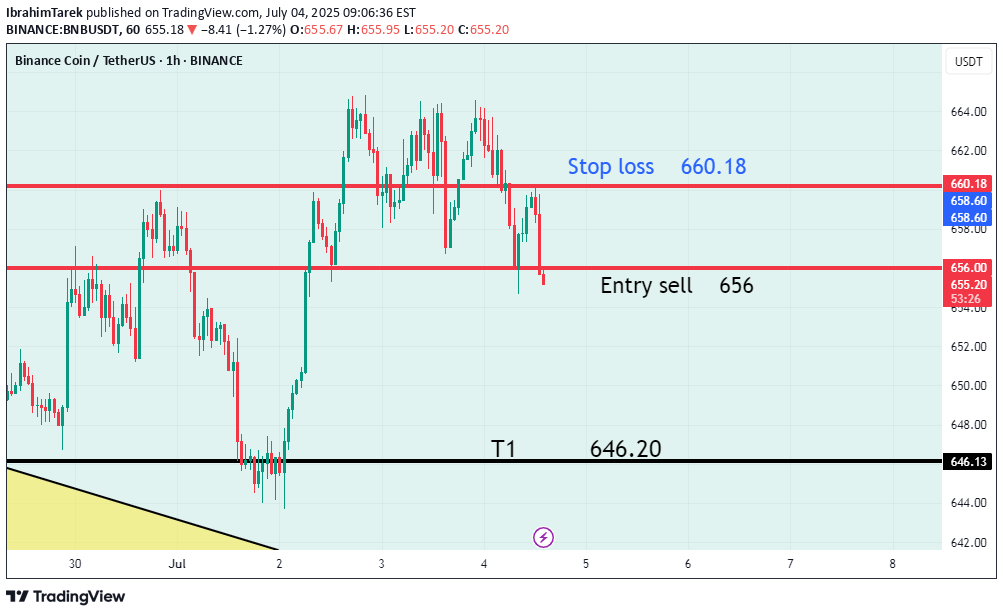
LINK/USD
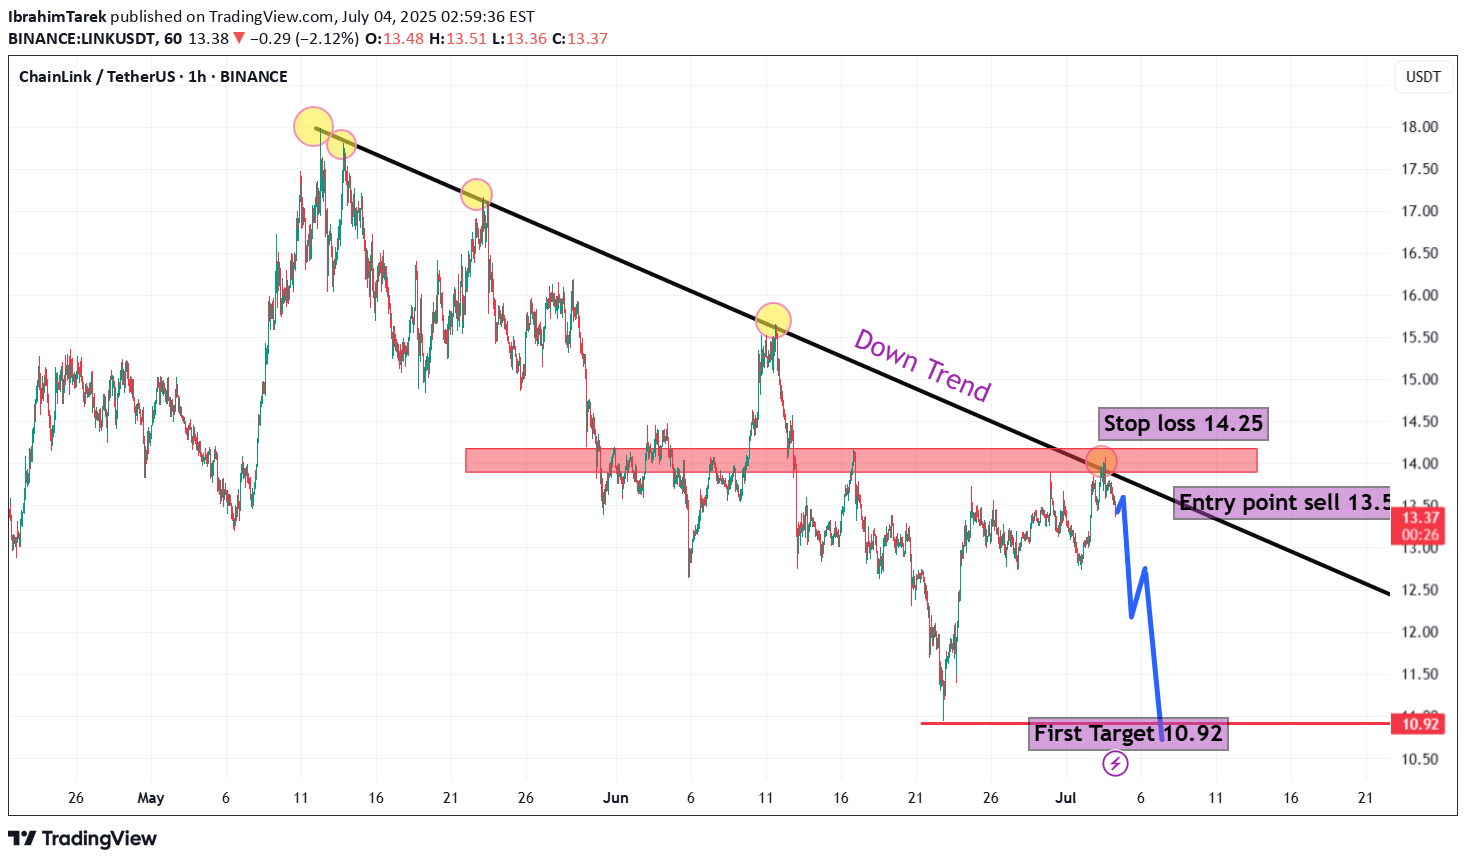
🧠 Technical Overview: General Trend: The chart shows a clear downtrend starting from mid-May. Each upward attempt is rejected at the descending trendline, confirming the bearish bias. 🧩 Chart Analysis Elements: 1. Trendline: Drawn accurately from the major highs, acting as a strong dynamic resistance. Price has tested this line multiple times and failed to break above it. 2. Supply Zone: Highlighted in red around the 13.80–14.20 USDT area. This zone has acted as a strong resistance, causing price to drop again. 3. Entry Point: Sell at 13.60 USDT, after confirmation of rejection from both the supply zone and the trendline. 4. Stop Loss: Set at 14.25 USDT, above both the resistance zone and the descending trendline — a logical level to protect the trade. 5. First Target: 10.92 USDT, a clearly identified support level. This target reflects a likely corrective move within the ongoing downtrend. 📉 Expected Price Action: Current price is 13.38 USDT, very close to the suggested entry. If rejection continues from this area, the price is expected to gradually decline toward the 10.92 support level. The price structure suggests a potential formation of a new lower low. 🔥 Risk-to-Reward Ratio (R:R): Target: ~2.68 USDT (from 13.60 to 10.92) Stop Loss: ~0.65 USDT (from 13.60 to 14.25) R:R = ~4.1:1 → Excellent reward compared to risk. ✅ Conclusion: The proposed short (sell) trade setup is technically solid and aligns with the broader downtrend. Classic confirmations: Trendline rejection + Supply Zone resistance + Bearish price action. Well-placed stop loss and logical support-based target. Suitable for day traders and swing traders.
IbrahimTarek
XAU/USD
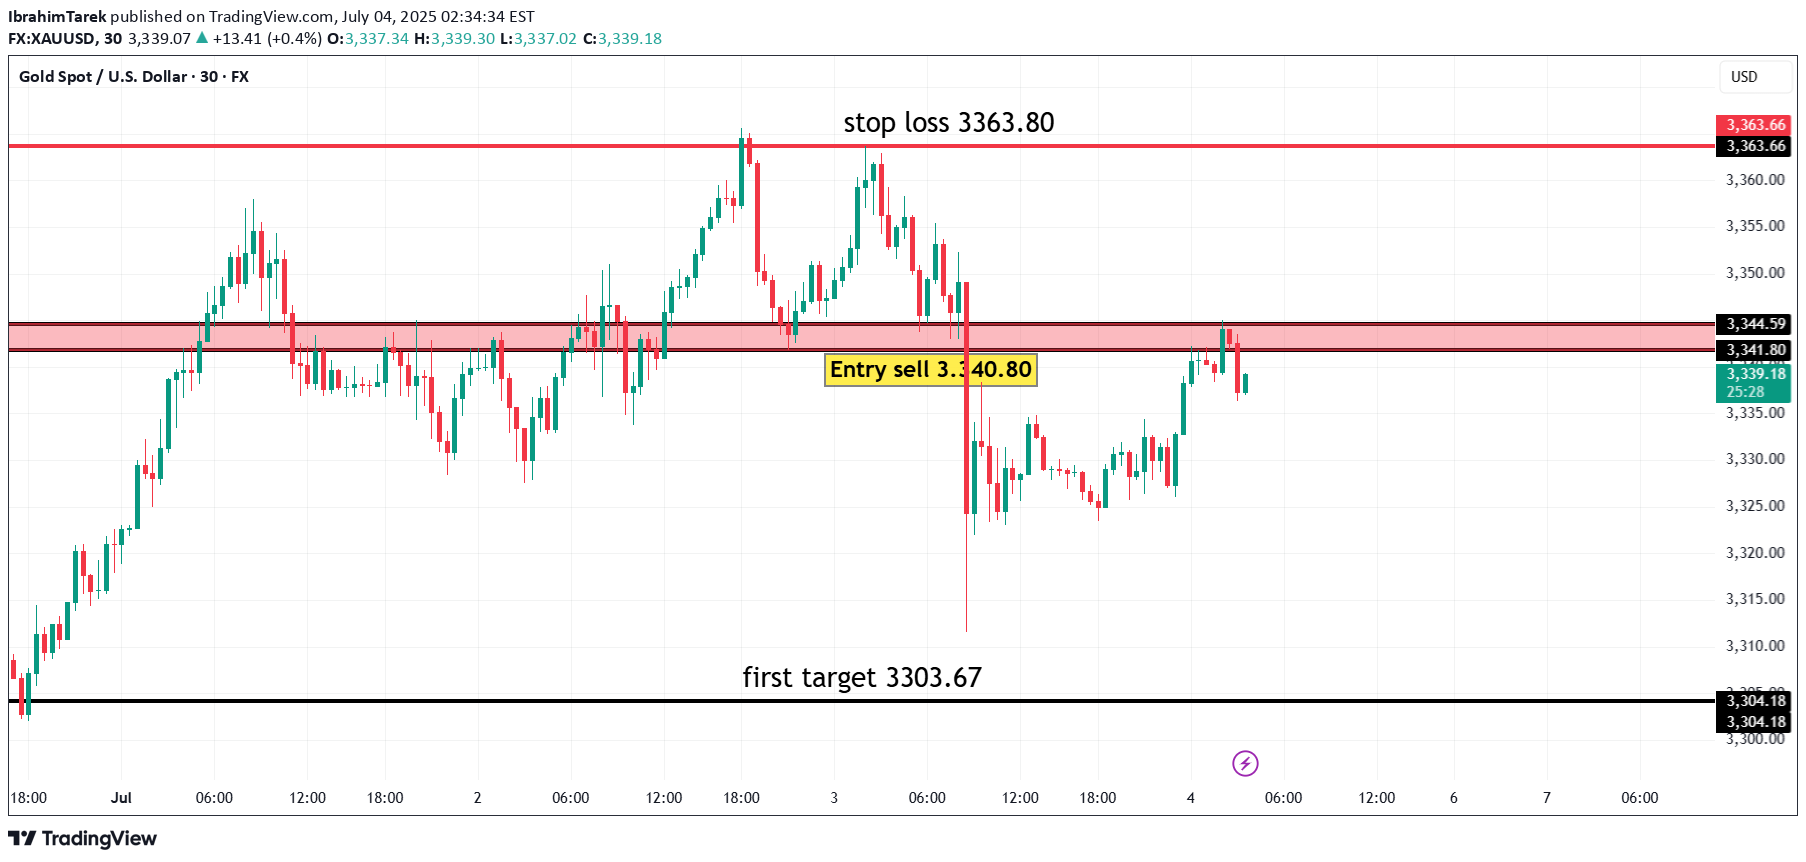
gold in frame 30 mins is good opportunity to sell from 3,340 with stop 3,352 target is 3303.67achived
Disclaimer
Any content and materials included in Sahmeto's website and official communication channels are a compilation of personal opinions and analyses and are not binding. They do not constitute any recommendation for buying, selling, entering or exiting the stock market and cryptocurrency market. Also, all news and analyses included in the website and channels are merely republished information from official and unofficial domestic and foreign sources, and it is obvious that users of the said content are responsible for following up and ensuring the authenticity and accuracy of the materials. Therefore, while disclaiming responsibility, it is declared that the responsibility for any decision-making, action, and potential profit and loss in the capital market and cryptocurrency market lies with the trader.