Technical analysis by IbrahimTarek about Symbol ADA: Sell recommendation (8/17/2025)

ADA
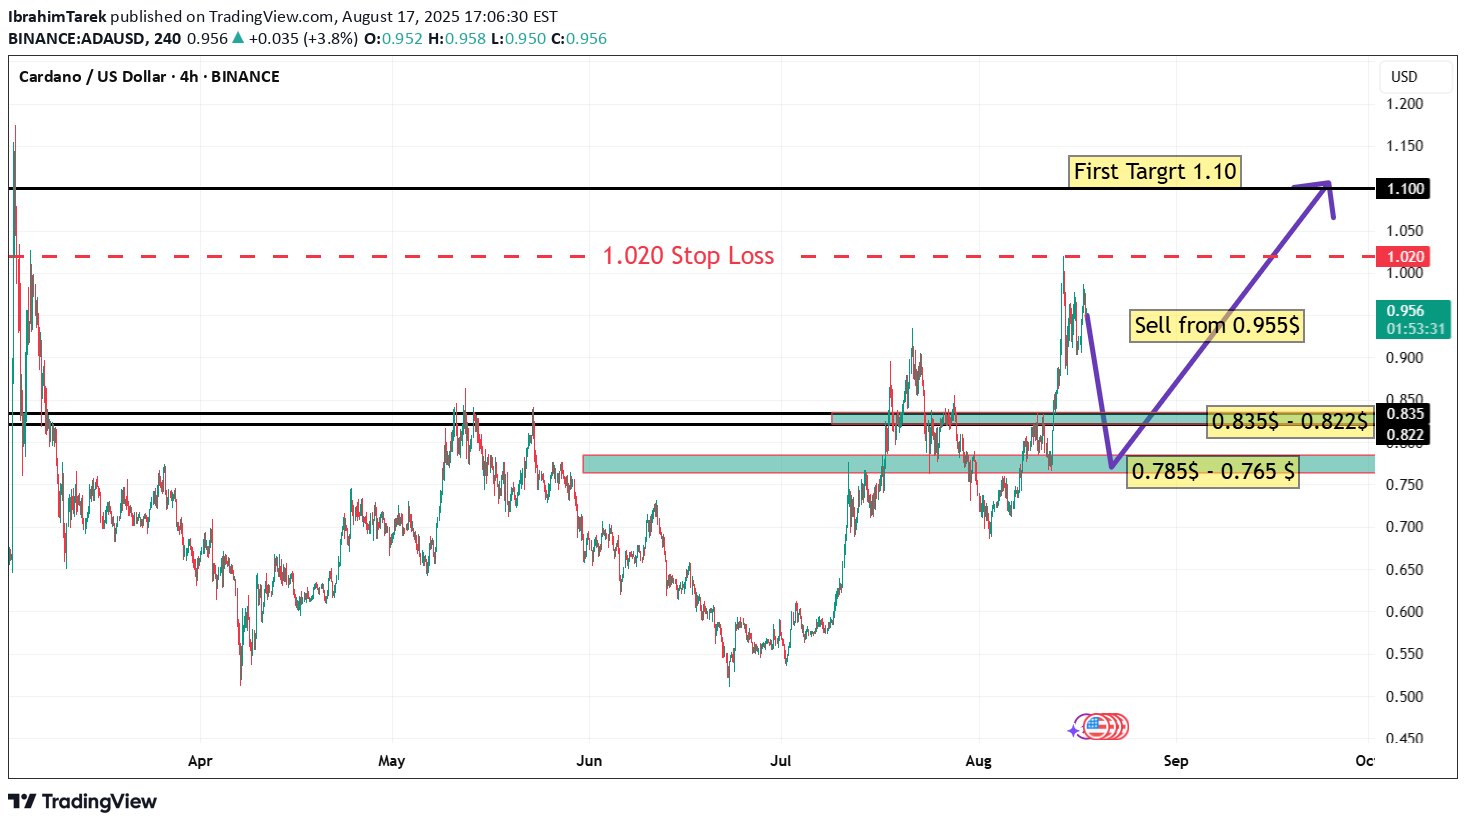
🔎 ADA/USDT Chart Analysis (4H – Binance) Key Levels Highlighted: Sell Zone: around 0.955$ Stop Loss: 1.020$ (above major resistance) Downside Targets: First support zone: 0.835 – 0.822$ Second, deeper support zone: 0.785 – 0.765$ Upside Target (if bullish breakout occurs): 1.10$ 📊 Possible Scenarios: ✅ Bearish Scenario (as shown on the chart): Price is currently testing 0.955$ resistance, which used to be a broken support. As long as the price stays below 1.020$, probability favors a move down toward 0.835 – 0.822$. If that zone breaks, the next target will be the 0.785 – 0.765$ demand area. These zones are potential buy levels for a rebound. ✅ Bullish Alternative Scenario: If the price closes above 1.020$ with strong momentum → the stop loss will be triggered. In that case, the structure flips bullish, targeting 1.10$ as the first upside objective. A breakout above 1.10$ may extend toward 1.18 – 1.20$. 📌 Key Notes: The support areas (0.835 – 0.822$ and 0.785 – 0.765$) are strong demand zones. The trading plan is based on selling at resistance and buying at support. Risk management is crucial due to ADA’s high volatility. Mid-term trend is still ranging/accumulation between 0.75$ – 1.10$. ✅ Summary: Short entry: 0.955$ Take Profit 1: 0.835$ Take Profit 2: 0.785$ Stop Loss: 1.020$ If price breaks above 1.020$ → target becomes 1.10$.