Technical analysis by IbrahimTarek about Symbol NVDAX on 7/7/2025

NVDA
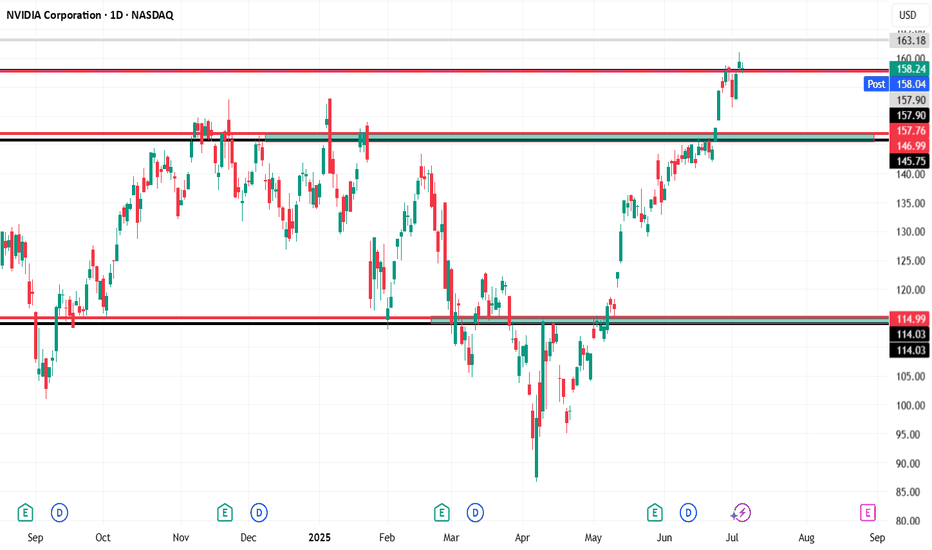
📊 NVIDIA (NVDA) – Daily Chart Technical Analysis Entry Point: A long position is considered at $158, assuming the price holds above $157.78. Resistance & Target: The first target is set at $163, which is a clear resistance zone on the chart based on historical price reactions. If momentum continues beyond that, higher targets could be considered in future analysis. Stop Loss: A tight stop-loss is placed just below key support at $157 to manage risk. 🔄 Weekly Bearish Scenario: If the price closes below $157, this invalidates the bullish setup: The first downside target would be $146, which is a previously established support zone. A further drop could extend toward $115, especially if broader market weakness or sector rotation occurs. 📌 Key Technical Zones: Support Zones: $157.78, $157.00 (critical for bullish continuation) Resistance Zones: $158.12, $163.18 Multiple historical rejections and price consolidations are noted near these zones, highlighting their significance. Summary: As long as NVDA remains above $157.78, the outlook remains bullish targeting $163. However, a confirmed breakdown below $157 could shift the sentiment sharply bearish, targeting $146 and possibly $115.achived