
Henrybillion
@t_Henrybillion

What symbols does the trader recommend buying?
Purchase History
پیام های تریدر
Filter
Henrybillion
نقطه حساس طلا (XAU/USD): آیا حمایت کلیدی سقوط را متوقف میکند؟

Gold continues to trade within a clear downtrend on the H1 timeframe, respecting the descending trendline and forming consistent lower highs. Price is now moving toward a major support zone — an area that has previously triggered strong bullish reactions — making it a critical level to watch for today’s session. Technical Outlook Trendline: Price continues to respect the descending trendline, confirming strong bearish control. Support Zone: 3,985 – 3,995 remains the most important demand area. This zone has acted as a reversal base multiple times. Resistance Levels: Immediate resistance: 4,025 – 4,035 (trendline confluence) Upper resistance: 4,065 – 4,075 Indicators: EMA Structure: Price remains below short-term EMAs → indicates sellers remain dominant. RSI: Approaching oversold territory, suggesting a possible technical rebound. Fibonacci: The 0.618 retracement aligns closely with the support area, increasing its reliability. Price Behavior The chart shows two previous consolidation boxes (accumulation phases), followed by expansions. The current structure is a deep pullback into major support. If selling pressure weakens at this zone, a short-term rebound toward the trendline is likely before the market decides its next major direction. Trading Strategy Scenario 1 – Bullish Rebound at 3,985 – 3,995 Wait for bullish confirmation candles + increasing volume. Entry: 3,995 – 4,005 Target 1: 4,025 Target 2: 4,065 Stop-loss: below 3,975 Scenario 2 – Breakdown Below Support Only trade if price closes clearly below 3,985. Entry: around 3,980 Target 1: 3,960 Target 2: 3,930 Stop-loss: above 4,010 Final Note The overall structure still favors the bearish side, but the support zone below is a decision point for the market. Observe price action carefully before entering. Follow for more daily strategies and insights, and save this analysis if you find it helpful.
Henrybillion
سقوط طلا: شکست تثبیت و تله فروشندگان در خط روند نزولی!

XAU/USD – Price Breaks Consolidation and Retests Downtrend Line, Bearish Momentum Strengthens Gold continues to show a clear bearish structure on the H1 timeframe. After many hours moving sideways inside a tight consolidation box, price has broken below the lower boundary and is now retesting the descending trendline from above. This confirms that sellers are still dominating the short-term market structure. The breakout occurs in alignment with the broader downtrend, supported by declining highs and consistent rejections at the trendline. Volume increases during the breakdown suggest real selling pressure rather than a false move. Technical Structure Overview Trendline: Price retests the descending trendline and reacts immediately, showing strong selling interest. Consolidation Box: Previous range acted as temporary support but has now turned into resistance. EMA Behavior: Price continues trading below short-term EMAs, reinforcing bearish bias. RSI Signal: RSI remains below the midpoint, showing no signs of bullish divergence. Key Levels to Watch Resistance Zones 4023 – 4025: Retest zone at the broken consolidation range. 4040 – 4044: Higher resistance aligned with EMA clusters. 4050 – 4054: Major H1 resistance and previous supply zone. Support Zones 4011 – 4008: First short-term support area. 3999 – 3988: Stronger support with historical buying pressure. 3975 – 3967: Deeper support zone and Fibonacci confluence area. Trading Strategy for Today 1. Bearish Continuation Setup (Primary Plan) Entry Zone: 4019 – 4023 (retest of the broken range and trendline) Stop-Loss: Above 4028 – 4032 Target 1: 4008 Target 2: 3995 Target 3: 3978 This setup aligns with the dominant downtrend and offers a favorable risk-reward profile. 2. Alternative Bullish Scenario (Only if conditions change) A bullish recovery only becomes valid if: Price reclaims 4040 on H1 Candle closes firmly above the trendline and EMAs If this happens, price may attempt a move toward 4054 and 4065. Price Outlook As long as gold remains below the descending trendline, the path of least resistance continues to be down. Bears are in control, and any pullback toward resistance should be viewed as an opportunity to follow the trend. Remember to follow your plan and adjust position size carefully. If you find this analysis helpful, save it for later review or follow for more daily trade strategies.
Henrybillion
طلا سقوط میکند؟ نشانههای ساختاری برای اصلاح عمیقتر XAU/USD در تایمفریم H1
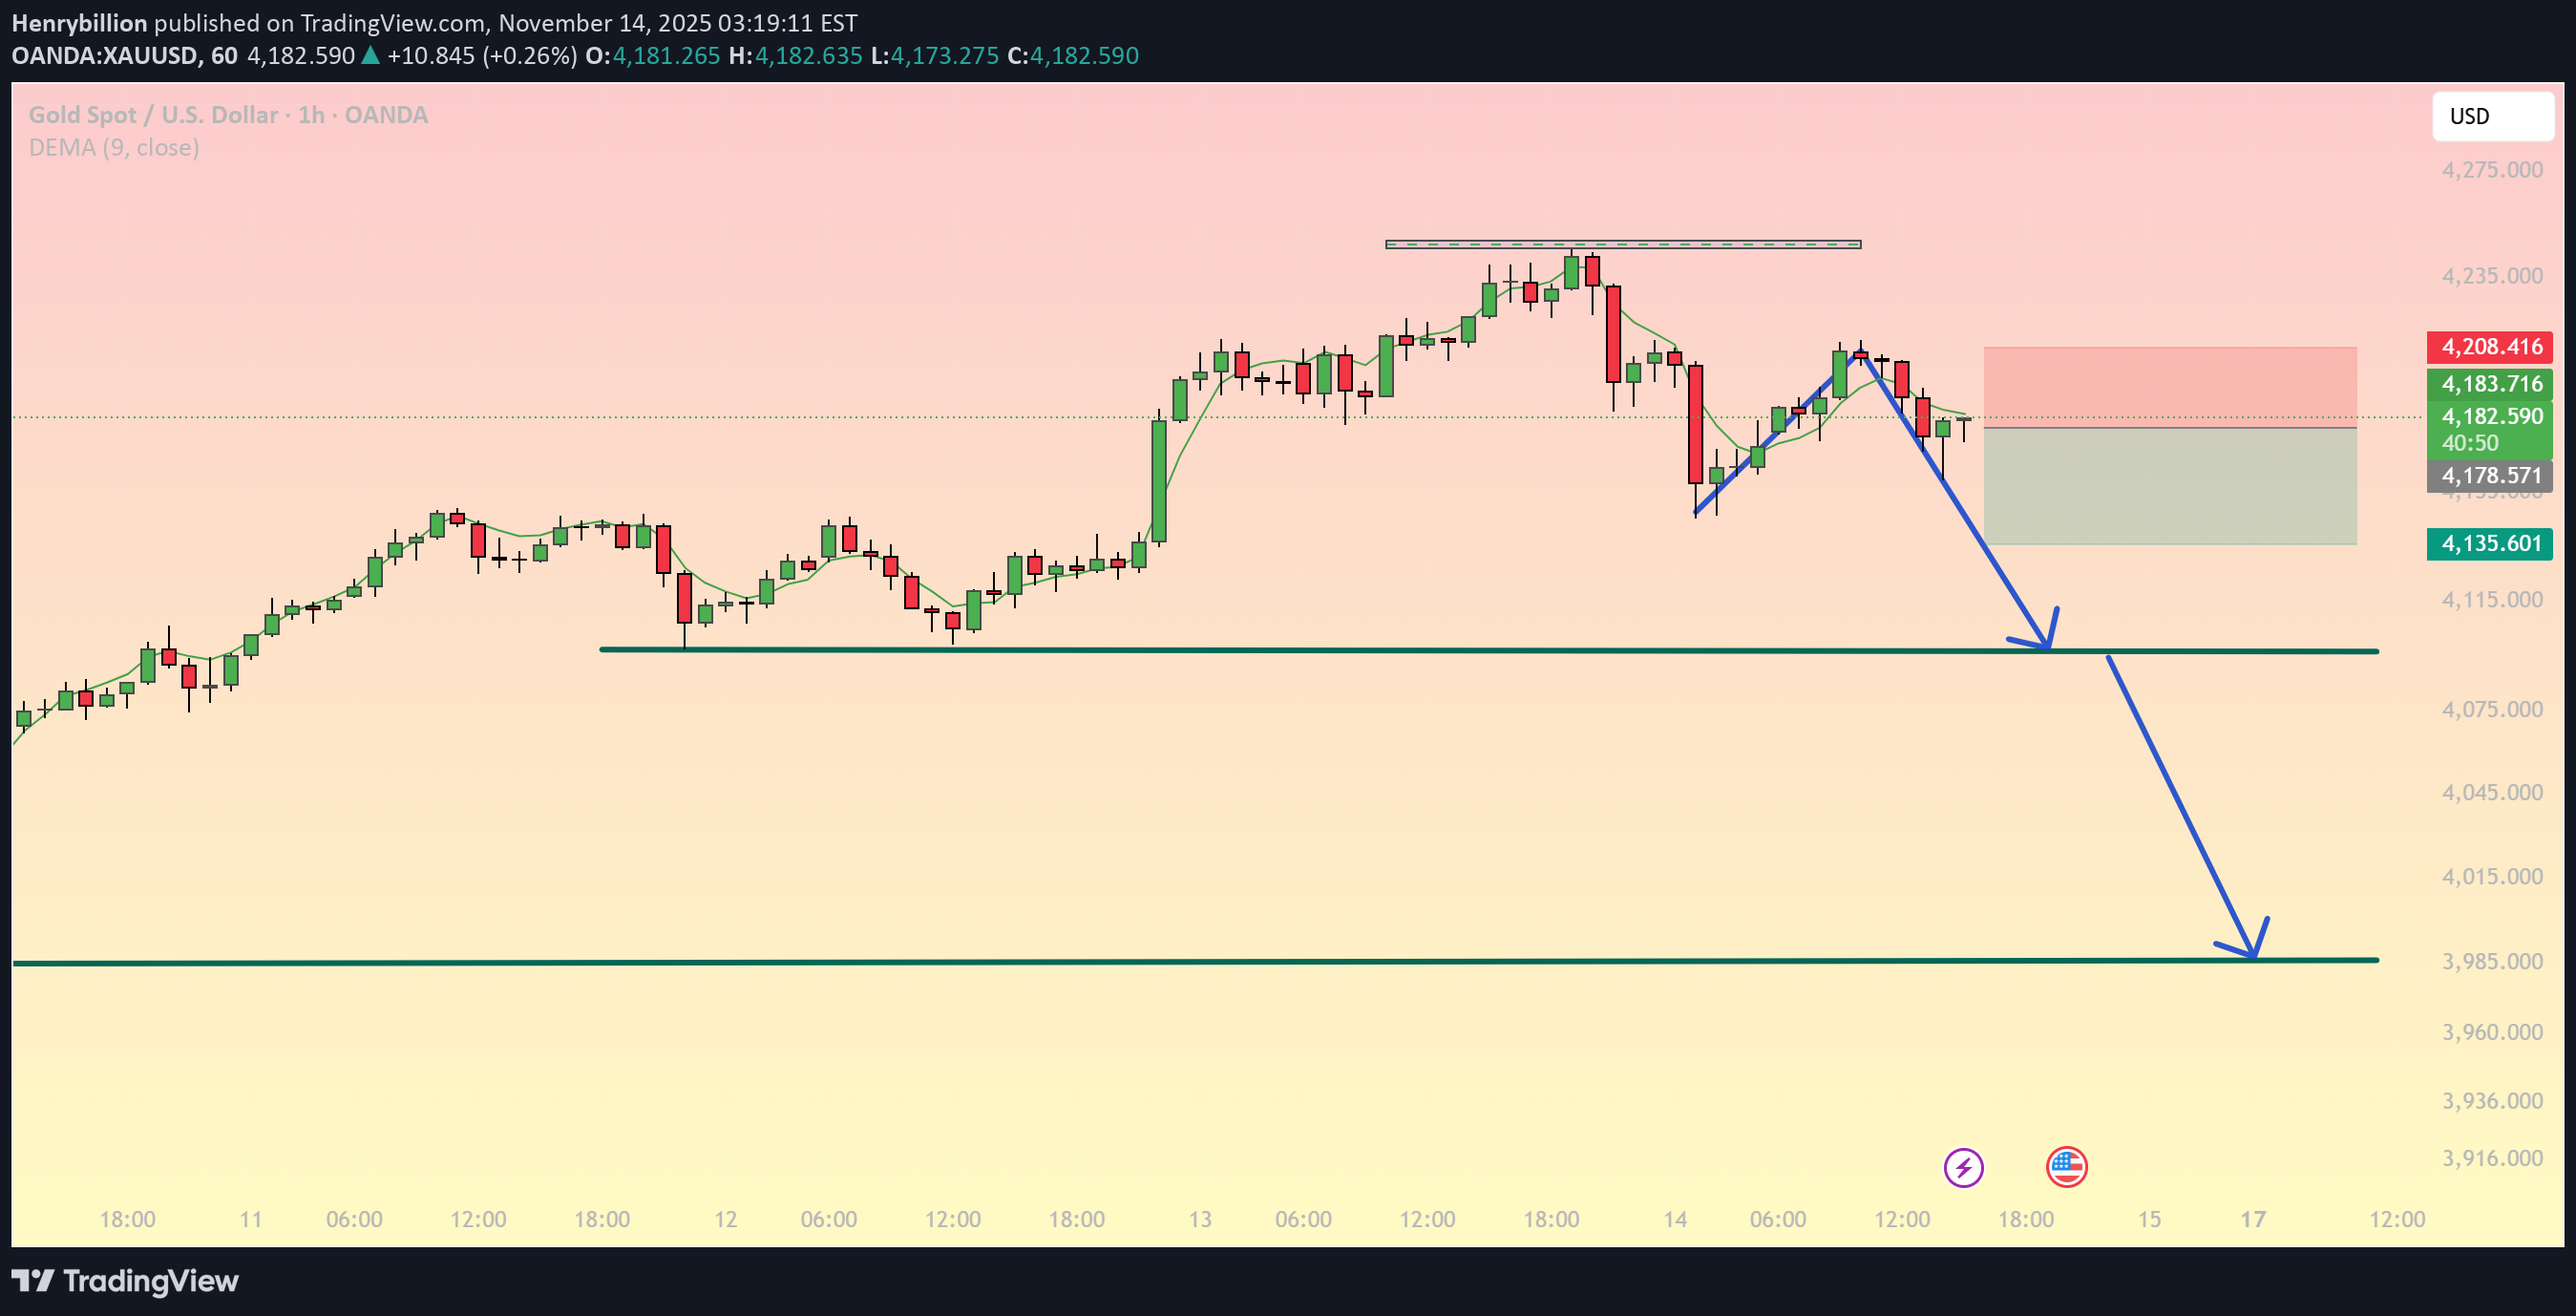
XAU/USD – Breakdown Structure Signals Potential Deeper Correction on H1 Gold is showing early signs of a structural breakdown on the H1 timeframe after failing to sustain the recent bullish momentum. Price rejected strongly from the upper resistance zone and has since shifted into a corrective bearish structure. The current movement suggests that sellers may continue pushing price toward lower support levels. 1. Market Context After forming a double rejection at the upper zone around 4208, XAU/USD broke below the short-term trendline and is now retesting the broken structure from below. This behavior often indicates that buyers are losing control while sellers begin to step in. The loss of momentum is supported by the declining position of the DEMA, which now aligns as dynamic resistance. 2. Key Technical Levels Resistance Zone 4200 – 4210 Major rejection area. Price failed to break higher twice, confirming strong seller presence. Support Zones 4135 – 4140 First target zone if bearish continuation unfolds. This level acted as strong structure support earlier. 3980 – 4000 Major support and the next potential destination if selling pressure deepens. 3. Price Structure Analysis A clear lower high has formed after the recent rejection. Momentum shifted from bullish to bearish, shown by the aggressive decline and the corrective pullback. The market is now forming a classic pullback setup into resistance before possible continuation downward. The projected arrows on the chart align with a corrective bounce followed by a strong drop toward the deeper support. 4. Trading Scenarios Primary: Bearish Continuation Expect price to retest 4180 – 4190. If price fails to close back above this zone, bearish pressure is likely to continue. Downside targets: 4135 – 4140, followed by 3980 – 4000 if the structure fully breaks. Alternative: Bullish Recovery Only valid if price closes above 4210 with strong momentum. This would invalidate the current bearish structure and reopen the path toward recent highs. 5. Outlook Summary XAU/USD is currently trading in a corrective bearish structure, with lower highs and weakening bullish momentum. Unless buyers reclaim the 4200 area, the market is likely to continue sliding toward the deeper support zones. Monitoring the reaction at the retest zone will be essential for confirming the next directional move. Follow for more structured trade ideas and multi-timeframe market insights.
Henrybillion
طلا به کدام سمت میرود؟ نشانههای قوی ریزش عمیقتر در بازار XAU/USD
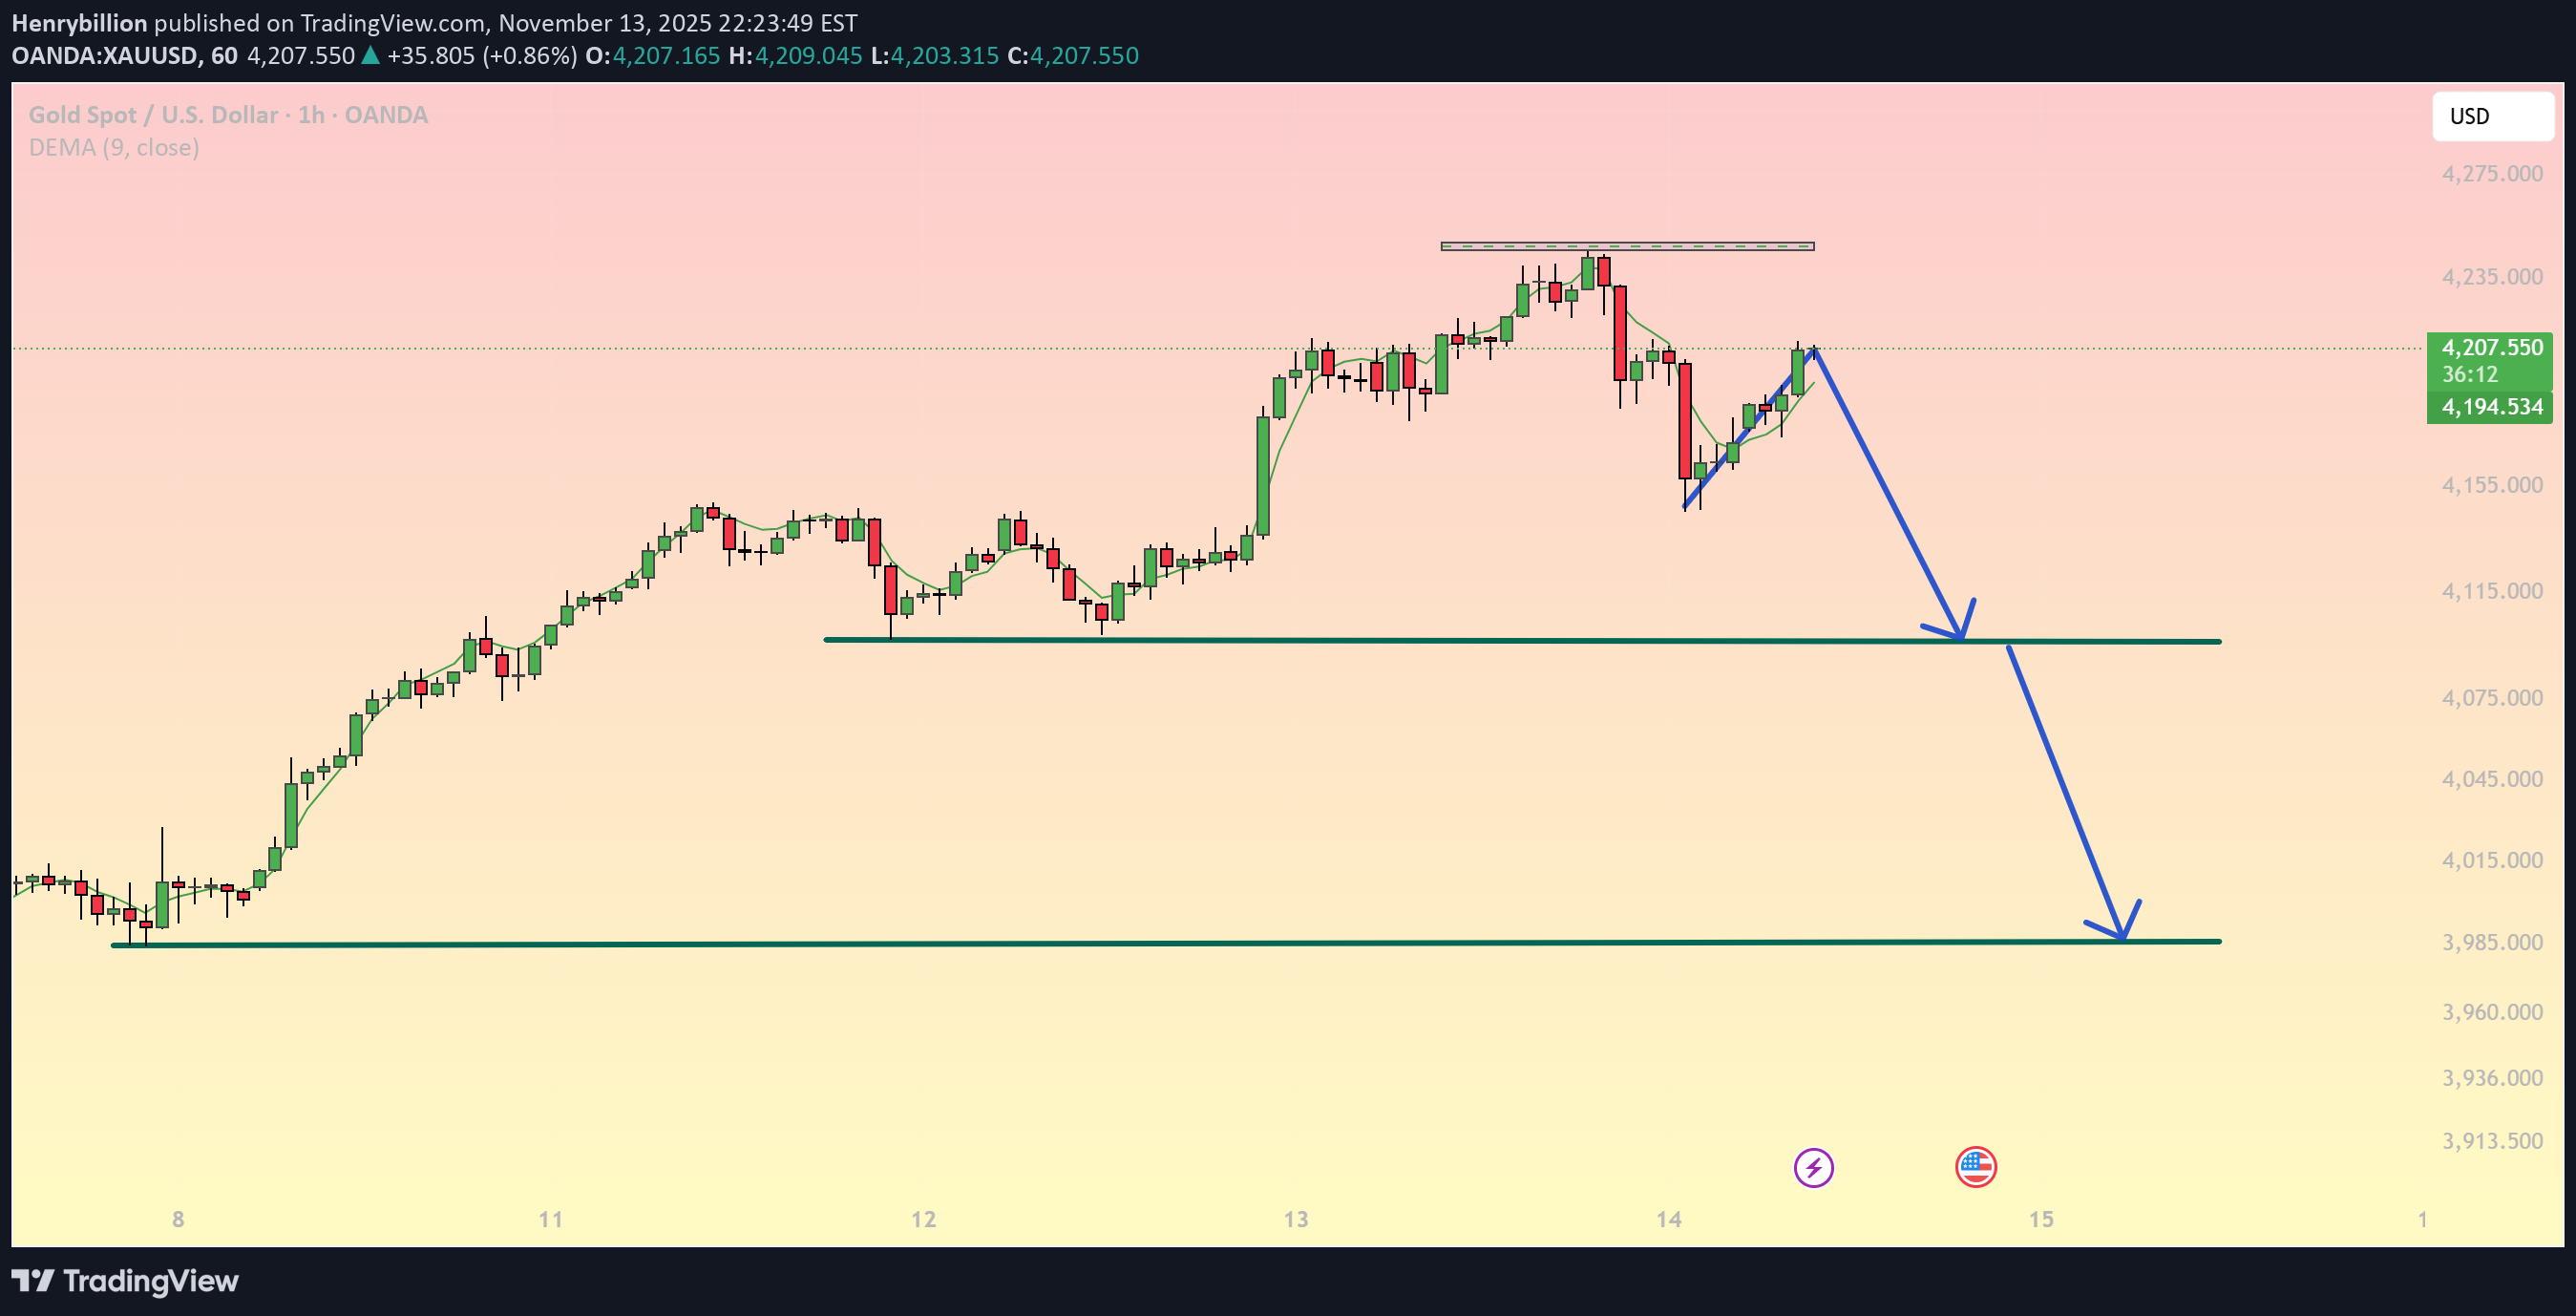
Gold is showing clear signs of weakening momentum on the H1 timeframe as price forms a flat-top rejection near 4,232–4,235, a zone where buyers have repeatedly failed to break higher. This signals the early stage of a potential deeper correction. Current price action shows a weak technical pullback into EMA9, while the newly formed lower high – lower low structure confirms short-term bearish pressure. A descending trendline has developed, indicating sellers are gradually regaining control. Key Technical Levels Resistance 4,232 – 4,235: Major rejection zone (flat-top structure). EMA9 around 4,194: Acting as dynamic resistance during the pullback. Support 4,115 – 4,120: Critical neckline of the structure; a break opens room for deeper downside. 3,985 – 4,000: Strong support, aligning with the previous major swing low. Technical Breakdown – Tools & Signals Fibonacci: Previous decline bounced at the 38.2% level; the weak reaction suggests price may return to test 50%–61.8%, aligning with 4,115. Trendline: The short-term descending trendline is guiding the correction. Only a clean break above it will shift momentum. EMA9: Price is testing but failing to reclaim the EMA, showing fading buying strength. RSI: Bearish divergence from the previous top reinforces the downside scenario. Trading Strategy 1. Sell the Pullback (Primary Setup) Entry: 4,205 – 4,215 (EMA9 + descending trendline confluence) Target 1: 4,115 Target 2: 3,985 Stop-loss: 4,245 (above flat-top resistance) 2. Sell on Breakdown Condition: H1 candle closes below 4,115 Target: 3,985 Stop-loss: 4,145 3. Short-term Buy (Only with clear reversal signals) Buy Zone: 3,985 – 4,000 Reason: This is a major demand zone with historical strong reactions. Market Outlook Short-term structure is shifting bearish. The current recovery appears corrective, not impulsive—suggesting sellers may soon take over again unless price breaks above 4,215–4,225. If this analysis helps your trading, feel free to follow for more daily XAU/USD strategies.
Henrybillion
طلا (XAU/USD): روند صعودی قدرتمند ادامه دارد؛ سطوح کلیدی خرید کجاست؟
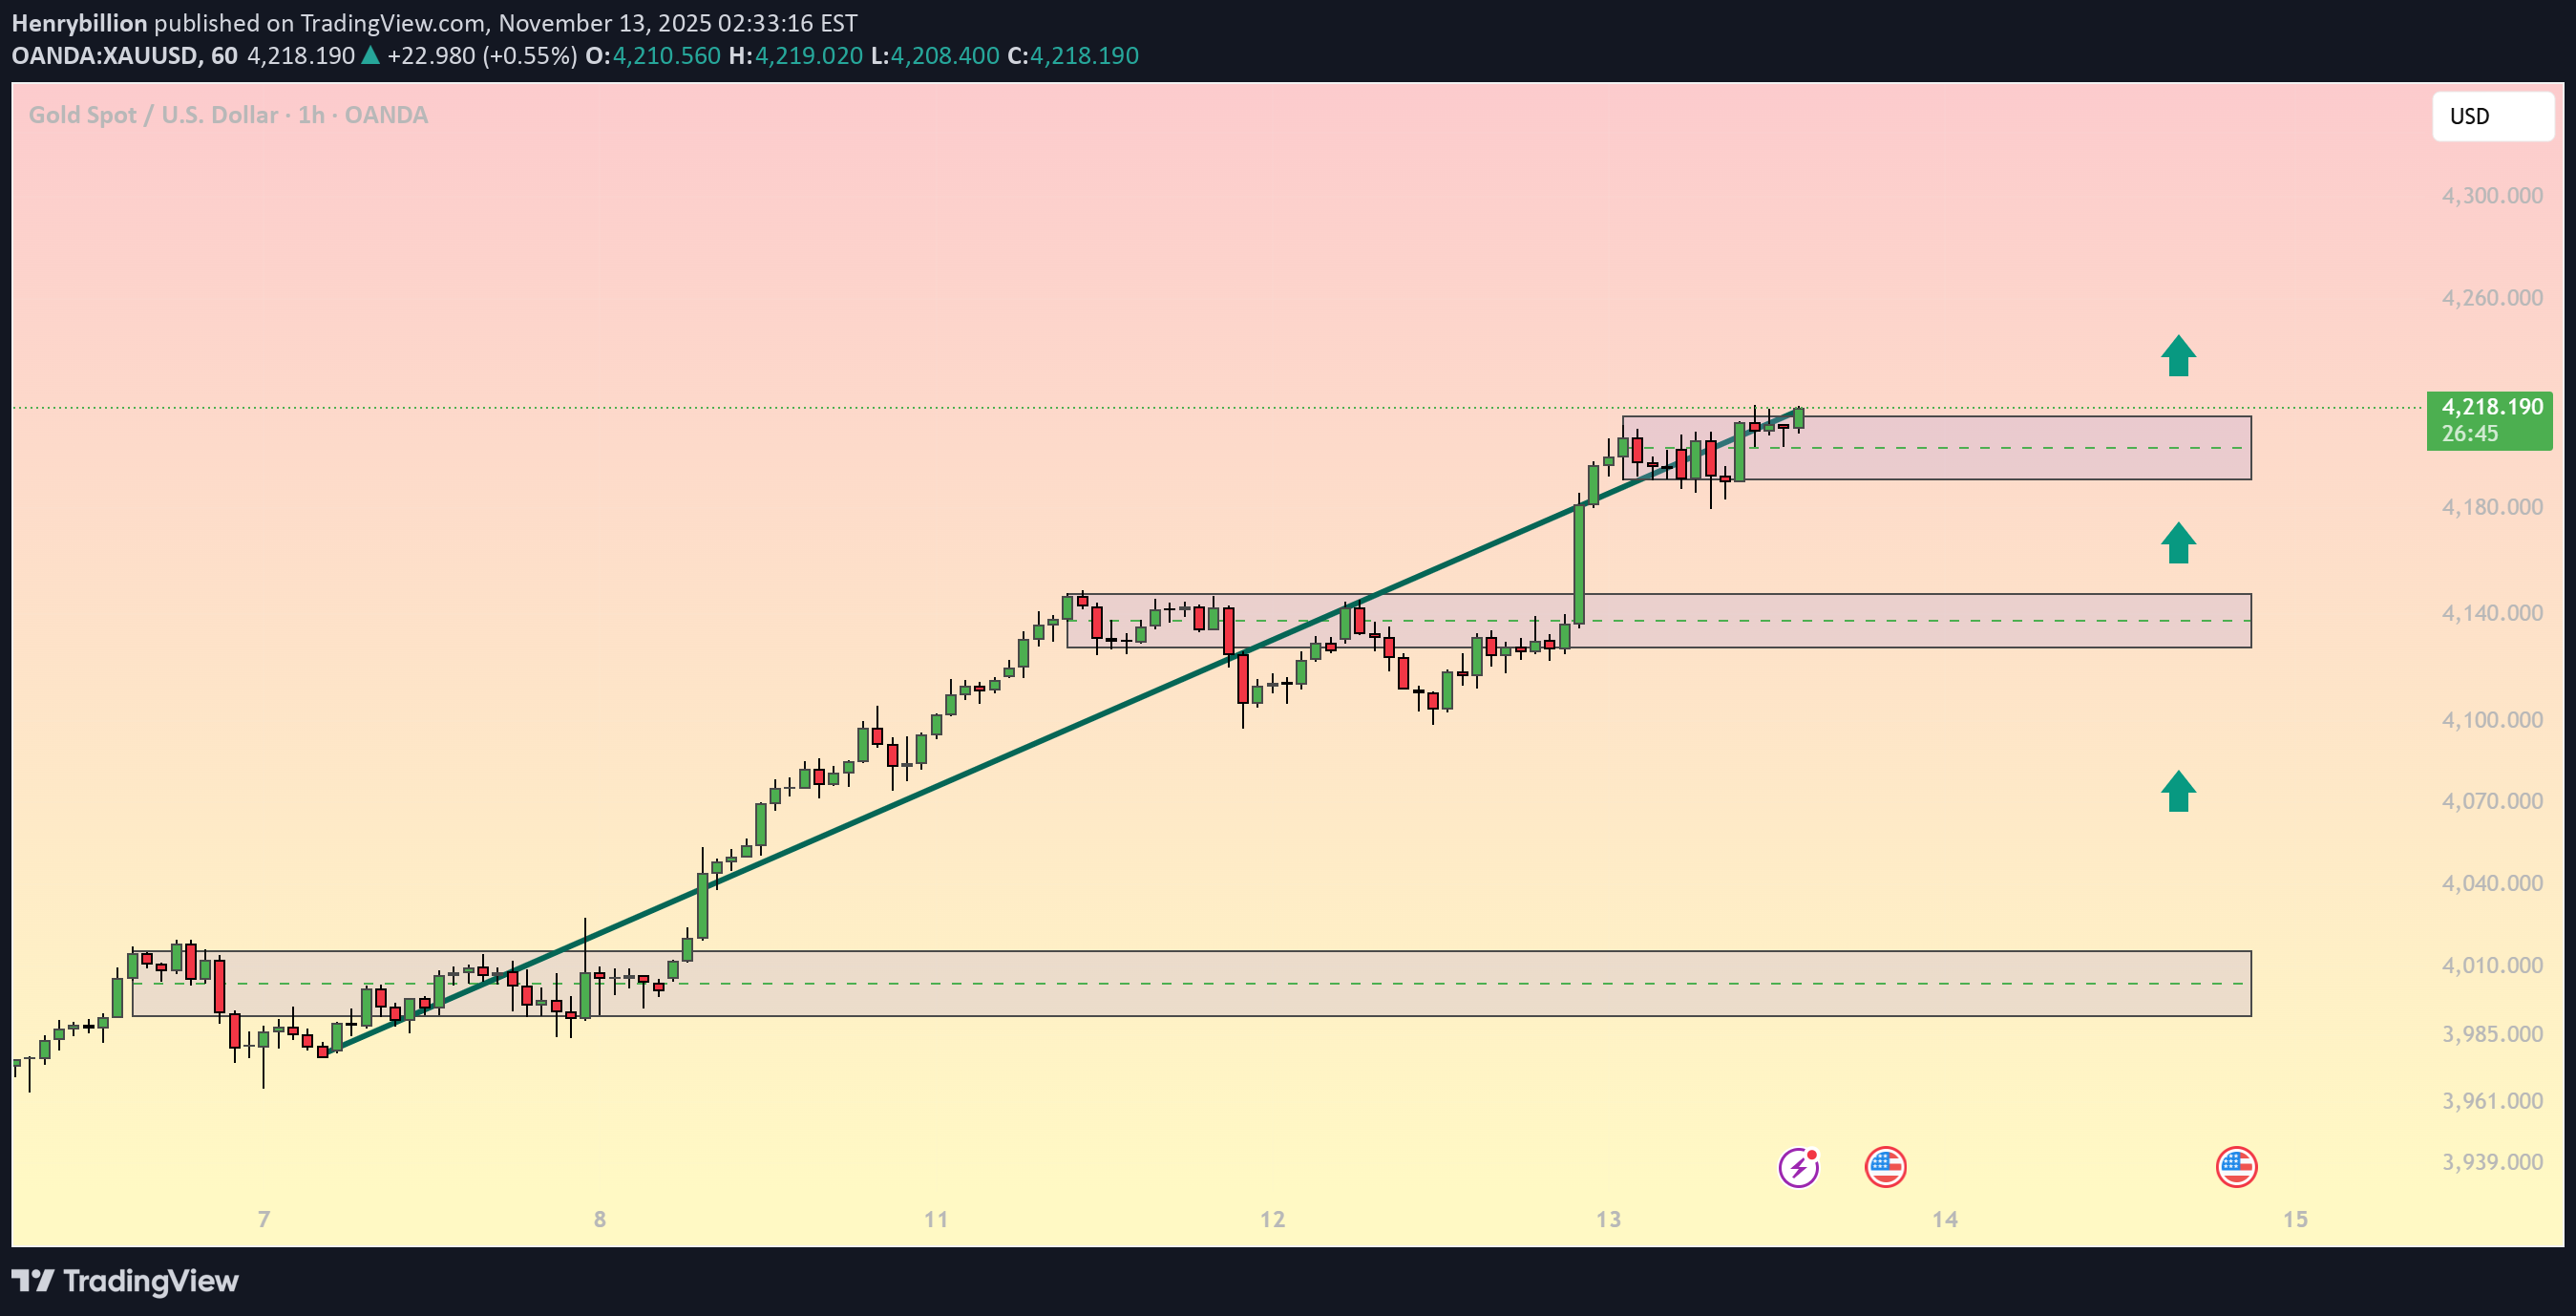
Gold continues to trade in a powerful bullish structure on the H1 timeframe, respecting the ascending trendline and forming steady higher highs and higher lows. After the recent impulsive rally, price is now consolidating just above a newly formed demand zone – a typical pattern before the next breakout. The market remains supported by multiple stacked demand layers, suggesting strong institutional accumulation beneath current price. Key Technical Zones Immediate Demand Zone: 4210 – 4185 Price is holding above this fresh demand block, showing strong buyer presence. Secondary Demand Zone: 4145 – 4125 This zone provided the earlier breakout base and remains a key support for any deeper pullback. Major Demand Base: 4020 – 3985 The origin of the entire uptrend and the area where aggressive buyers previously entered. Market Structure & Trend Analysis Uptrend remains intact with clean reactions at each demand zone Price is consolidating near the highs, often a signal of bullish continuation No bearish break of structure observed Trendline support remains respected throughout the move The current price action suggests that bulls are preparing for another upward push as long as price stays above the nearest demand zone. Trading Strategy Buy the Retest (Primary Setup): Look for a dip into 4210 – 4185 Wait for bullish confirmation candles Target: 4245 and 4260 Deeper Pullback Buy Zone: If price pulls back further, the 4145 – 4125 zone offers a high-probability entry aligned with the trend. Invalidation: A clean H1 close below 4120 would signal weakening bullish structure and open the door to a deeper correction. Summary XAU/USD maintains a strong bullish trend with healthy pullbacks into well-defined demand zones. As long as price holds above key supports, continuation toward new highs remains the dominant scenario. If this analysis aligns with your strategy, follow for more high-quality trading setups each day.
Henrybillion
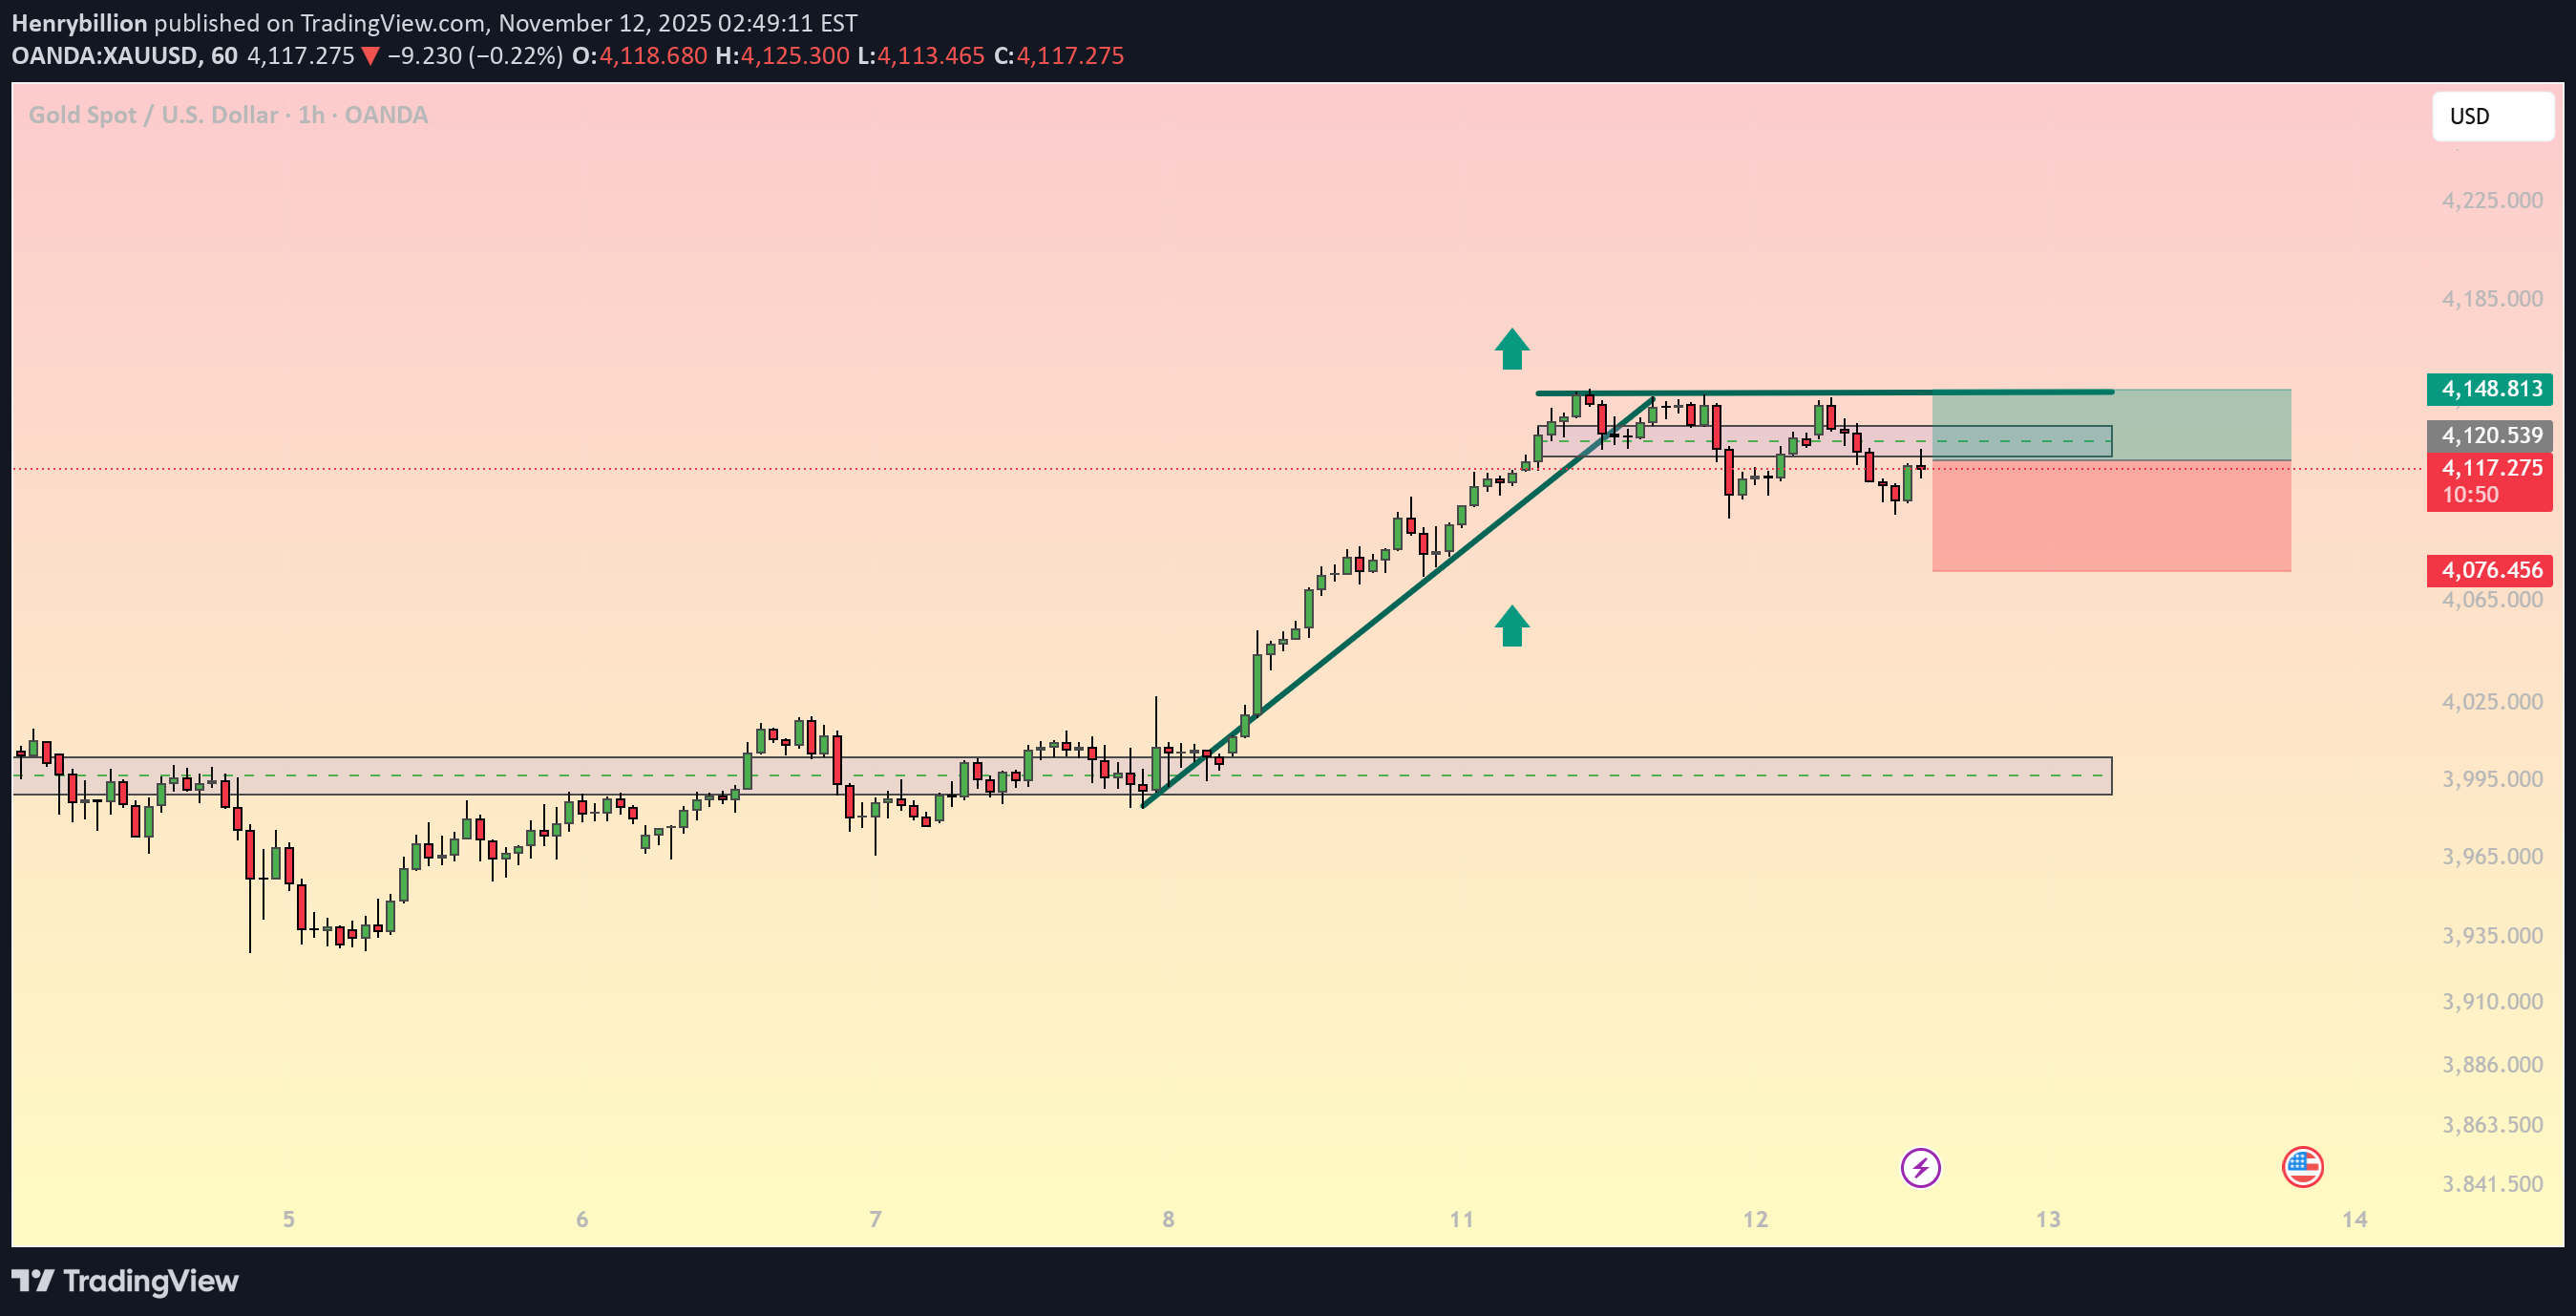
طلا (XAU/USD): توقف قیمت زیر مقاومت حیاتی؛ آیا انفجار قیمتی در راه است؟
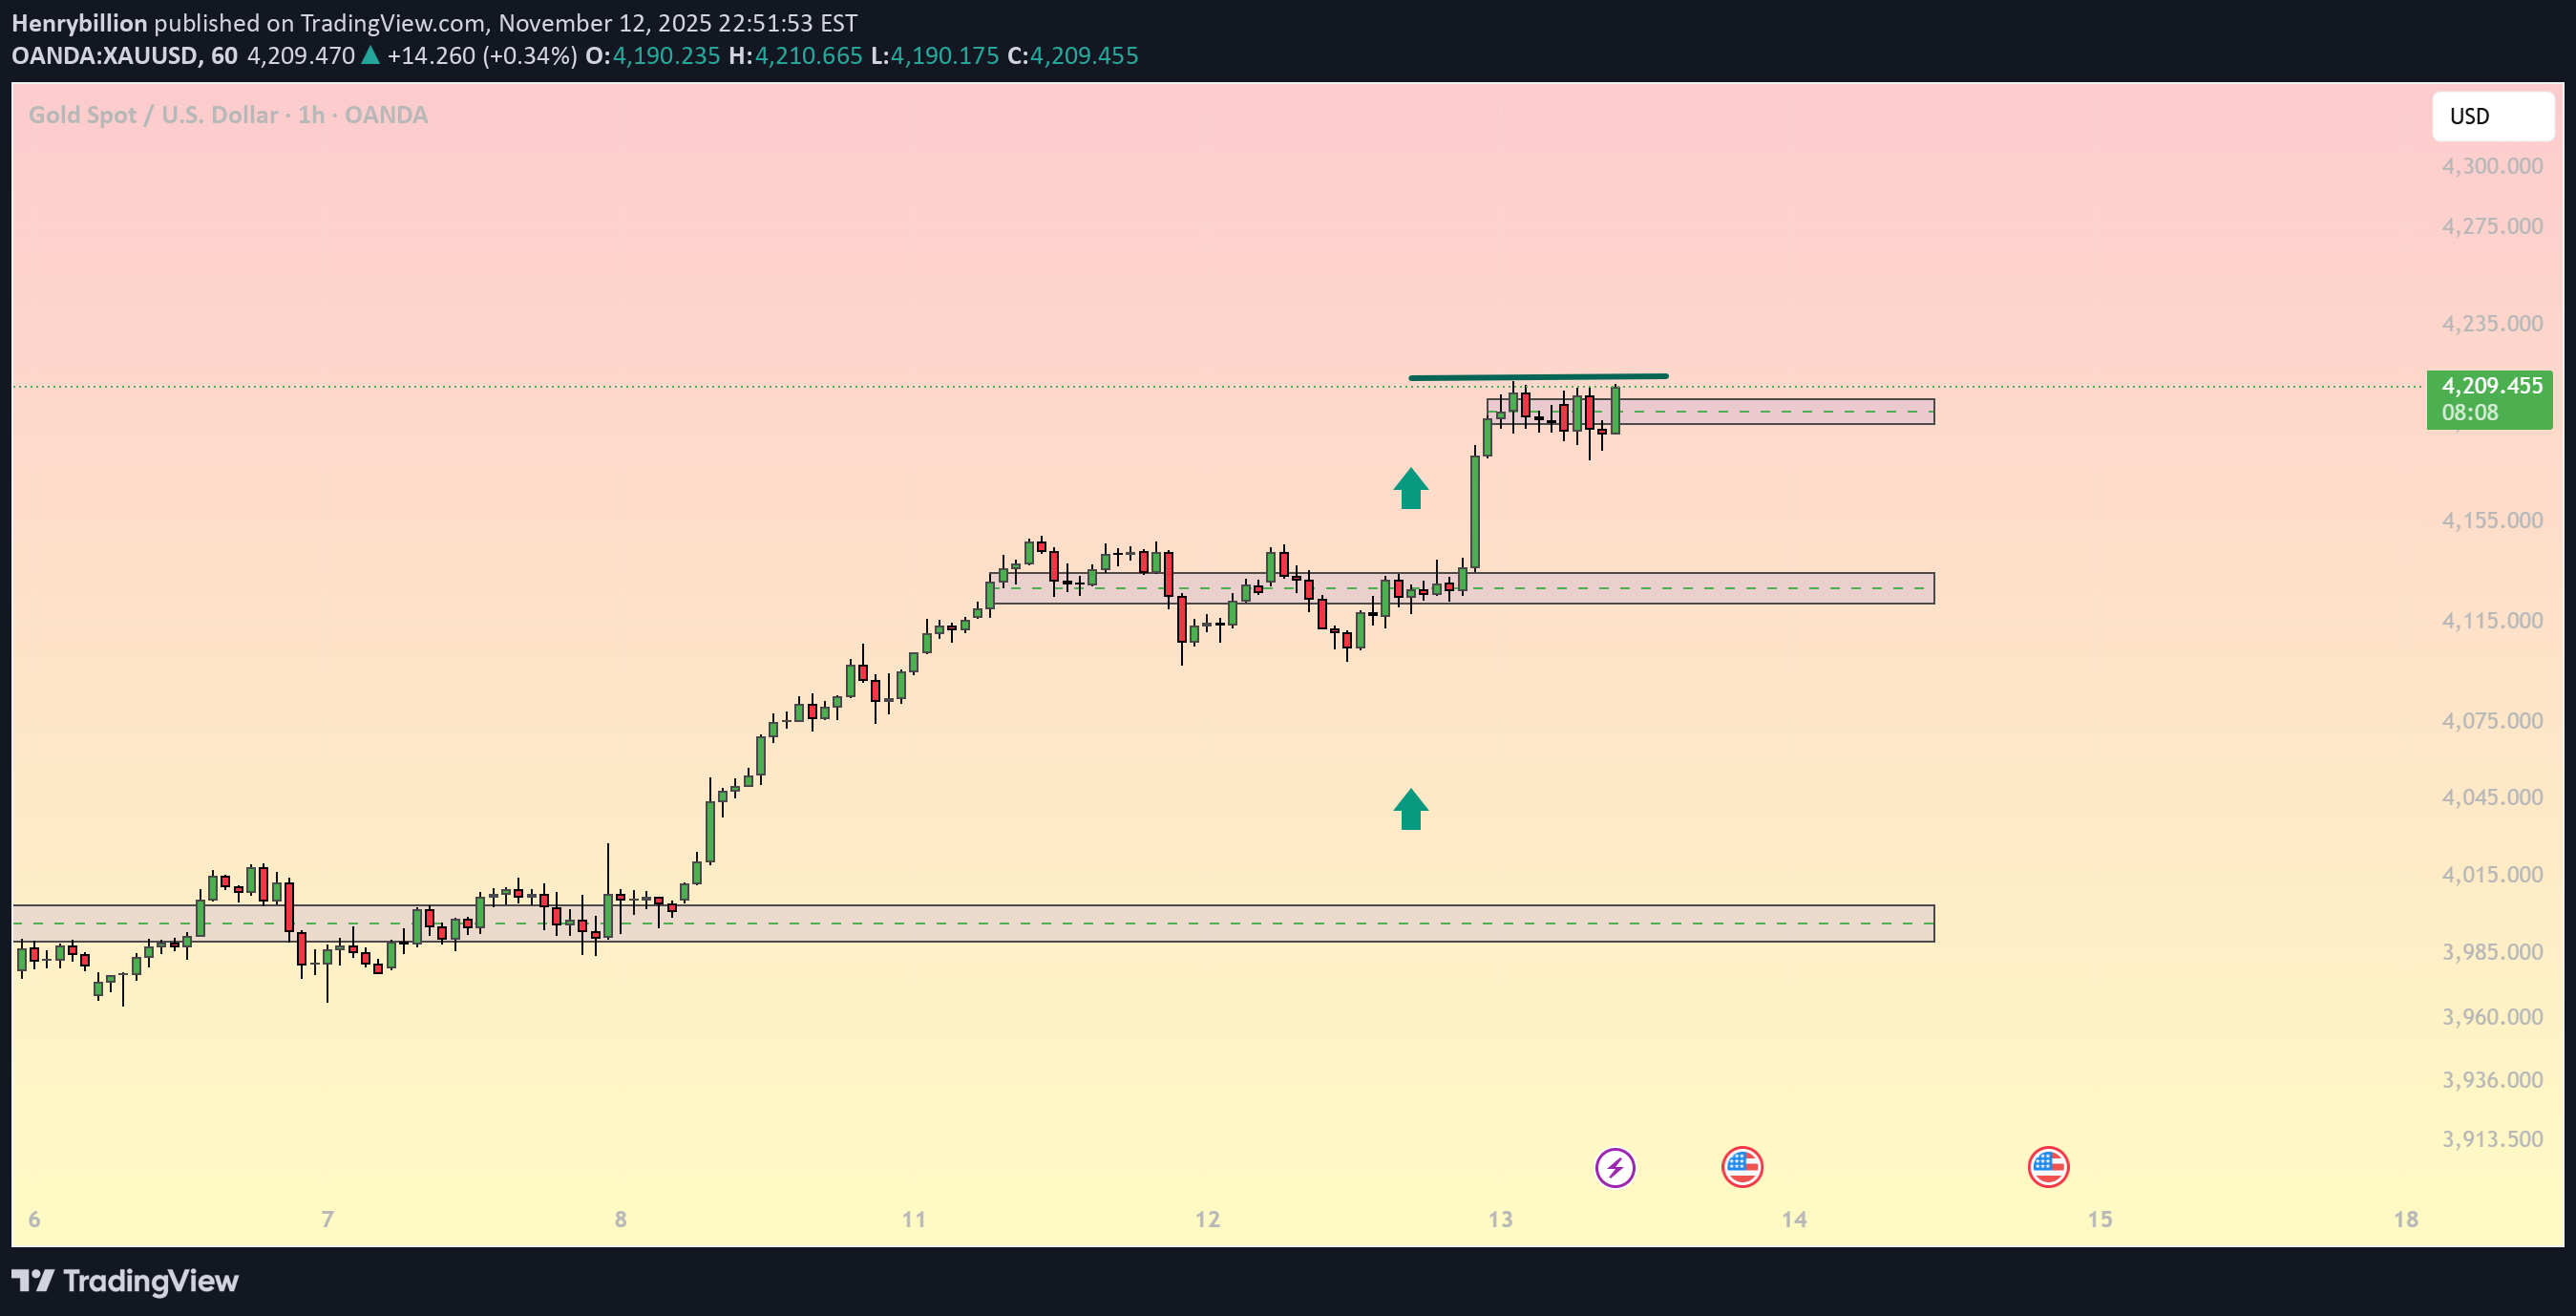
Gold (XAU/USD) – Price Stalls at Key Supply, Compression Signals Imminent Breakout Move Gold continues to remain capped under the 4,148 supply zone, with price forming a tight consolidation range right below resistance. The recent impulsive rally has brought buyers into control, yet the failure to break above the ceiling highlights growing exhaustion and a potential reversal if momentum weakens. From a structural view, price retested multiple demand zones on the way up, respecting bullish orderflow and EMA alignment. However, the current sideways compression at the top suggests that the market is deciding the next directional leg. Key Technical Levels to Watch Immediate Resistance: 4,148 – critical supply where rejection has occurred multiple times Nearest Support: 4,120 – minor demand zone created after the breakout Deeper Support: 4,075 – strong accumulation area Major Support: 3,985 – previous base of the rally Trading Outlook As long as gold remains below 4,148, upside momentum is limited and short-term pullbacks remain possible. A clean break above this level would invalidate the bearish structure and open the door for continuation toward new highs. Conversely, a break back below 4,120 could trigger a deeper correction, with 4,075 as the next logical downside target. The current H1 price compression near supply suggests a high-probability breakout setup is forming. Traders should watch how the next candles react around these key levels to determine the intraday bias. If you find this analysis useful, feel free to follow for more daily strategies and market insights.
Henrybillion
طلا در آستانه سقوط؟ مقاومت حیاتی $4148 در مسیر خریداران طلا
Gold prices have shown strong bullish momentum in recent sessions, but the rally is now encountering significant resistance near the $4,148 zone. After an extended impulse leg, price appears to be losing steam, signaling the potential for a short-term pullback or correction. On the 1-hour timeframe, price has tested the upper resistance multiple times without a clear breakout, forming a potential double-top pattern. The latest bearish candle from this area reinforces the presence of sellers and suggests a possible rejection phase before any continuation. Key Levels to Watch: Resistance: $4,148 – $4,155 (supply zone / neckline area) Support: $4,076 (short-term demand zone), $3,995 (major demand zone) Trading Strategy: Short-term traders could look for bearish confirmation signals below $4,120 for potential short entries, targeting $4,076 as the first take-profit zone. However, if price breaks and closes above $4,148 with volume, it could invalidate the bearish setup and open the door for a continuation toward new highs. Outlook: Neutral-to-bearish in the short term while below $4,148. Watch for price reaction at this level for the next directional move. Follow for more high-probability gold setups and daily technical insights.
Henrybillion
طلا در آستانه انفجار؟ سطوح کلیدی 4100 دلار برای تصمیم نهایی XAU/USD
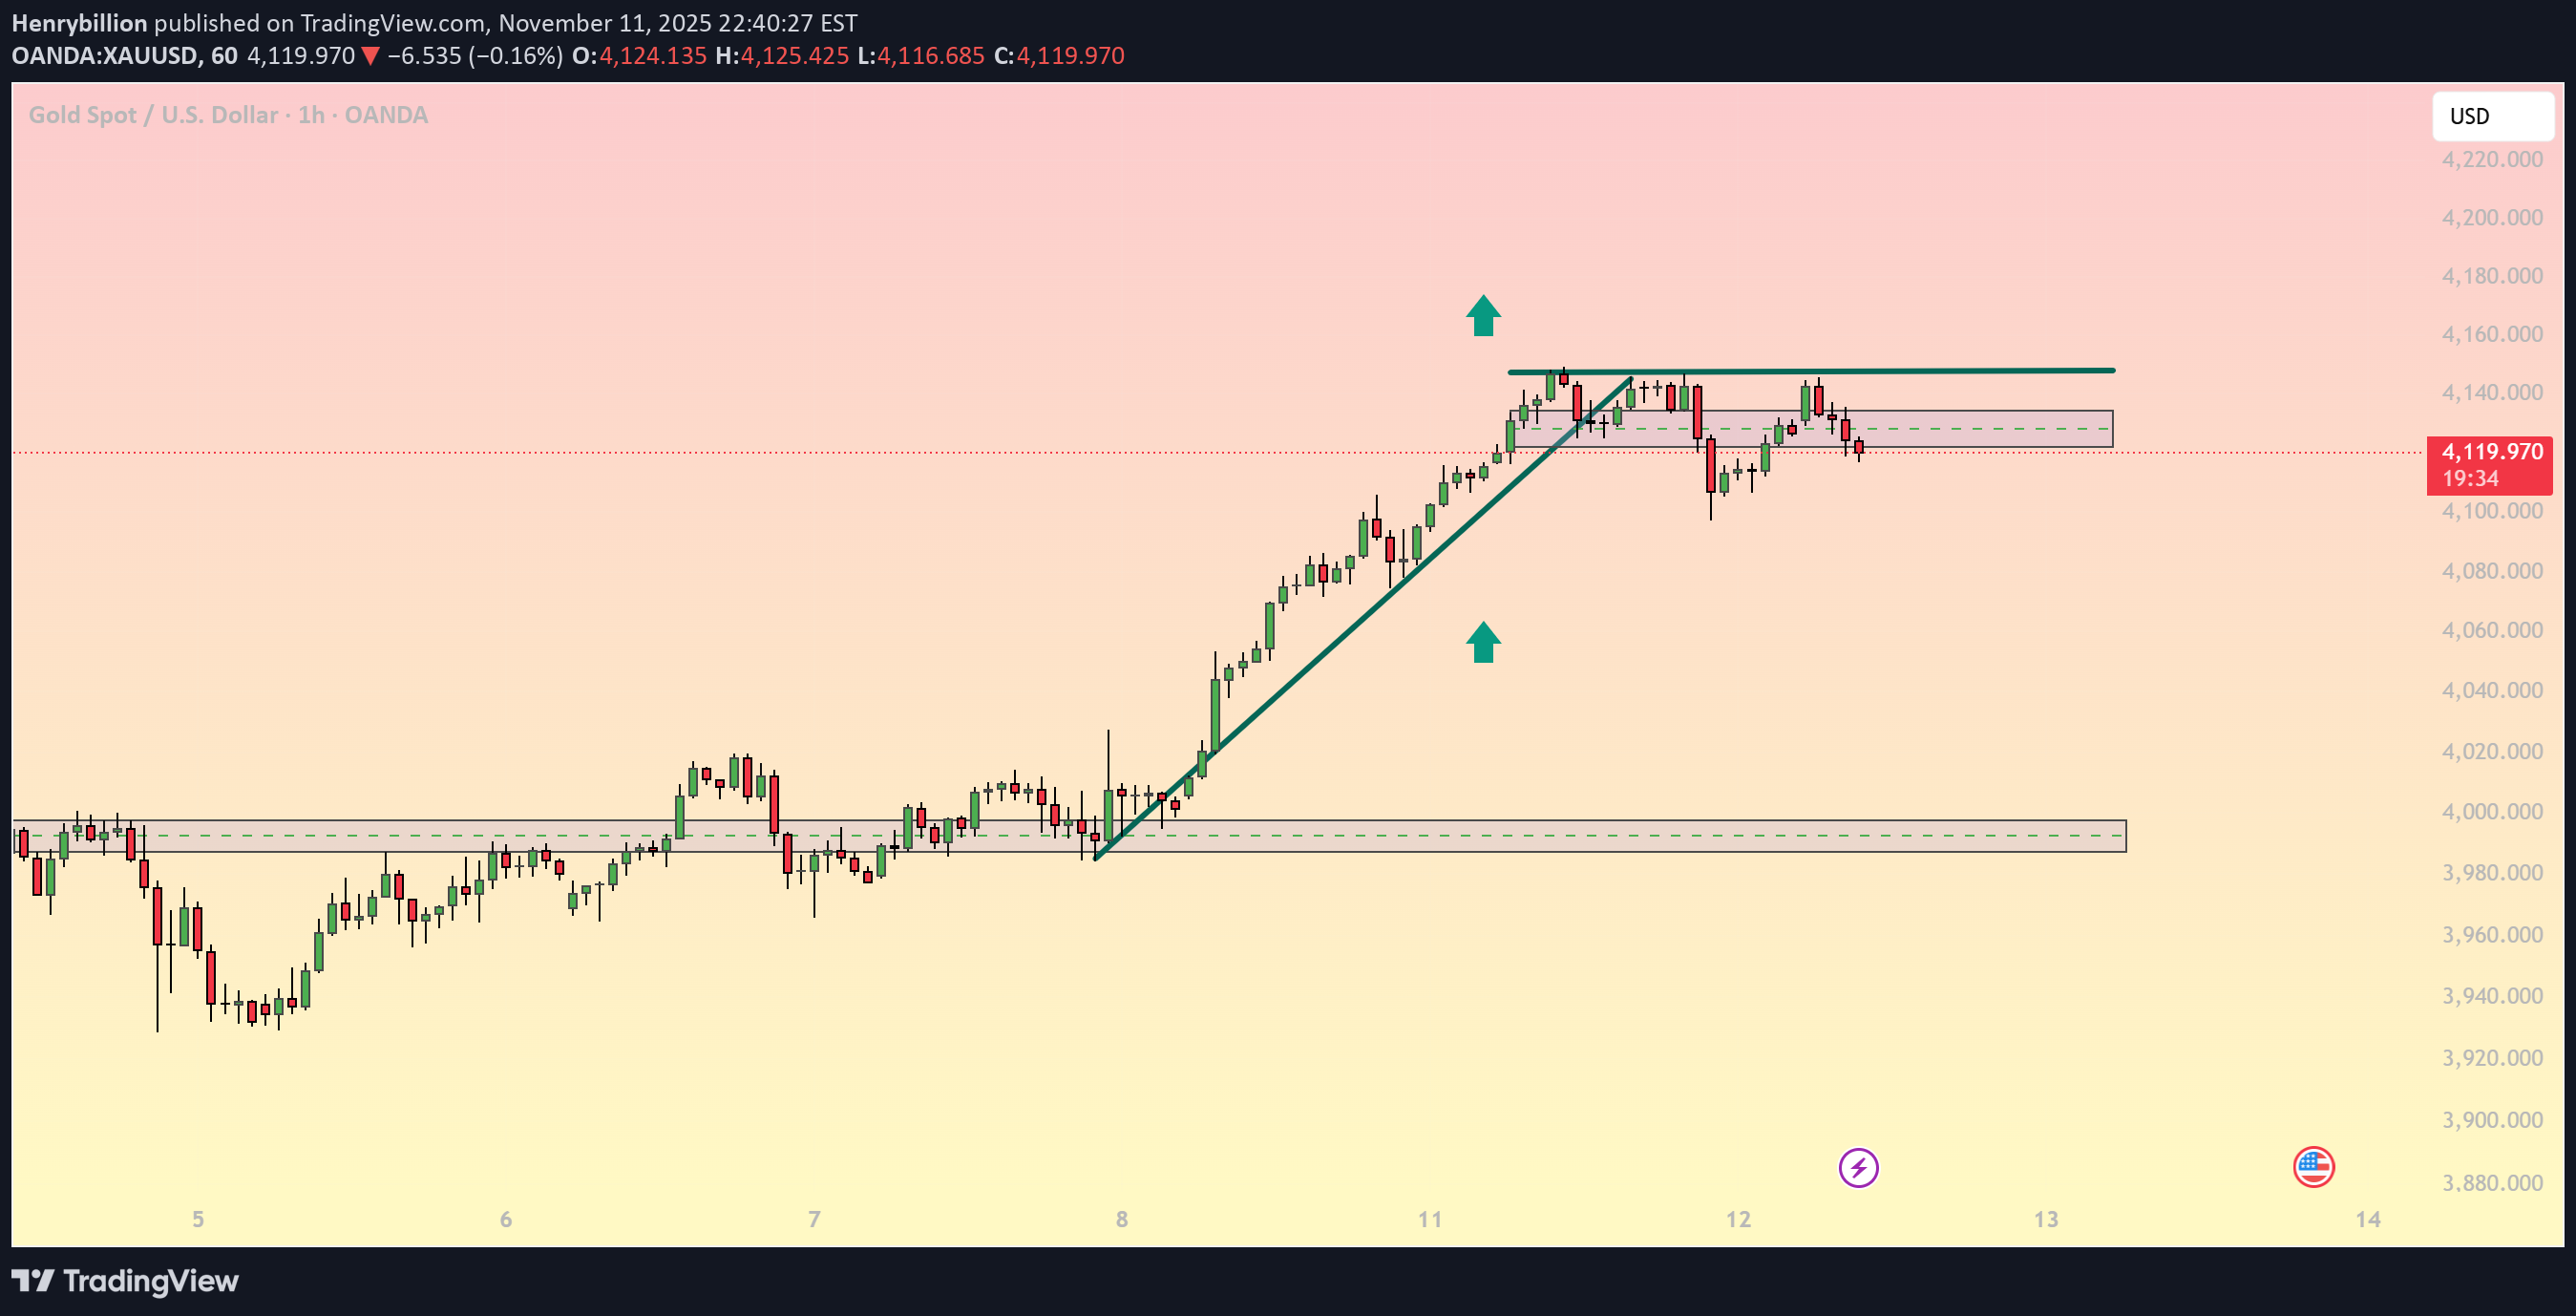
Gold (XAU/USD) on the H1 timeframe is currently showing signs of price consolidation after a sharp bullish impulse that pushed the metal toward the 4,160 zone. The market is now hovering just below that key resistance, forming a short-term range between 4,115 – 4,145. This range represents a decision zone: buyers are attempting to maintain structure above 4,100, while sellers are defending the upper resistance level. As long as price stays above 4,100–4,090, the bullish structure remains intact, and another breakout attempt toward 4,160–4,180 could occur. However, a confirmed close below 4,100 may signal a short-term correction back toward the 4,020–4,000 demand zone, where stronger buyers could reenter the market. Key technical levels: Support: 4,100 – 4,000 Resistance: 4,145 – 4,180 Trading plan: Bullish scenario: Look for buying opportunities near 4,100 with confirmation of bullish price action, targeting 4,160–4,180. Bearish scenario: A break below 4,100 could open the way for a correction toward 4,000. Gold remains in an overall uptrend, but momentum is cooling near resistance. Watch for clear breakout or rejection signals before entering. Follow for more daily gold trading insights and technical setups
Henrybillion
ادامه صعود طلا (XAU/USD): راز حفظ خریداران بالای حمایت کلیدی چیست؟
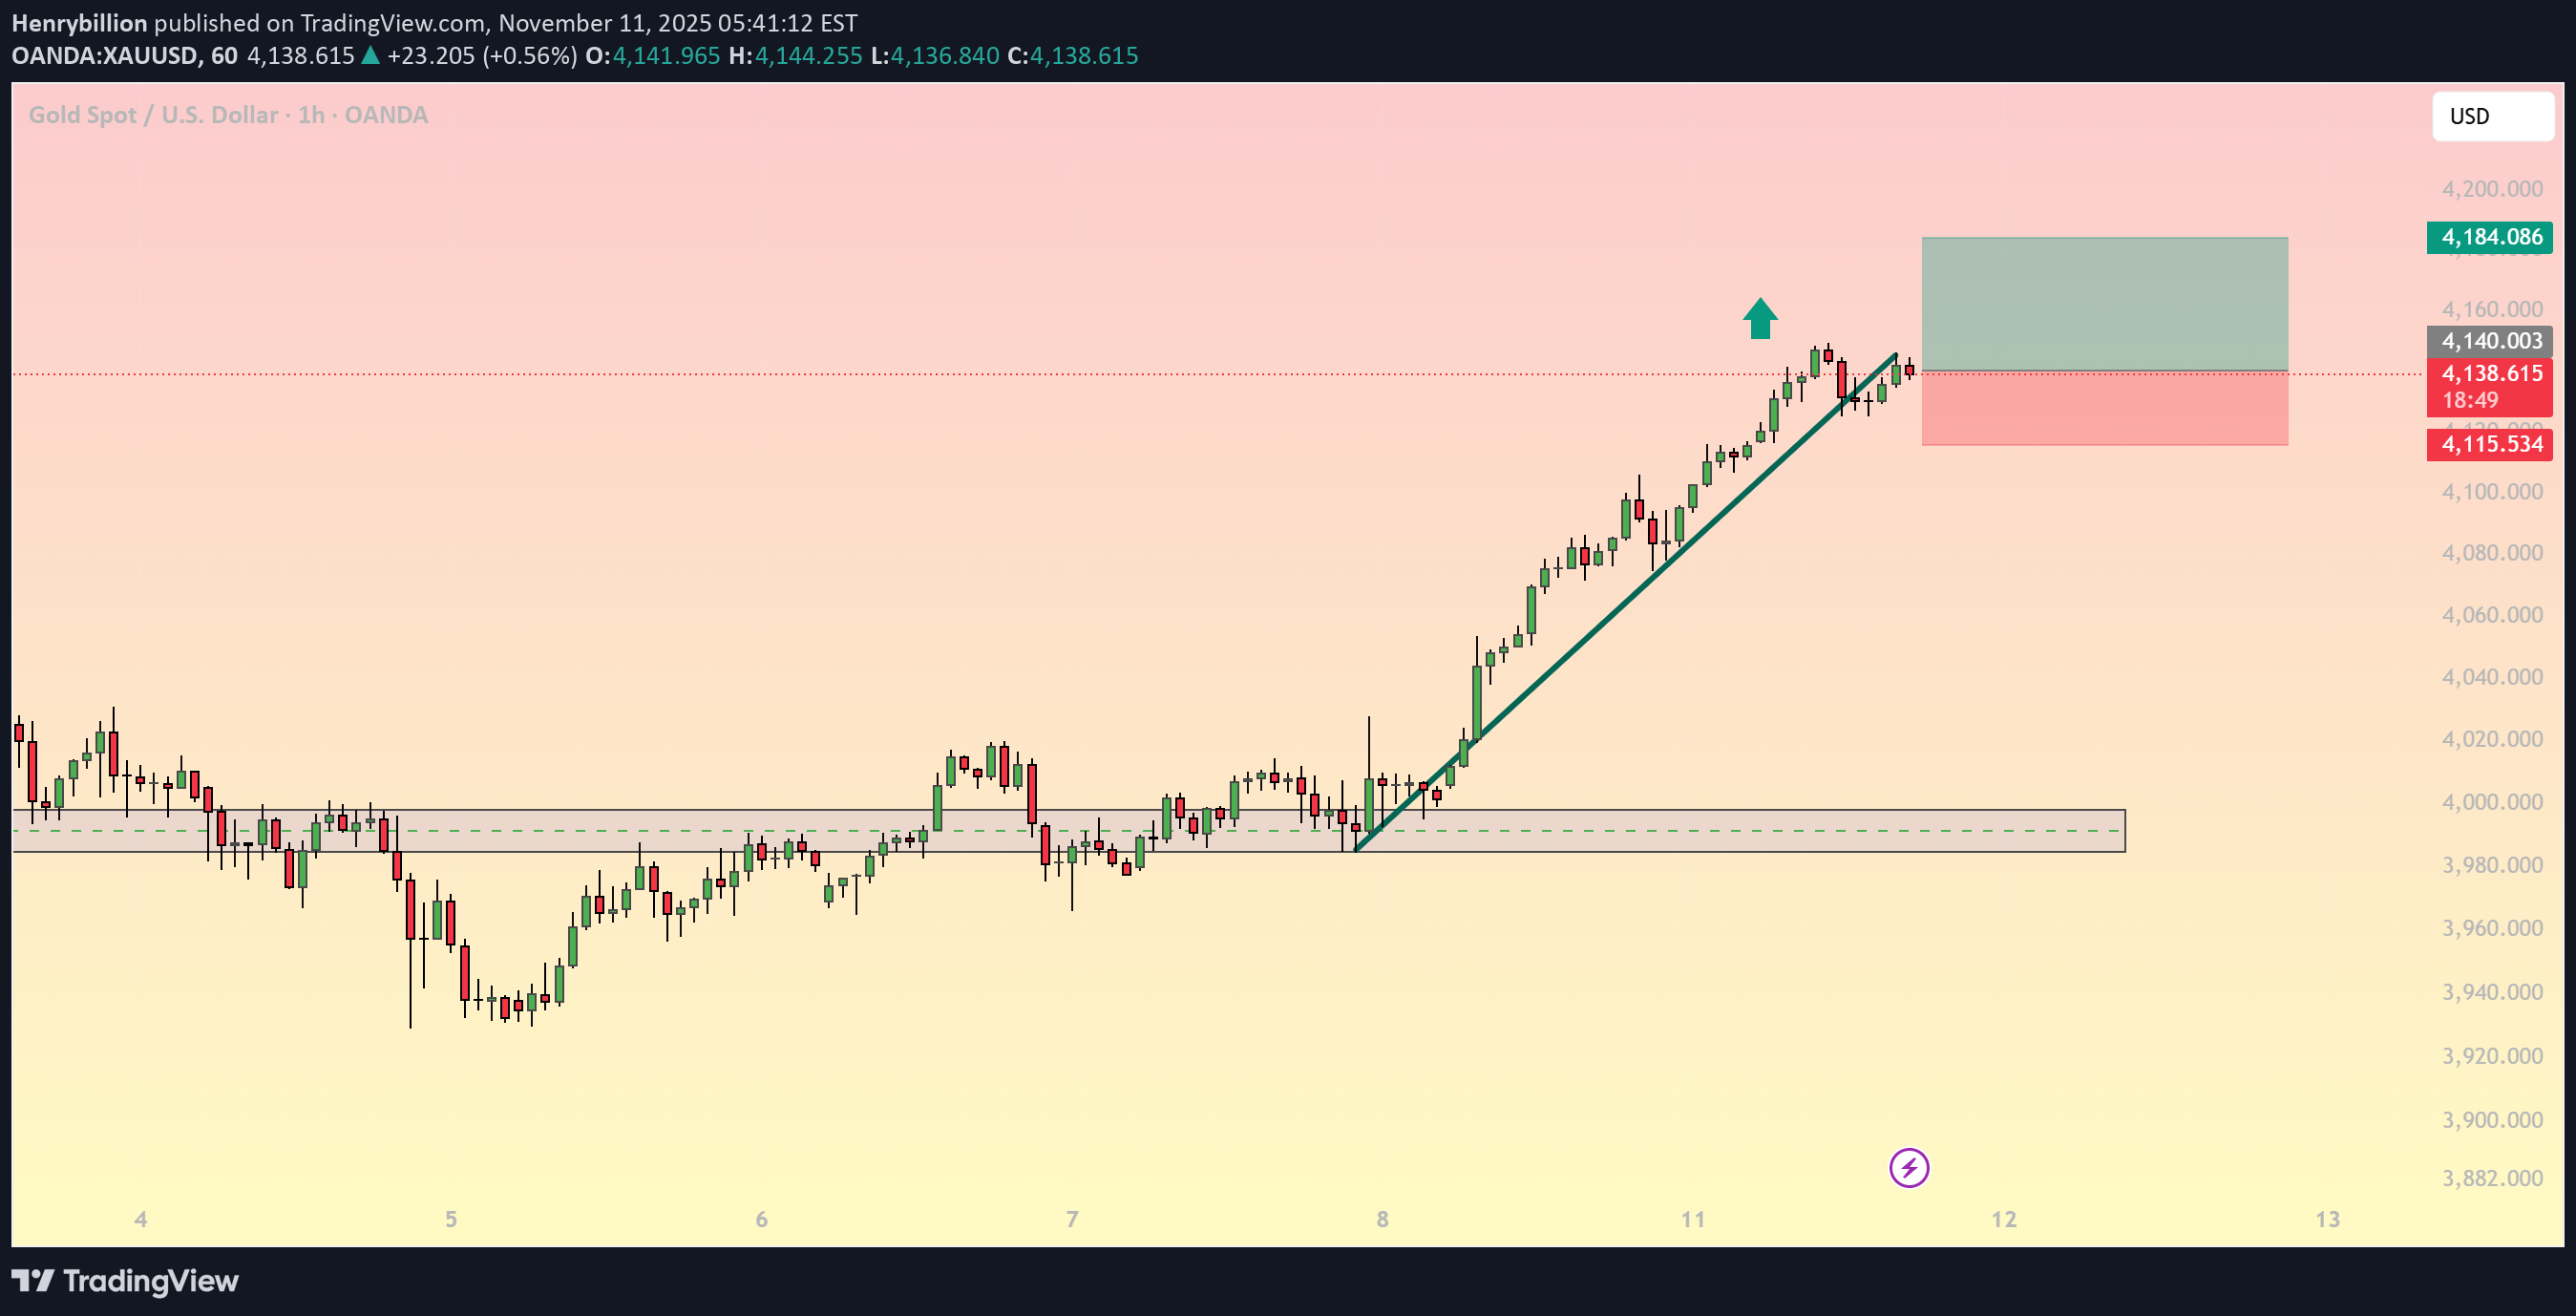
Gold (XAU/USD) – Bullish Momentum Continues Above Key Support Zone Gold remains in a strong uptrend structure on the H1 timeframe, forming higher highs and higher lows after breaking through the previous consolidation range near the 4,000–4,020 area. The price has respected the ascending trendline and recently formed a minor retracement before showing signs of bullish continuation. The zone around 4,115–4,120 serves as the nearest support, aligned with the trendline and the last higher low. As long as the price holds above this level, the bullish structure remains intact. The next resistance area is projected near 4,180–4,185, where traders should watch for potential profit-taking or reversal signals. Trading Strategy: Buy Entry: Around 4,135–4,140 (on retest of trendline support) Stop Loss: Below 4,115 Take Profit: 4,180–4,185 Risk–Reward Ratio: ~1:2 Technical Confluence: ✔ EMA cluster trending upward confirming momentum ✔ RSI remains above the midline (bullish bias) ✔ Fibonacci 38.2% retracement aligns with the retest area If price closes below 4,115, the short-term bias may shift toward 4,080 or deeper retracement. However, as long as the trendline holds, buyers maintain control. Stay patient and wait for confirmation near the support zone before entering. Follow for more daily gold strategies and price-action updates.
Henrybillion
طلا (XAU/USD): تحلیل تکنیکال روزانه - فرصتهای خرید و مقاومت حیاتی امروز!
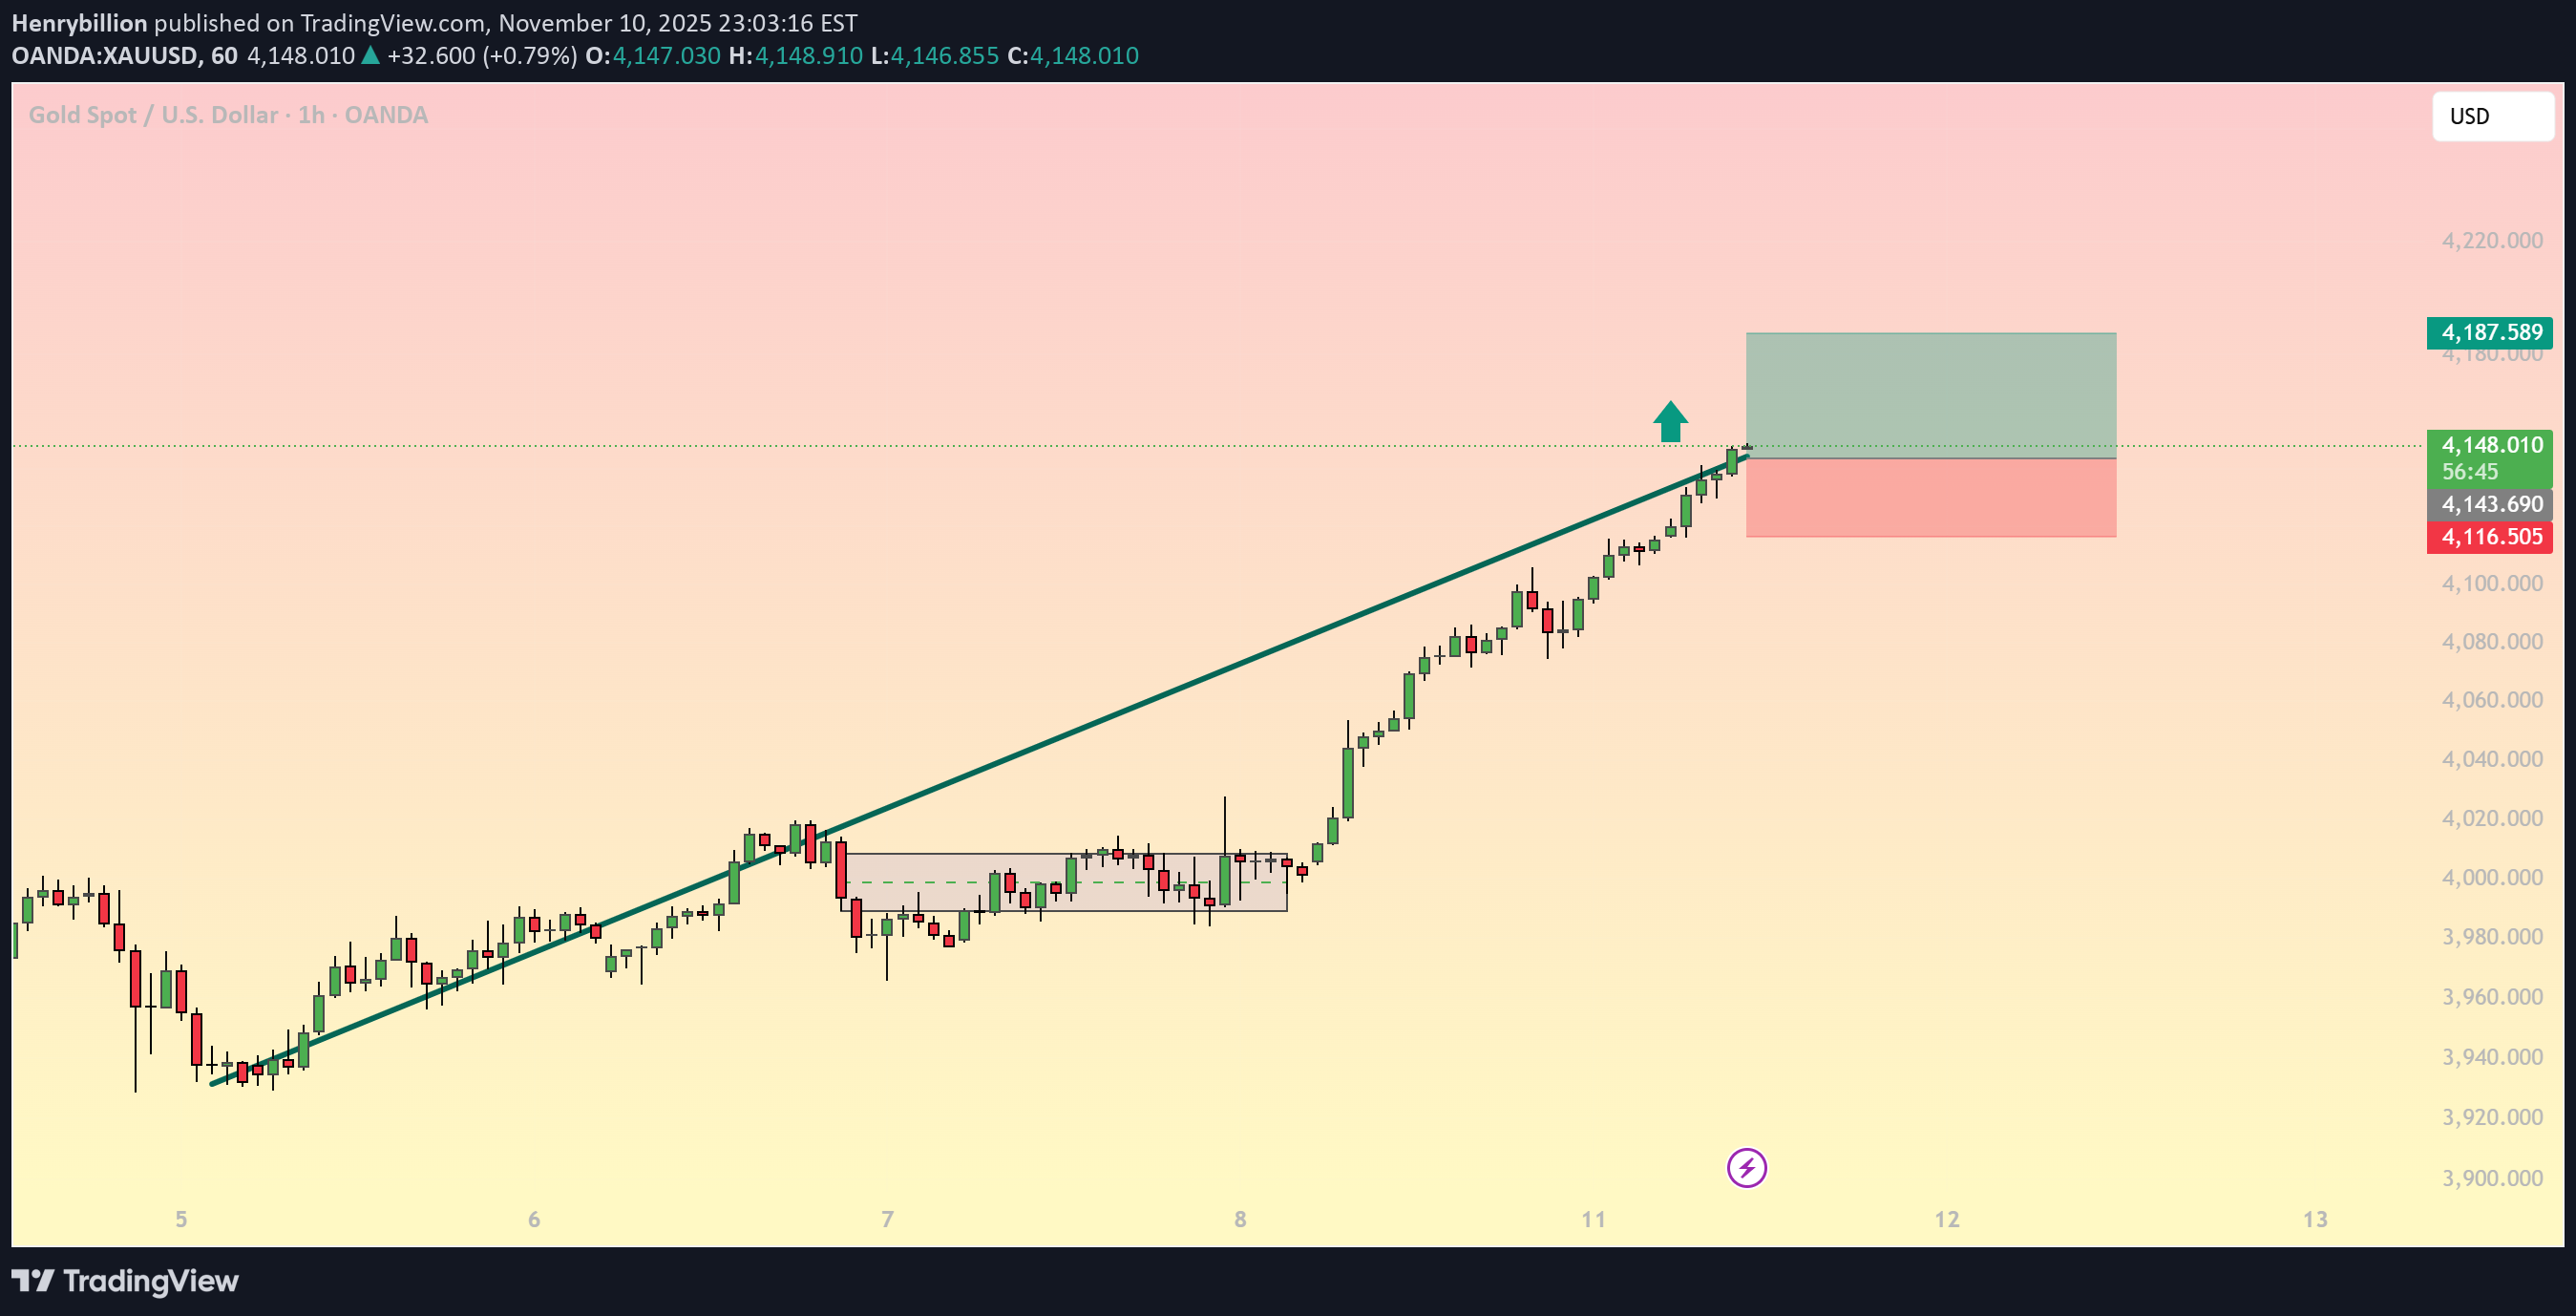
Gold continues its strong bullish momentum, extending from the previous breakout structure on the H1 timeframe. The market has respected the ascending trendline, forming higher highs and higher lows, confirming short-term buyer dominance. Currently, price is testing the resistance zone around 4147 – 4187, which aligns with a Fibonacci extension level and a potential exhaustion point from the recent impulse wave. Traders should pay close attention to price action signals within this area for possible reactions. Key Technical Levels: Resistance: 4187 – 4200 (Fib 1.618 & psychological zone) Support: 4116 – 4130 (trendline + previous consolidation zone) Trading Plan: Scenario 1 (Bullish Continuation): If price sustains above 4147 with strong volume and bullish momentum, the next target will be 4187, followed by 4210. Scenario 2 (Correction Setup): A rejection from 4187 could trigger a short-term pullback toward 4116, providing potential buy-the-dip opportunities along the trendline support. Indicators Insight: EMA Cluster (50–100): Still sloping upward, confirming bullish bias. RSI: Near overbought region, signaling caution for late buyers. Fibonacci 0.618 retracement: Lies near 4115, aligning with our first support zone. Gold remains in an uptrend, but with price nearing key resistance, traders should manage risk carefully and wait for confirmation before entering. Stay alert for volatility during the U.S. session and remember: reaction matters more than prediction. Follow for more daily gold trading strategies and updates.
Disclaimer
Any content and materials included in Sahmeto's website and official communication channels are a compilation of personal opinions and analyses and are not binding. They do not constitute any recommendation for buying, selling, entering or exiting the stock market and cryptocurrency market. Also, all news and analyses included in the website and channels are merely republished information from official and unofficial domestic and foreign sources, and it is obvious that users of the said content are responsible for following up and ensuring the authenticity and accuracy of the materials. Therefore, while disclaiming responsibility, it is declared that the responsibility for any decision-making, action, and potential profit and loss in the capital market and cryptocurrency market lies with the trader.