Technical analysis by Henrybillion about Symbol PAXG on 7/25/2025

Henrybillion
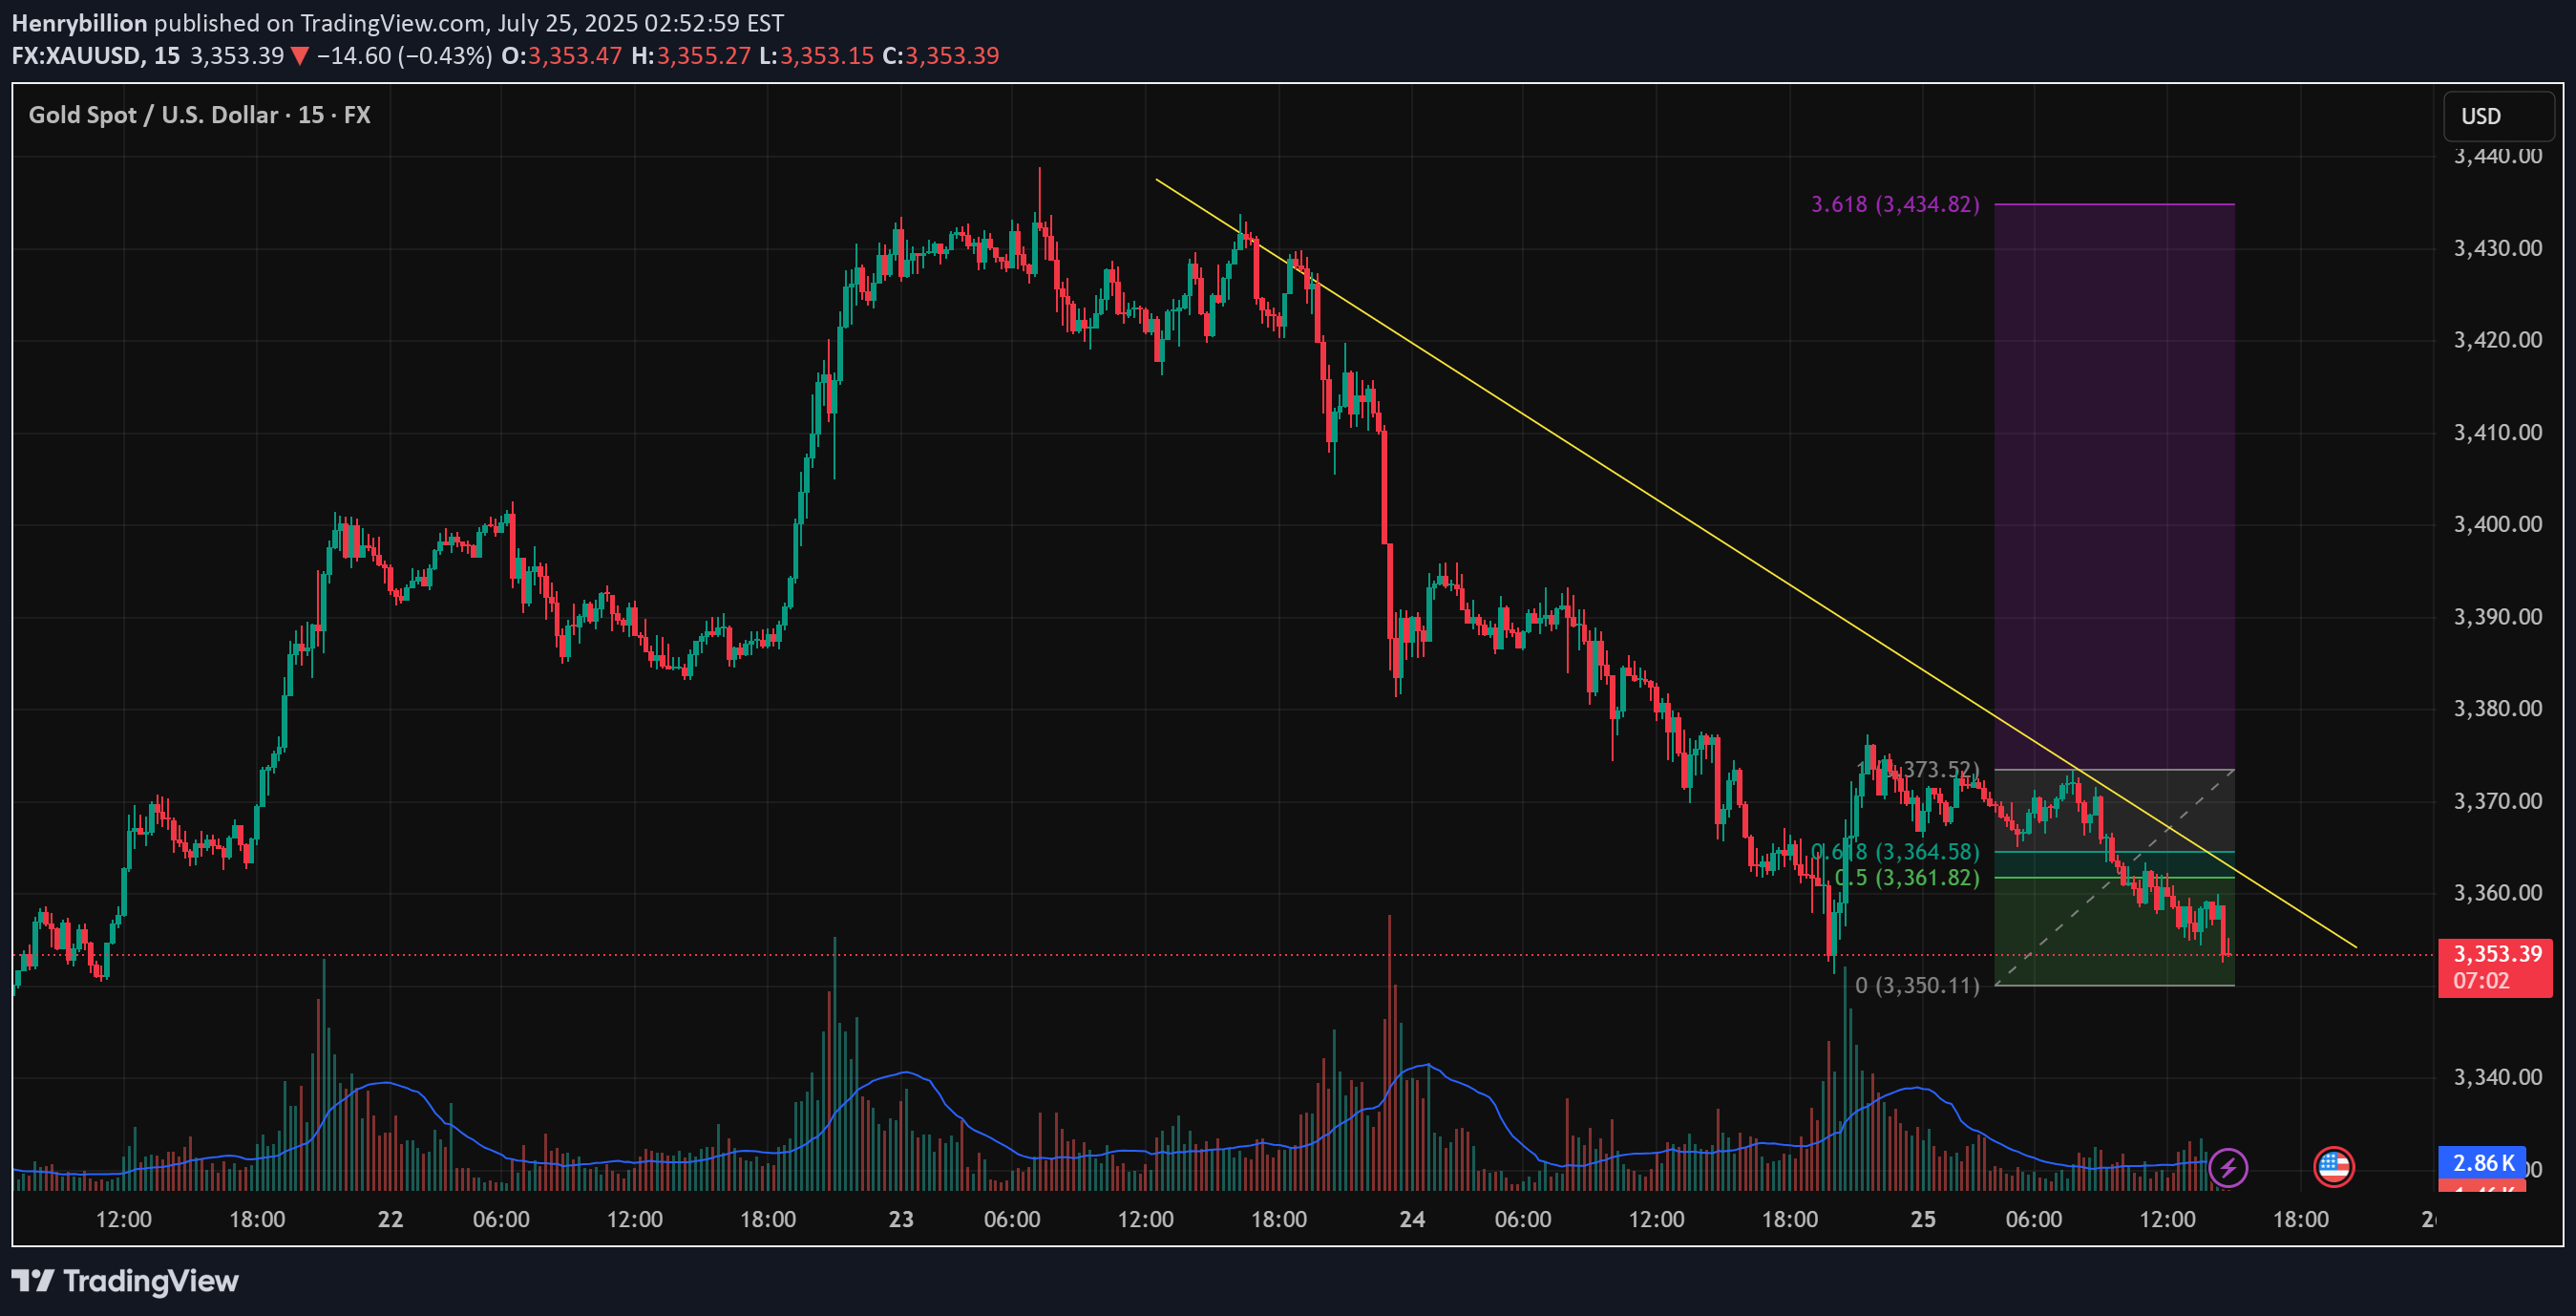
On the 15-minute chart (M15), XAUUSD is showing early signs of recovery after a sharp decline that found support around the key 3,350 USD level. This area has been tested multiple times with increasing volume, suggesting potential buyer accumulation. Technical Analysis: Downtrend Line: A descending trendline (yellow) from the July 23 high has acted as dynamic resistance. Price is now approaching this line again. Fibonacci Retracement: The recent rebound from 3,350.11 to 3,373.52 shows key resistance zones at the 0.5 (3,361.82) and 0.618 (3,364.58) Fibonacci levels. Volume Spike: Notable volume surges at the bottom suggest increased buyer interest near support. Key Price Levels for Today: Technical ZoneRole 3,350 – 3,353 Strong short-term support 3,361 – 3,365 Fibonacci 0.5–0.618 resistance 3,373.5 Previous swing high 3,400 – 3,434 Fibonacci 3.618 extension target Trading Strategies: Scenario 1: Bullish Breakout Above Trendline Entry: Buy stop above 3,366 with increasing volume. TP1: 3,373.5 TP2: 3,400 TP3: 3,434 (Fibonacci 3.618 extension) SL: 3,348 (below recent low) Scenario 2: Trendline Rejection – Bearish Continuation Entry: Sell limit at 3,364–3,366 if bearish pin bar / engulfing pattern appears TP1: 3,350 TP2: 3,338 SL: 3,375 Additional Confirmation Signals: Closely watch price action near the trendline and Fibonacci zone (3,361–3,364). RSI is not yet oversold, so a short-term technical rebound remains possible. Conclusion: Gold is currently testing a significant support zone around 3,350 USD. If price successfully breaks above the descending trendline and holds, we may see a bullish impulse targeting as high as 3,434 USD. However, failure at this resistance may trigger another leg down.Save this strategy if you find it useful, and stay tuned for more daily insights!
