Technical analysis by Henrybillion about Symbol PAXG on 7/24/2025

Henrybillion
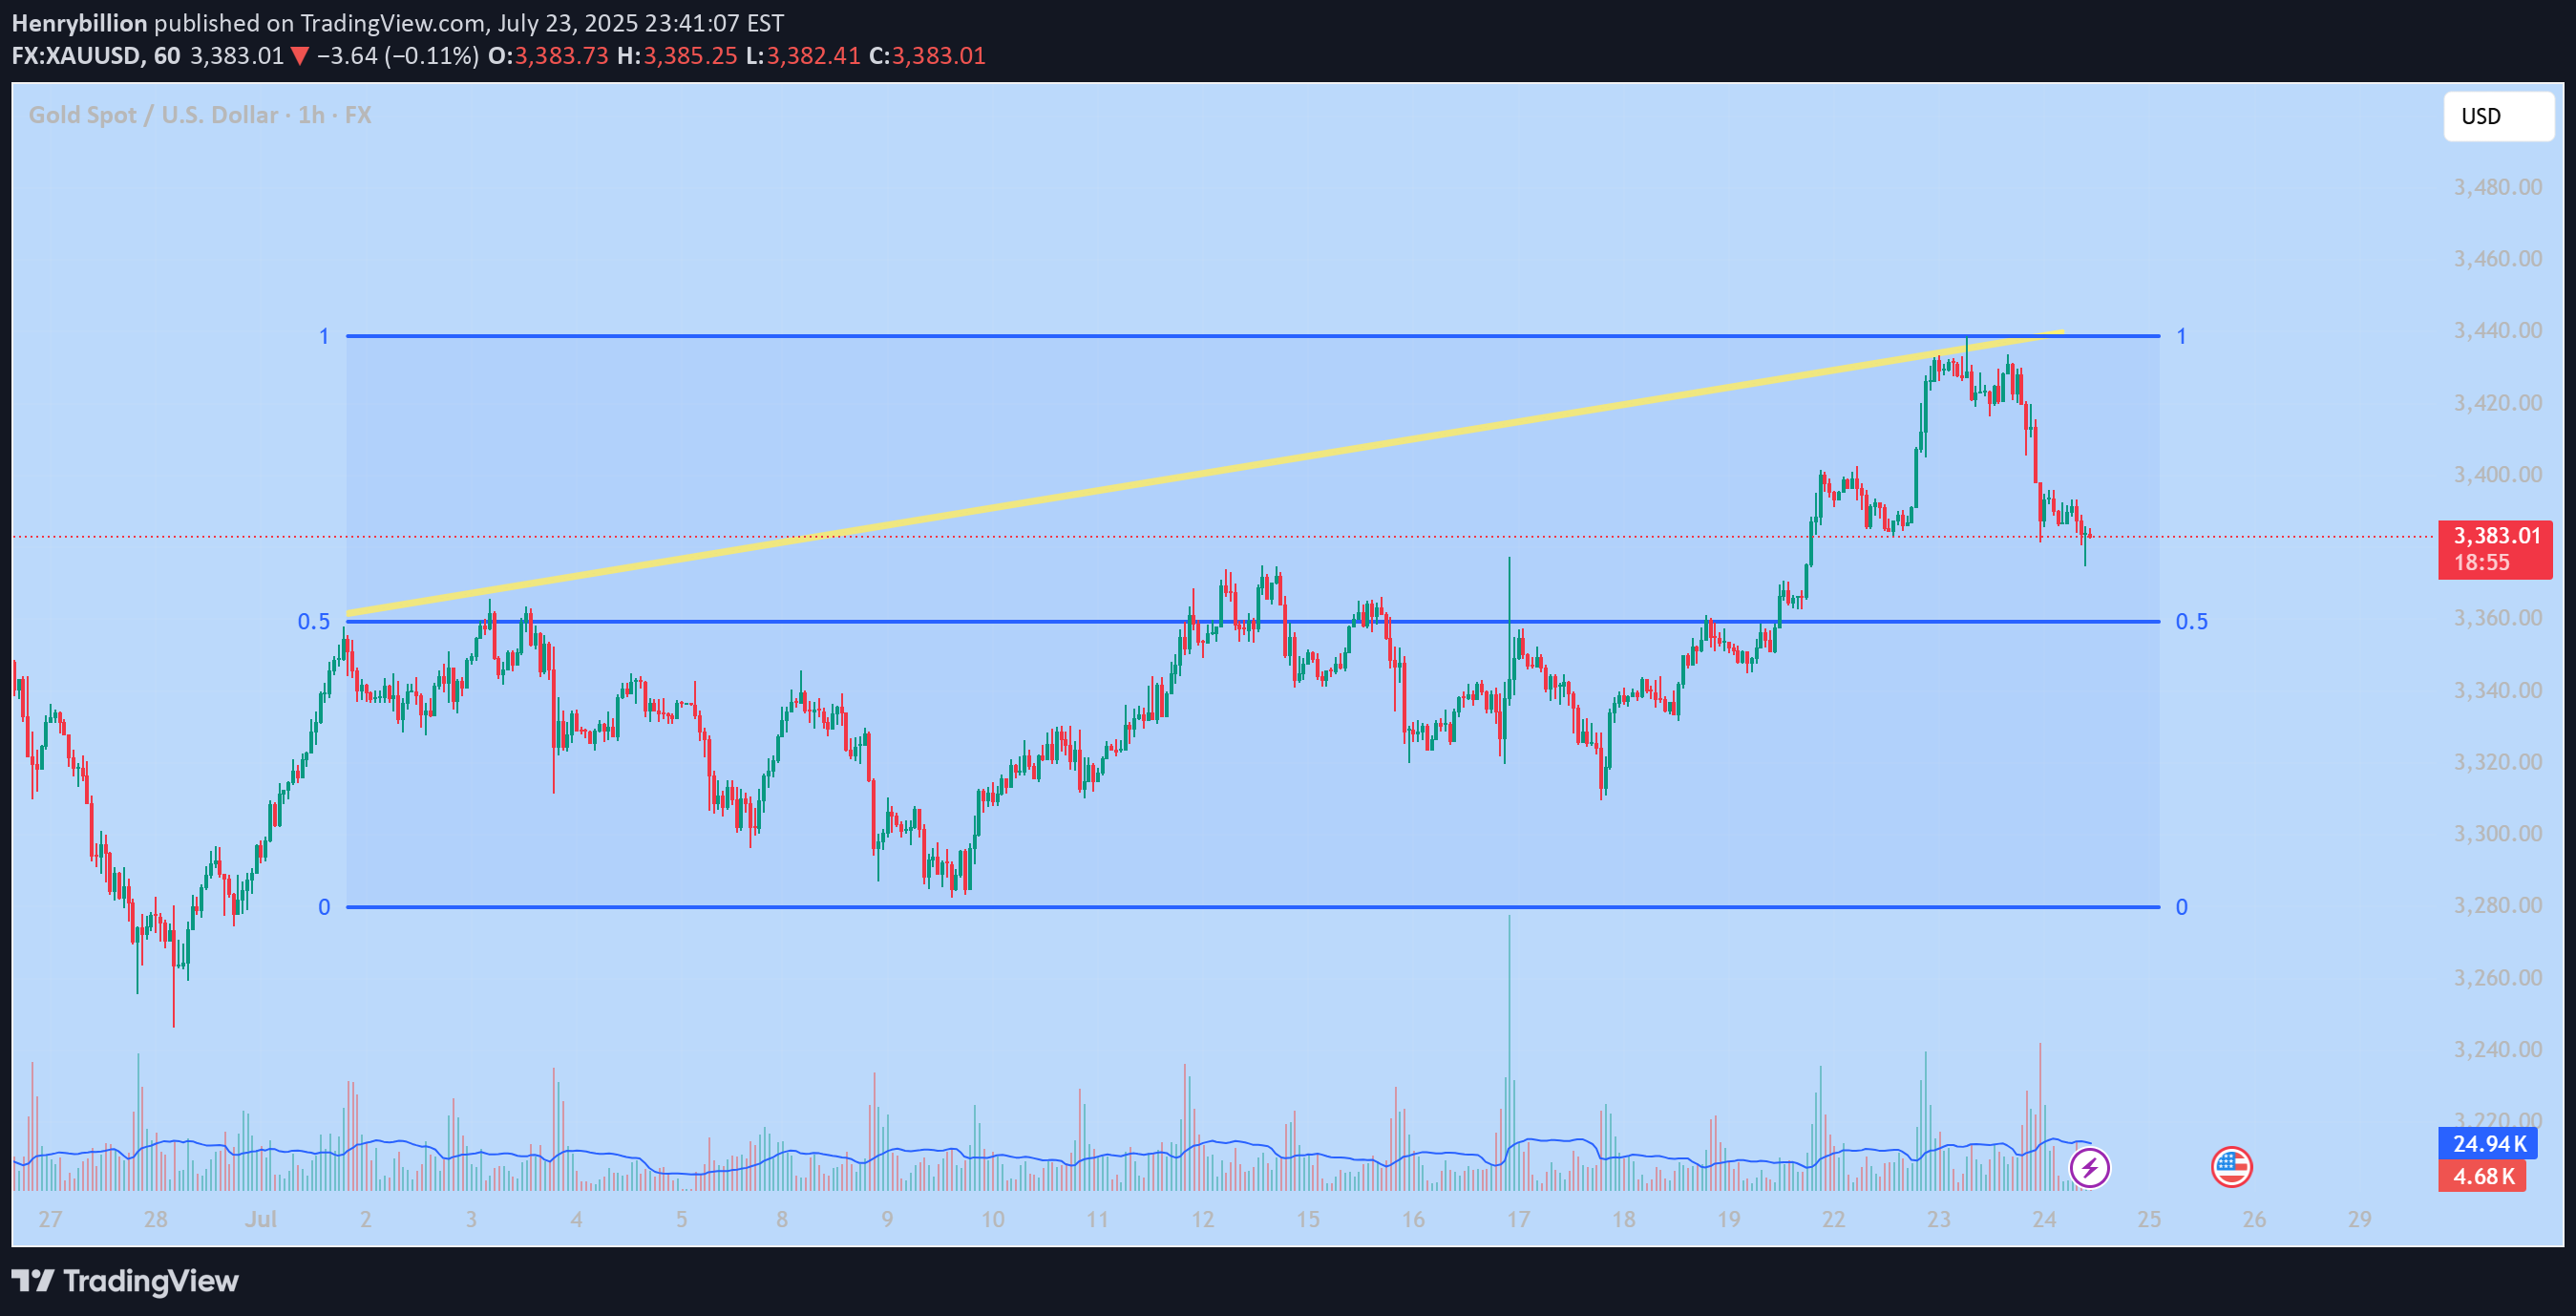
1. Fibonacci Levels The chart uses a Fibonacci range from 0 to 1, likely drawn from a significant low to a recent high. The 0.5 Fibonacci level (around $3,360) is acting as a major support zone and price is currently testing this level. 2. Short-term Trend Price broke above the previous high and formed a new high near $3,440, but then reversed sharply. Now it’s pulling back toward a key support zone between $3,360 – $3,380. 3. Volume Analysis Volume spiked at the top near $3,440, suggesting strong selling pressure or profit-taking. Volume slightly increases again as price reaches support → possible buying interest at the current level. 4. Trendline (Yellow Line) The ascending yellow trendline has been broken to the downside, signaling a break in short-term bullish momentum. Possible Scenarios Scenario 1 – Bullish Rebound from Support: If price holds above the $3,360 zone and forms bullish candles, we could see a recovery toward $3,400–$3,420. That area can act as a short-term profit-taking zone. Scenario 2 – Bearish Breakdown Below 0.5 Level: If price breaks below the $3,360 support with strong bearish candles, it may drop further toward the Fibonacci 0 level (~$3,280). Conclusion Gold is at a critical decision point. Holding the $3,360 support could lead to a bullish bounce. Breaking it would likely confirm a short-term downtrend. Monitor the next few candles closely for confirmation. Would you like a trade plan or entry/exit suggestion based on this chart?
