Technical analysis by Henrybillion about Symbol PAXG on 7/21/2025

Henrybillion
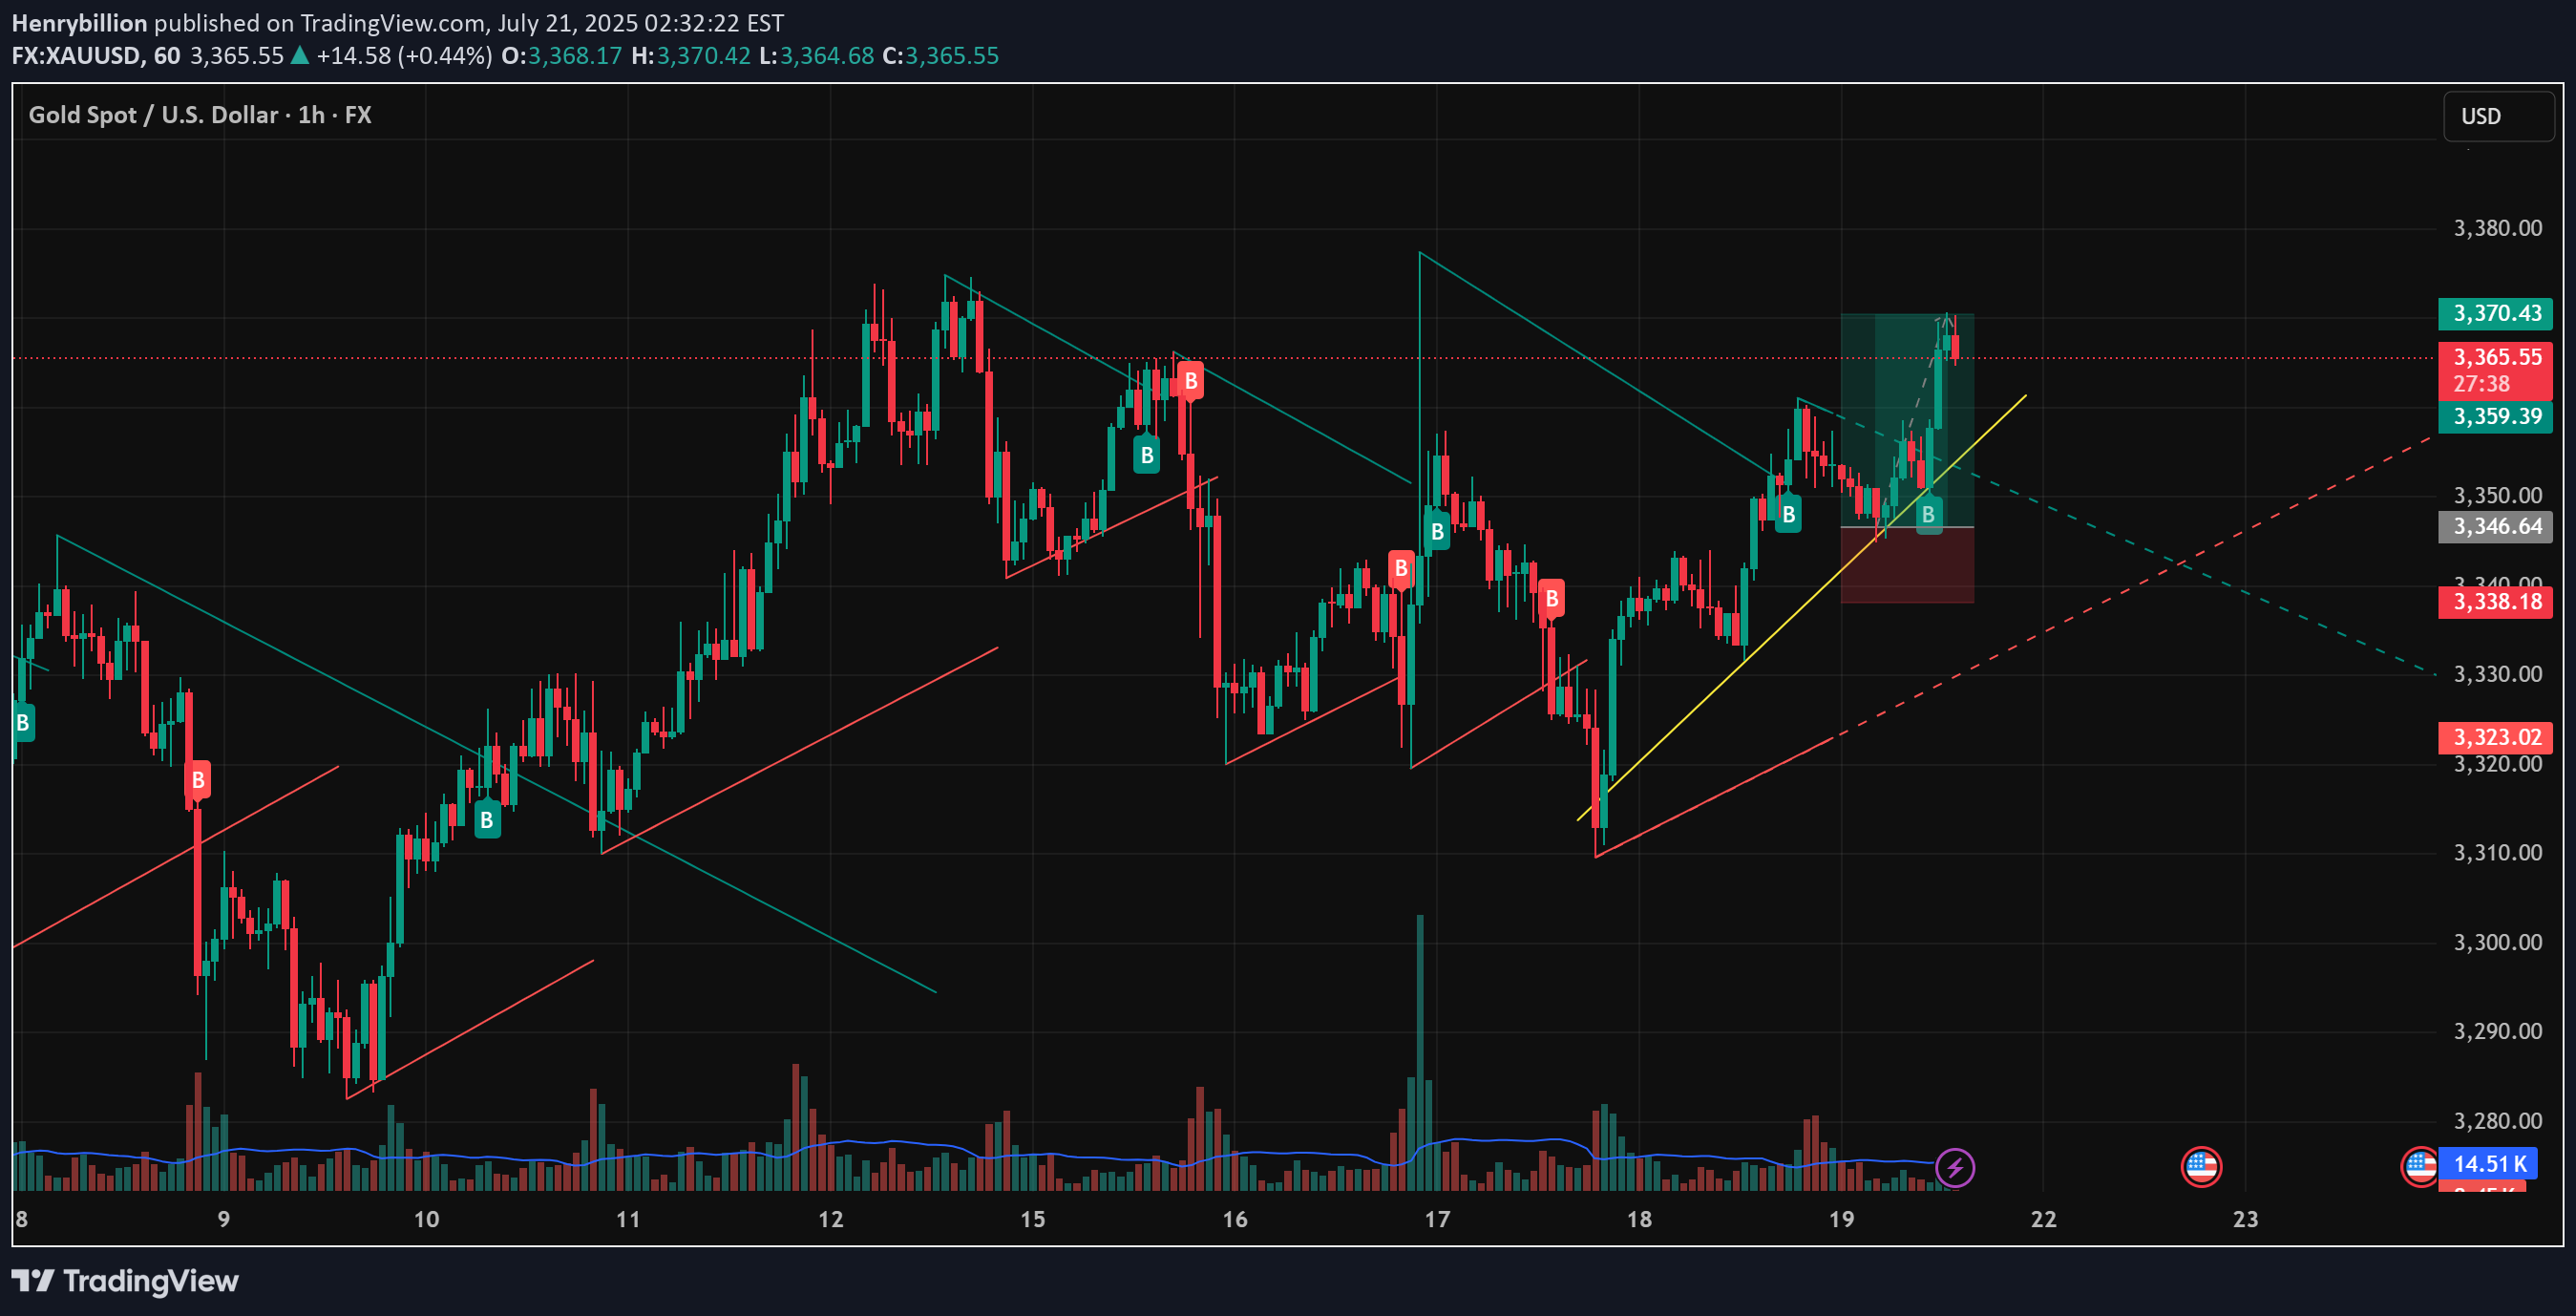
In today’s session (July 21), the 1H chart of XAUUSD shows a confirmed breakout above the medium-term descending trendline. The bullish momentum originated from a strong rebound at the confluence zone of support, EMA, and ascending trendline — suggesting a high-probability continuation setup for the short term. Technical Analysis Overview: 🔹 Price Action Structure: Price broke out of a falling wedge / descending triangle with a strong bullish Marubozu candle, confirming the breakout move. Breakout was supported by increased volume, indicating strong institutional buying near 3,346–3,350. 🔹 Trendlines and EMA Outlook: Price is currently holding above the ascending yellow trendline. Short-term EMAs (e.g., EMA20/50, not shown) are likely sloping upwards and sitting below price, confirming bullish market structure. 🔹 Key Support and Resistance Levels: Immediate Resistance: 3,370 USD – recently tested previous swing high. Major Resistance: 3,378 – 3,385 USD – Fibonacci projection and previous supply zone. Short-term Support: 3,359 USD – minor pullback zone and EMA alignment. Major Support: 3,346 USD – the breakout retest zone and price structure support. Suggested Trading Strategies: Scenario 1: Buy the Dip Entry: Near 3,359 – 3,346 USD (on minor retracement) Stop Loss: Below 3,338 USD (to invalidate the breakout zone) Target 1: 3,370 USD Target 2: 3,378 – 3,385 USD Scenario 2: Breakout Continuation Buy If price breaks above 3,370 with strong candle + volume: Entry: Around 3,372 – 3,374 USD Stop Loss: 3,359 USD Target: 3,385 – 3,392 USD Additional Indicators to Watch: RSI (not shown): If approaching 70+, watch for bearish divergence or exhaustion signals. Volume: Sustained or increasing volume will confirm strength of the uptrend. Conclusion: XAUUSD is showing strong bullish technical signals after breaking the descending trendline and successfully retesting the breakout level. As long as price holds above 3,346 – 3,350, the short-term bullish structure remains intact. - Follow for more high-quality trading strategies and daily gold analysis. Save this idea if you find it useful for your trading setup! What’s your view on this analysis? Let’s discuss more in the comments below!
