Technical analysis by Henrybillion about Symbol PAXG on 7/22/2025

Henrybillion
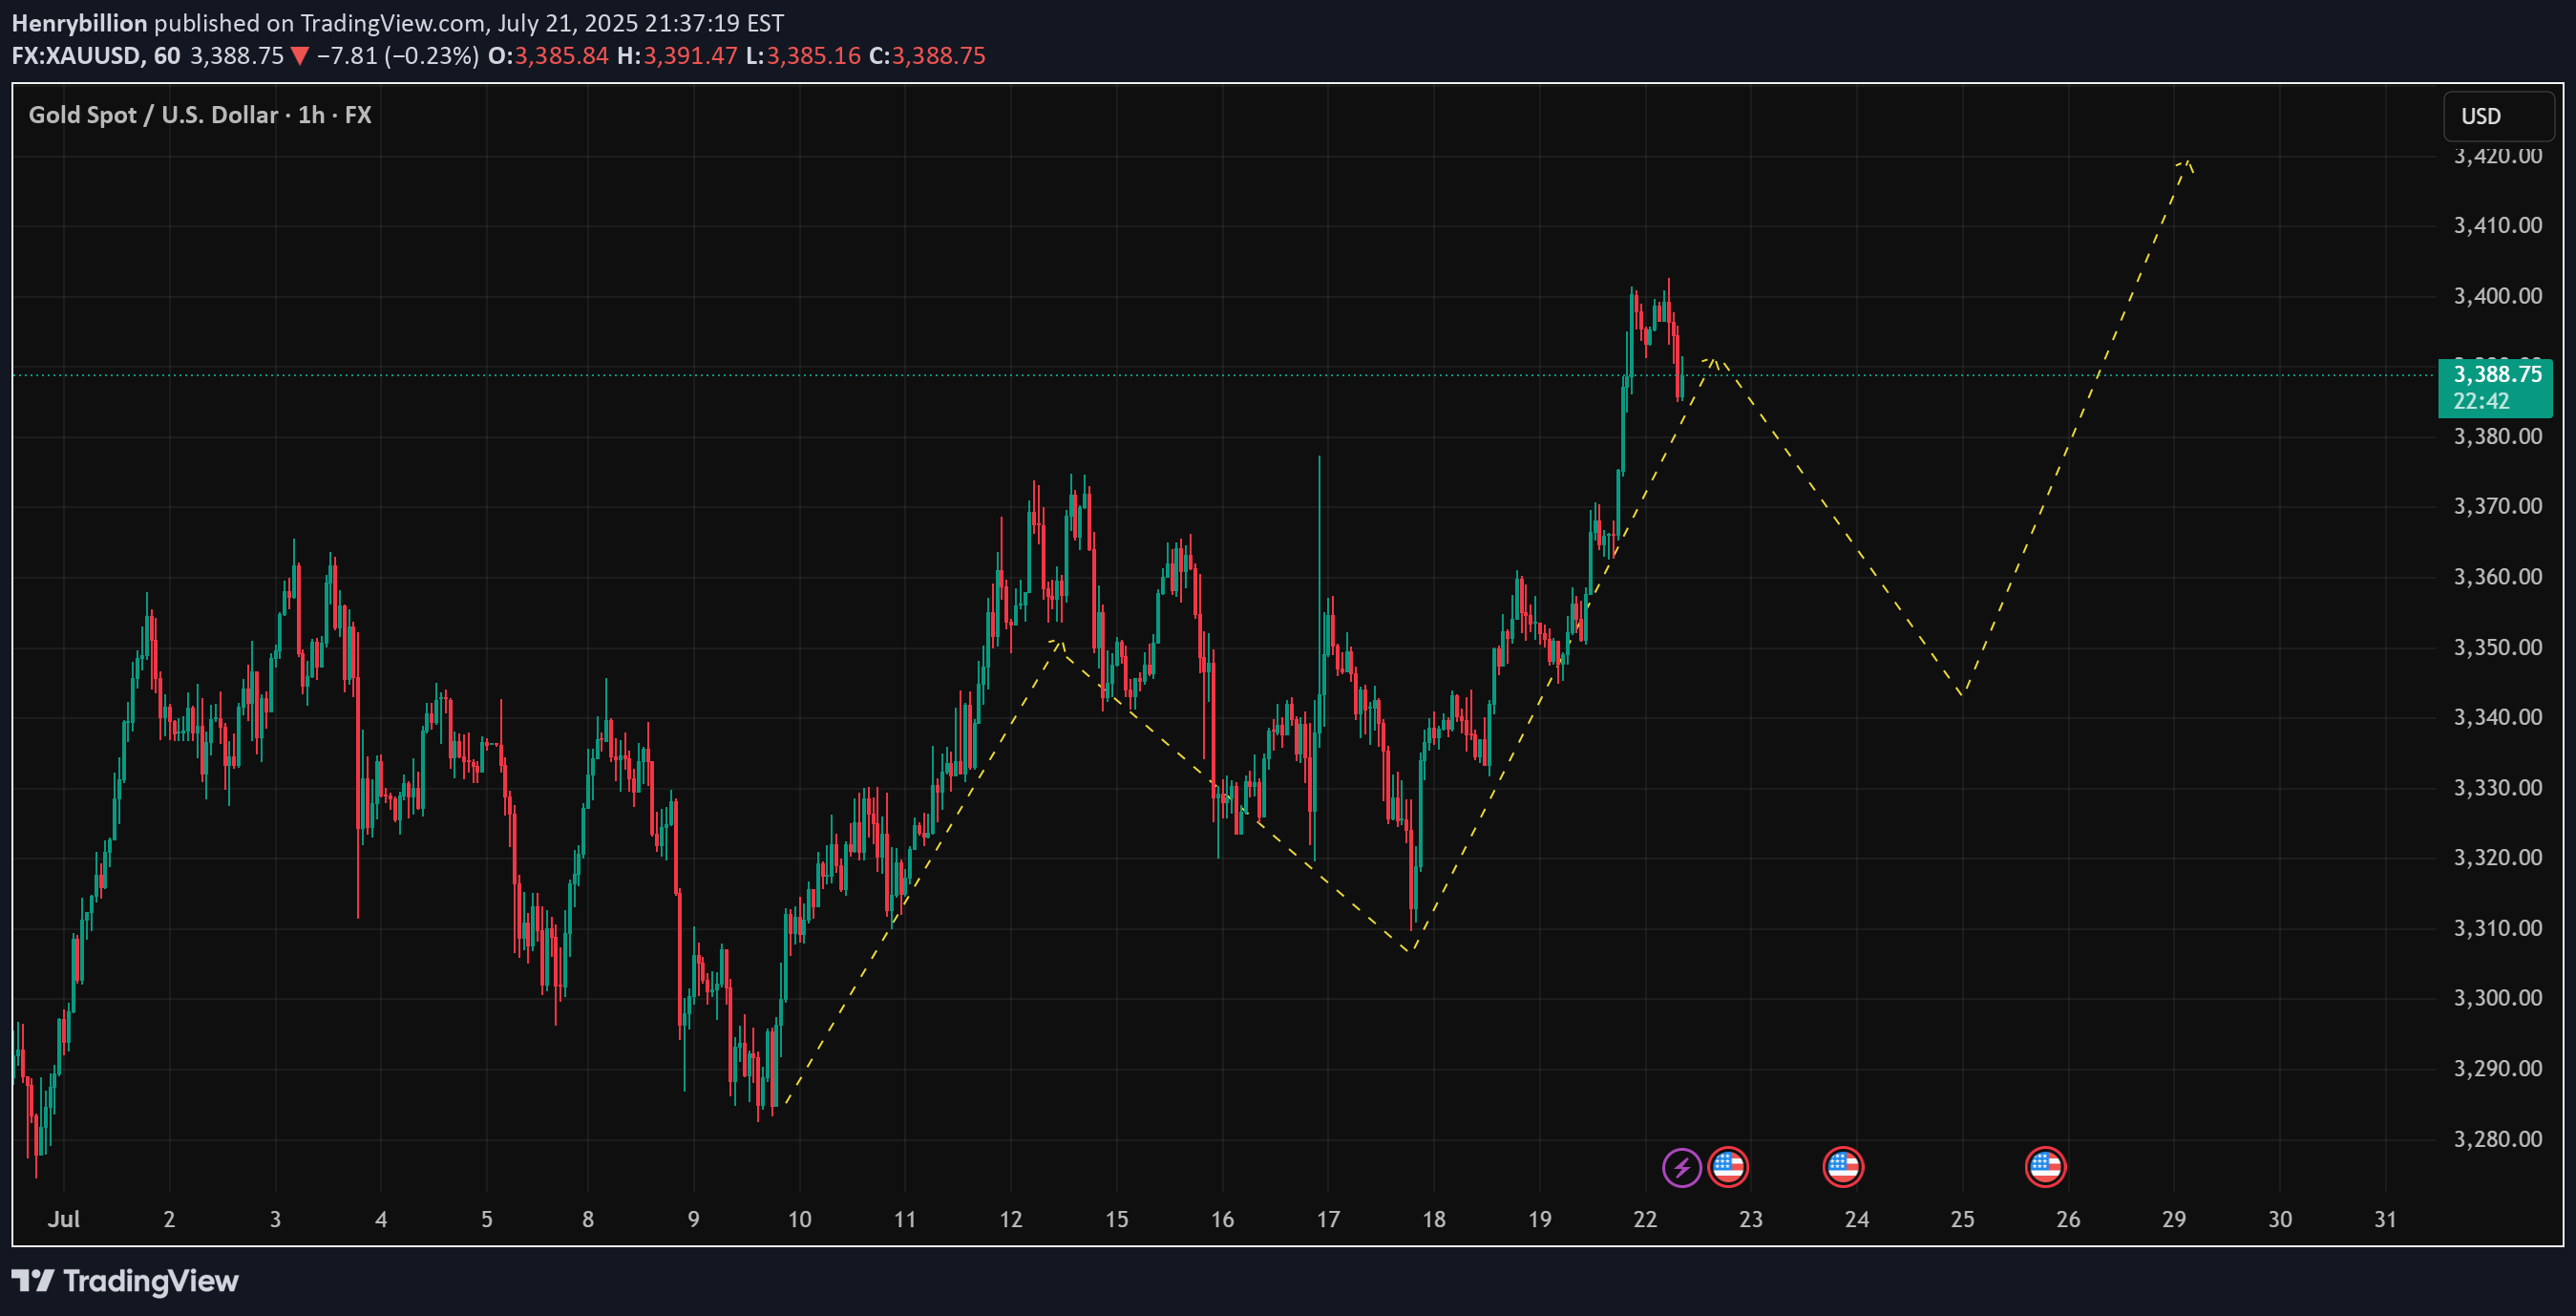
Technical Outlook – 22/07/2025 On the 1-hour chart, XAUUSD is maintaining a clear bullish market structure with a sequence of higher highs and higher lows. The projected price path drawn on the chart suggests a potential retracement before a continuation toward the 3,420 USD region. Let’s break down the key technical zones and strategies for today: Key Levels to Watch Immediate Resistance: 3,390 – 3,400 USD This is the recent high. A breakout above this area could trigger momentum toward the projected 3,420 USD extension. Support Zone: 3,345 – 3,350 USD This zone aligns with the potential pullback as illustrated on the chart, offering a high-probability buy-the-dip opportunity. It coincides with previous structure resistance now turned support. Trendline Support: The ascending yellow trendline has been respected multiple times and should act as dynamic support on any intraday retracements. Indicators & Tools Used EMA: Price is currently trading above the short-term EMA (not shown), suggesting intraday bullish bias remains intact. RSI (Recommended Use): Look for RSI near 40–50 on the pullback for confluence at support. Fibonacci Tool (suggested): If measuring from the swing low near 3,320 to the high of 3,390, the 0.618 Fib lies close to 3,345 – an ideal area to look for long entries. Suggested Trading Strategies 🔹 Buy the Dip Strategy: Wait for a corrective move into the 3,345–3,350 area. Confirm with bullish reversal candles or RSI support, then enter long targeting 3,400–3,420. Stop-loss ideally below 3,335 (structure break). 🔹 Breakout Continuation Strategy: If price breaks cleanly above 3,390 with volume, a momentum trade toward 3,410–3,420 is viable. Use tight trailing stops to protect gains. 🔹 Avoid chasing highs – Patience at support zones or confirmation above resistance will offer better reward/risk setups. Conclusion Gold is respecting bullish market behavior on the 1H chart, and while a short-term correction is expected, the broader trend favors upside continuation. The 3,345–3,350 area will be critical for today's trading decisions. Remember to follow for more updates and strategy insights. Save this post if you find it useful. If you’d like, I can also add a version using RSI or Fib levels directly plotted. Let me know.
