
HamadaMark
@t_HamadaMark

What symbols does the trader recommend buying?
Purchase History
پیام های تریدر
Filter
HamadaMark
پیشبینی شگفتانگیز قیمت ZEC تا 2025: آیا 1500 دلار در دسترس است؟
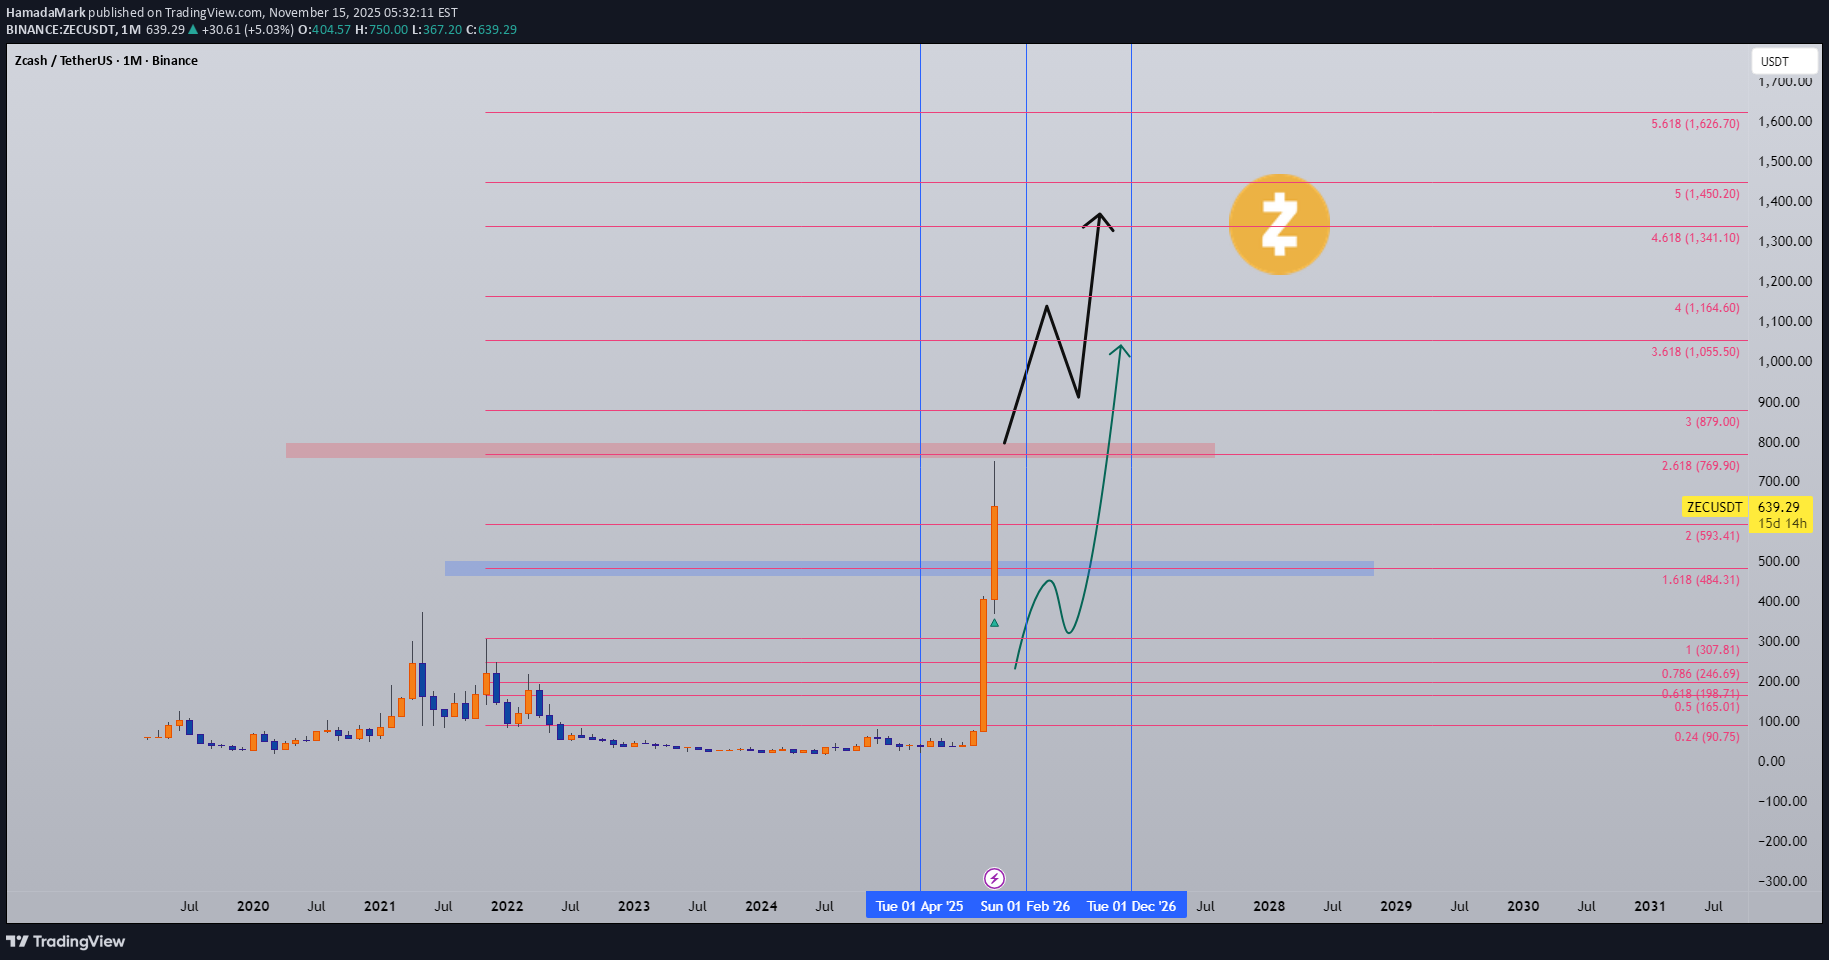
ZEC is a privacy coin, and before we jump into numbers, you should ask yourself: Why are privacy coins leading this cycle? If you haven’t asked this yet, then it’s time to dive deeper — because the narrative itself is part of the pump. 🔥 Main Question Will ZEC hold momentum and continue bullish, Or will $800 be the end of this wave? Short Answer: I see ZEC reaching $1,500 before or by Feb 2025. We already caught it in the $4XX range days ago after making this TA: 🧭 Technical Foundation This ZEC read is based on: Elliott Wave (EW) Gann Timing Fibonacci Map Harmonic structure confirmations ZEC is currently at a crossroads, and the next monthly close will decide its fate. 🔑 What ZEC Needs for $1,500 1. Weekly Hold for now to keep things up: $480 must hold weekly No monthly close below this range 2. Bullish Monthly Close: $560–$630 monthly close → excellent strength Confirms buyers defending the trend 3. Breakout Key: $800 → breakout Opens runway to $1,200 → $1,500 New ATH window Monthly close = the key factor for ZEC’s entire roadmap. 💼 Trade Plan (My Setup) My Buy Levels: $359.25 $419.13 $479.00 → now in profit Stop-Loss: $250 A monthly close below $ 230 invalidates the structure. Risk Allocation: 3–5% max investment Even with a 2× target, the risk remains controlled → You risk $1 to aim for $2+ Duration: 180+ days Confidence Level: Medium 📌 Quick Recap Key support: $480 weekly Monthly range to watch: $560–$630 Breakout: $800 → $1,200 → $1,500 ❌ Invalidation: Monthly below $260 🧩 Risk: 3–5% ⏱ Duration: 6 months+ ⚓ Renzo Tip “Privacy coins rise when the crowd starts whispering, smart captains listen before the storm arrives.” Do your own research, as always. Prayer May Allah protect our trades from hidden risks, guide us toward clarity, and give us wisdom to manage both fear and greed in every cycle.from $460 to $7XX to stop below key line and reject again to key buy zone after almost 1X since sharing! we ask Allah reconcile and repay ZEC have some FA i got recently which make you be wise with it and since then i booked profits and no big follow for it. The updates need to be in time i know but in same week i have some challenges outside trading and time is less for posting it.
HamadaMark
پیشبینی قیمت اتریوم تا ۲۰۲۸: رازهای گن و مسیر صعودی تا ۱۰,۰۰۰ دلار!
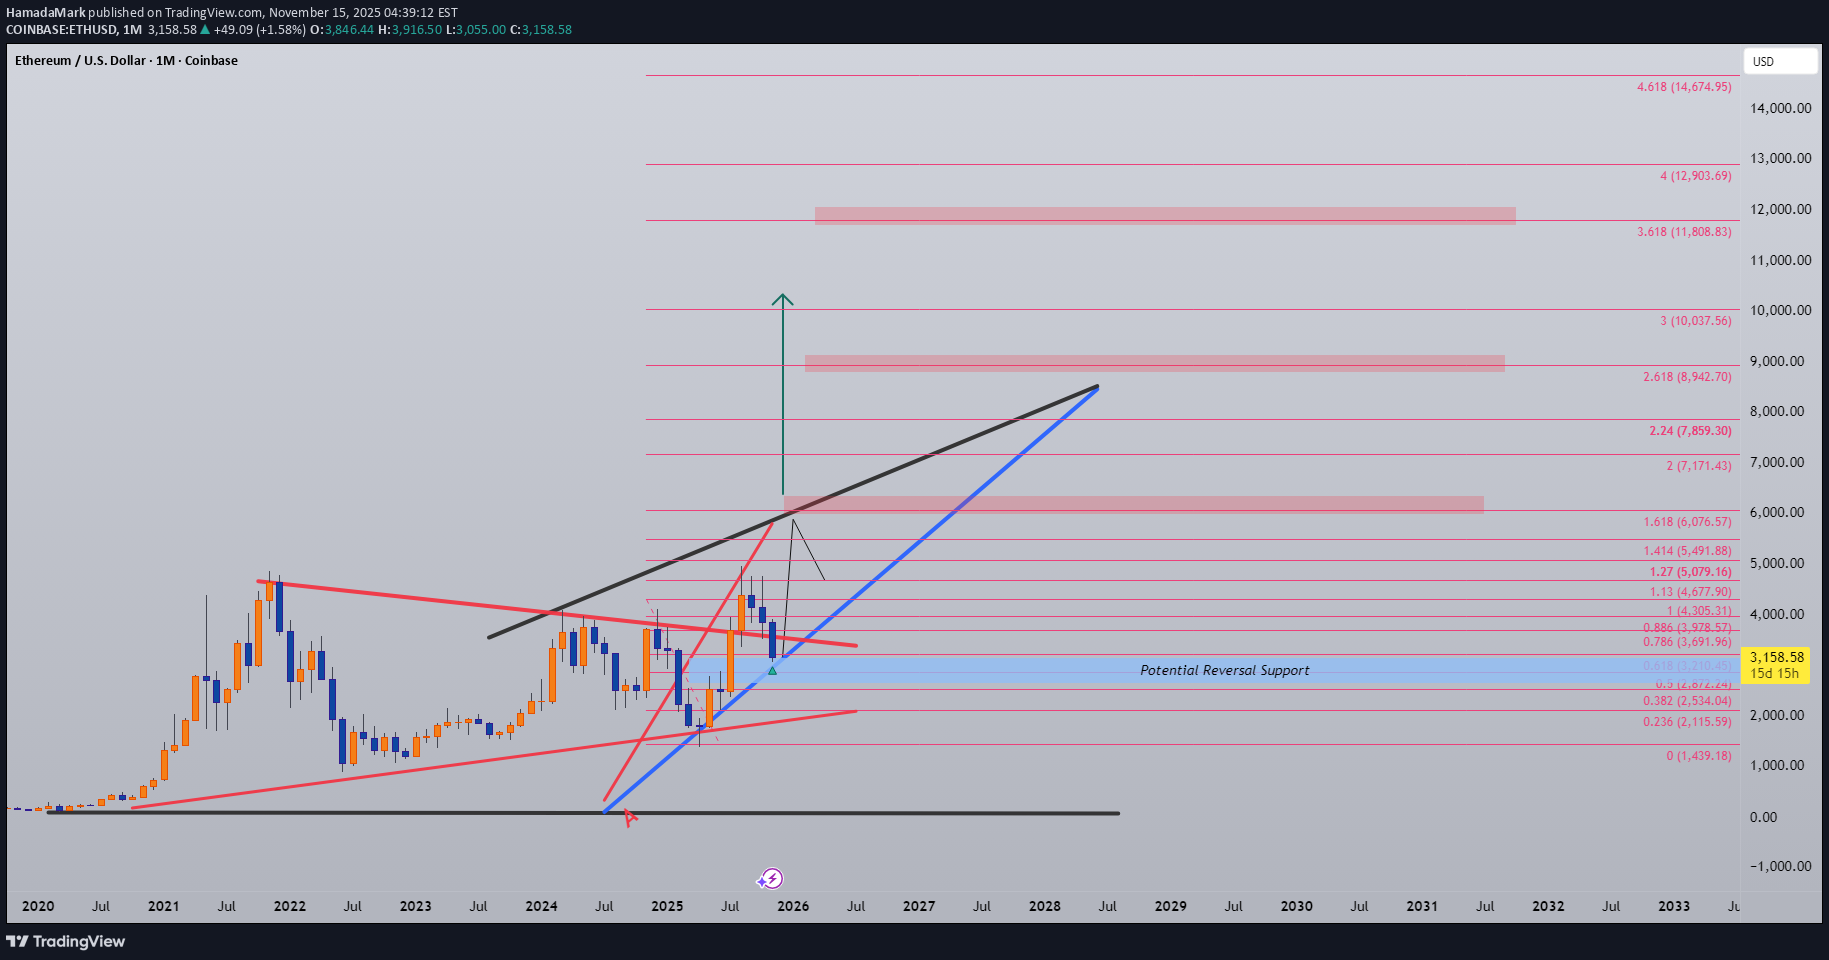
FIB/GANN/classic Method Analysis 🔹 Gann Key Timing According to Gann cycles, 25 November marks the start point of a new bullish attempt for ETH. The $2,500 level is the critical line if ETH closes a monthly candle below $2,500, it signals a significant change in the long-term roadmap. Trend Setup As long as ETH holds $2,500 and stays above the Blue Trend Line (A), The bullish roadmap remains valid. 🎯 Roadmap Targets Breakout Key: $5,100 → Main breakout confirmation Target 1: $5,900 – $6,700 → First bullish leg (until Feb 2025) Target 2: $8,200 – $8,900 → Full bullish year if 2026 confirms Target 3: $10,150 → Extended top projection (2027–2028) 📌 All levels remain valid as long as ETH holds $2,500 on the monthly close. 💰 Trade Plan We have active entries: from $3, XXX, with remaining buy levels between $1,500–$1,850–$2,150. Set up invalidation: Monthly close below $2,500. Max investment: 15 % of wallet. Risk-Reward (R: R): ≈ 1: 2 or higher. Example: If you hold 10 ETH, you risk about $10K vs. the potential upside of $35–70K. ⚖️ Summary Support to hold: $2,500 Breakout confirmation: $5,100 Main targets: $5,900 → $6,700 → $8,900 → $10,150 Cycle: 2025 → 2028 Exposure: 15 % max Always trade with a clear plan and controlled risk. ⚓ Renzo Tip “The chart tells its truth to the patient — not the loudest trader, but the calm observer of time.” 🤲 Prayer May Allah guide us to trade with clarity, protect our effort from greed and confusion, and reward our discipline with lasting growth and wisdom.
HamadaMark
آینده ارز ZEN: راز پنهان 9 دلاری و مسیر صعودی تا 73 دلار در سال 2025!
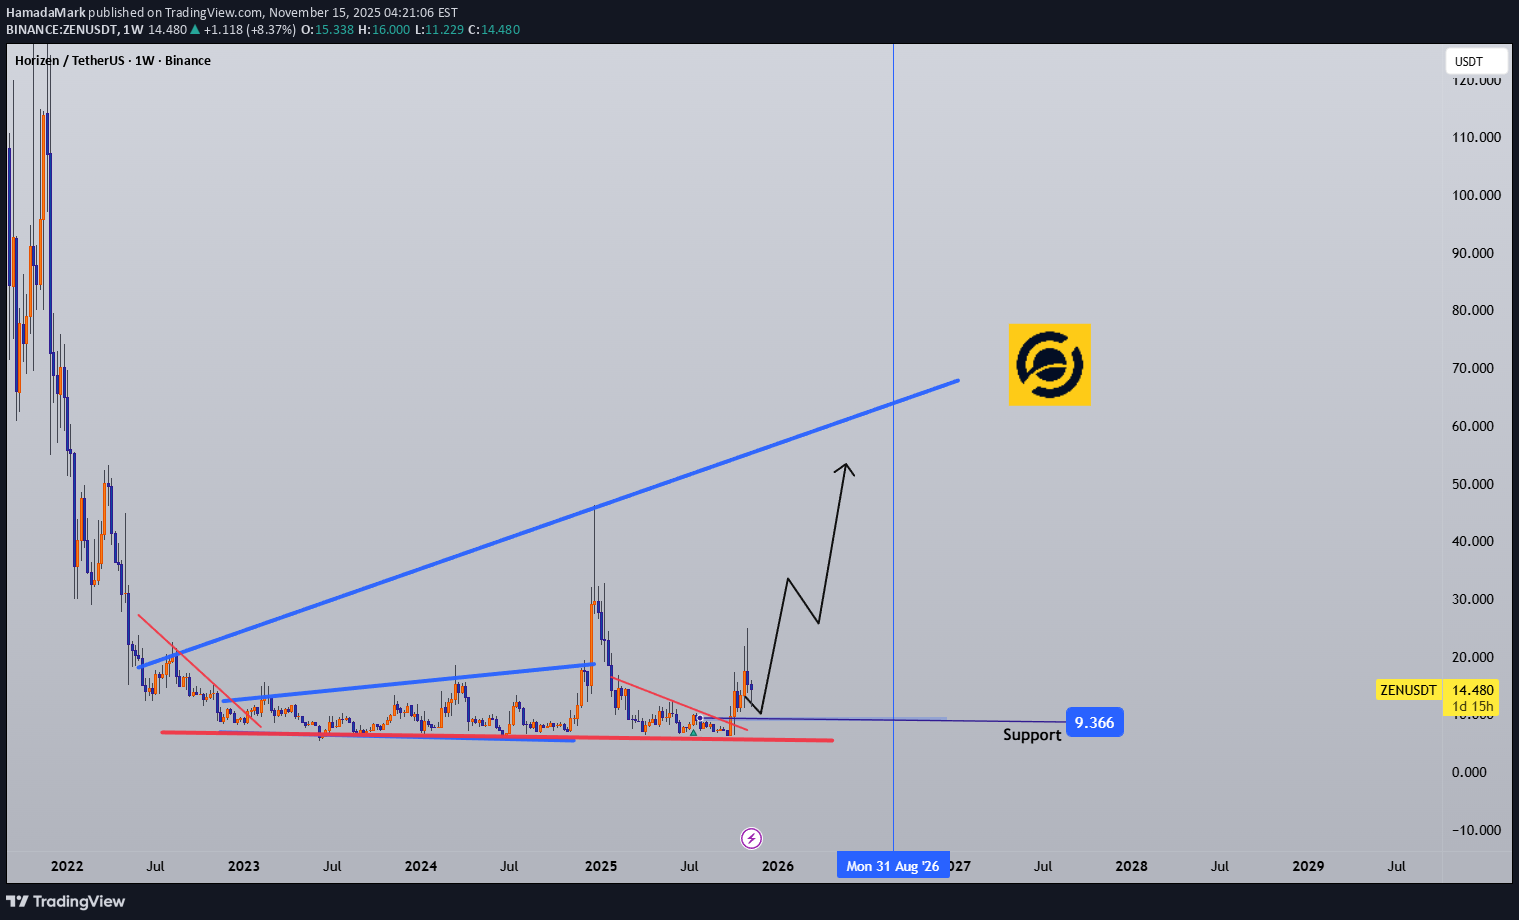
ZEN moved from $ 6 to $ 24 after 243 days since the last touch in 2024. The main question now: Will ZEN outperform this cycle or fall back into another deep coma? 🧭 Trend Structure Based on the combined reading of FIB and Gann: ZEN must hold 9 dollars, whatever happens. This line is the spine of the trend. If ZEN can close at the end of November around 19 to 21 dollars, Then the chart unlocks the next potential wave toward: 40 to 73 dollars This is a 3x to 5x range. 💰 Trade History and Plan We traded ZEN at many levels, from 7.5 to 24 dollars. The last setup was: Entry Targets 11.05 dollars (66.7 percent) 13.00 dollars (33.3 percent) Max investment 2% only for this cycle play Always do your own research Duration 90-180 days or more Confidence Medium 🔍 Quick Recap • Key support to hold: 9 dollars • November close target: 19 to 21 • Breakout potential: 40 to 73 • Allocation: two percent • Setup invalidation: losing the 9 zone with weekly and monthly closes • Timeframe: medium to long (three to six months) ⚓ Renzo Tip “A quiet coin is like a quiet sea. It looks dead until one wave reminds everyone that depth always hides power.” 🤲 Prayer May Allah bring clarity to our decisions, protect us from rushing, and bless our patience with results that reflect discipline, not luck.
HamadaMark
پیشبینی انفجاری ZEN تا ۲۰۲۶: راز نگهداشتن قیمت ۹ دلار چیست؟
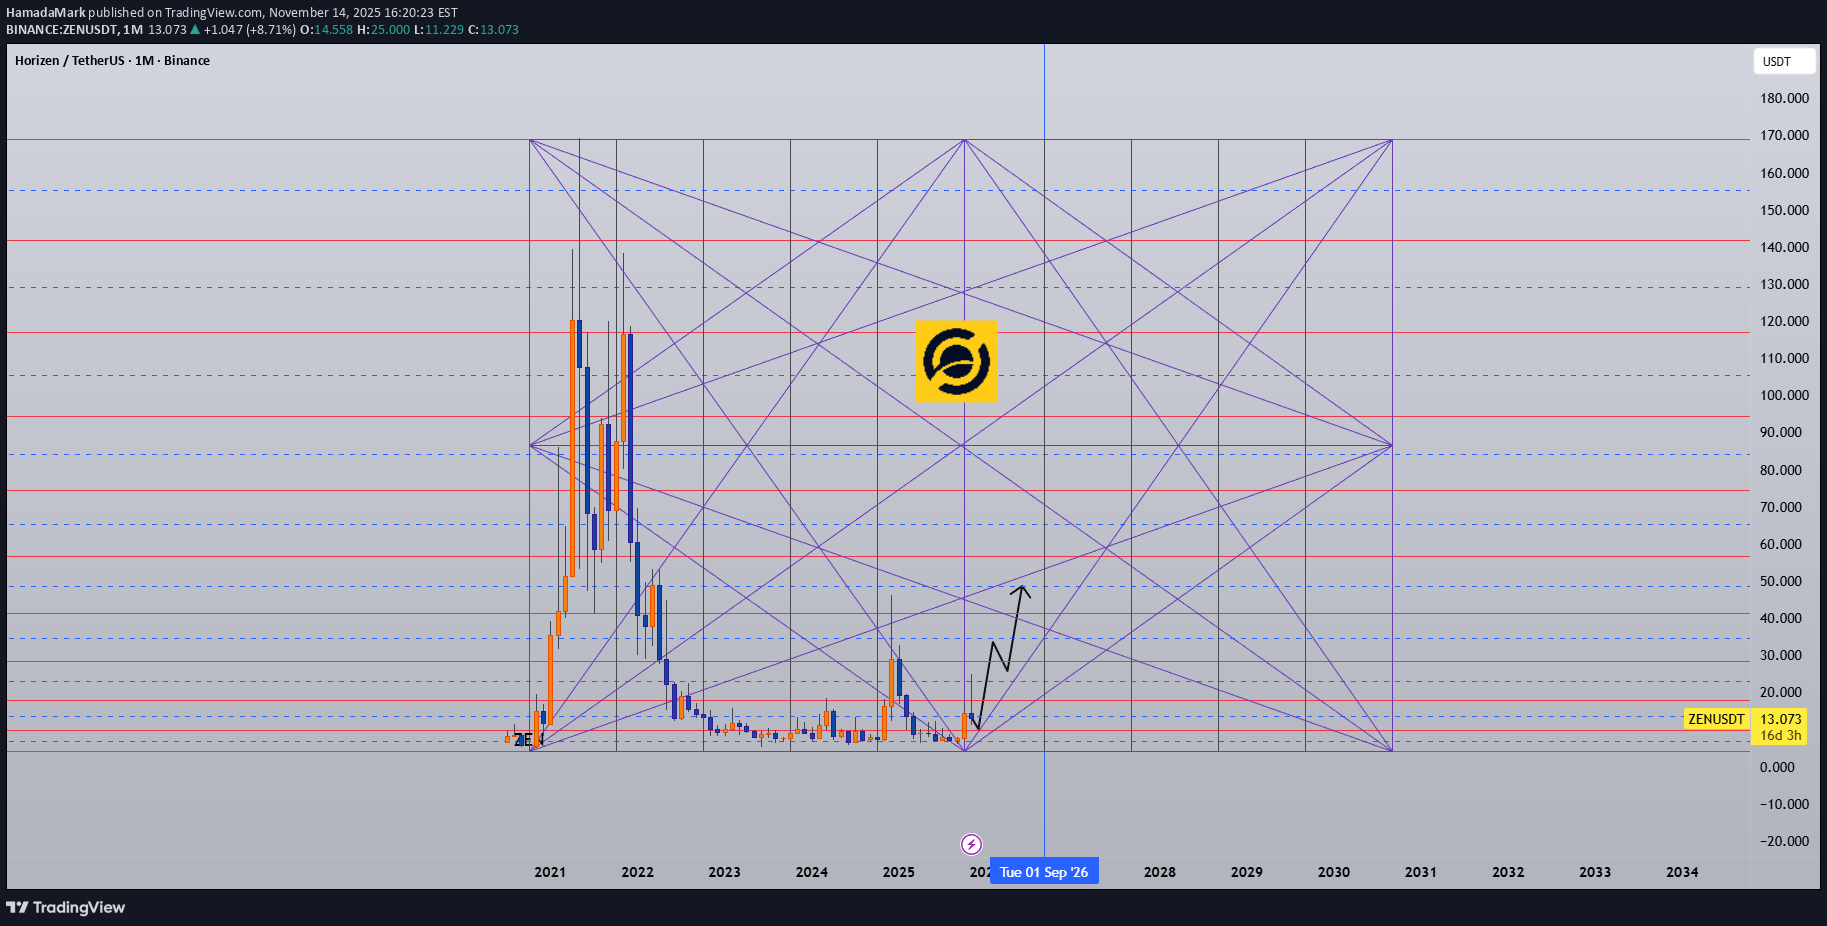
ZEN moved from $ 6 to $ 24 after 243 days since the last touch in 2024. The main question now: Will ZEN outperform this cycle or fall back into another deep coma? 🧭 Trend Structure Based on the combined reading of FIB and Gann: ZEN must hold 9 dollars, whatever happens. This line is the spine of the trend. If ZEN can close at the end of November around 19 to 21 dollars, Then the chart unlocks the next potential wave toward: 40 to 73 dollars This is a 3x to 5x range. 💰 Trade History and Plan We traded ZEN at many levels, from 7.5 to 24 dollars. The last setup was: Entry Targets 11.05 dollars (66.7 percent) 13.00 dollars (33.3 percent) Max investment 2% only for this cycle play Always do your own research Duration 90-180 days or more Confidence Medium 🔍 Quick Recap • Key support to hold: 9 dollars • November close target: 19 to 21 • Breakout potential: 40 to 73 • Allocation: two percent • Setup invalidation: losing the 9 zone with weekly and monthly closes • Timeframe: medium to long (three to six months) ⚓ Renzo Tip “A quiet coin is like a quiet sea. It looks dead until one wave reminds everyone that depth always hides power.” 🤲 Prayer May Allah bring clarity to our decisions, protect us from rushing, and bless our patience with results that reflect discipline, not luck.
HamadaMark
پیشبینی شگفتانگیز اتریوم ۲۰۲۵ تا ۲۰۲۸: رازهای چرخههای گن و مسیر صعودی تا ۱۰۰۰۰ دلار!
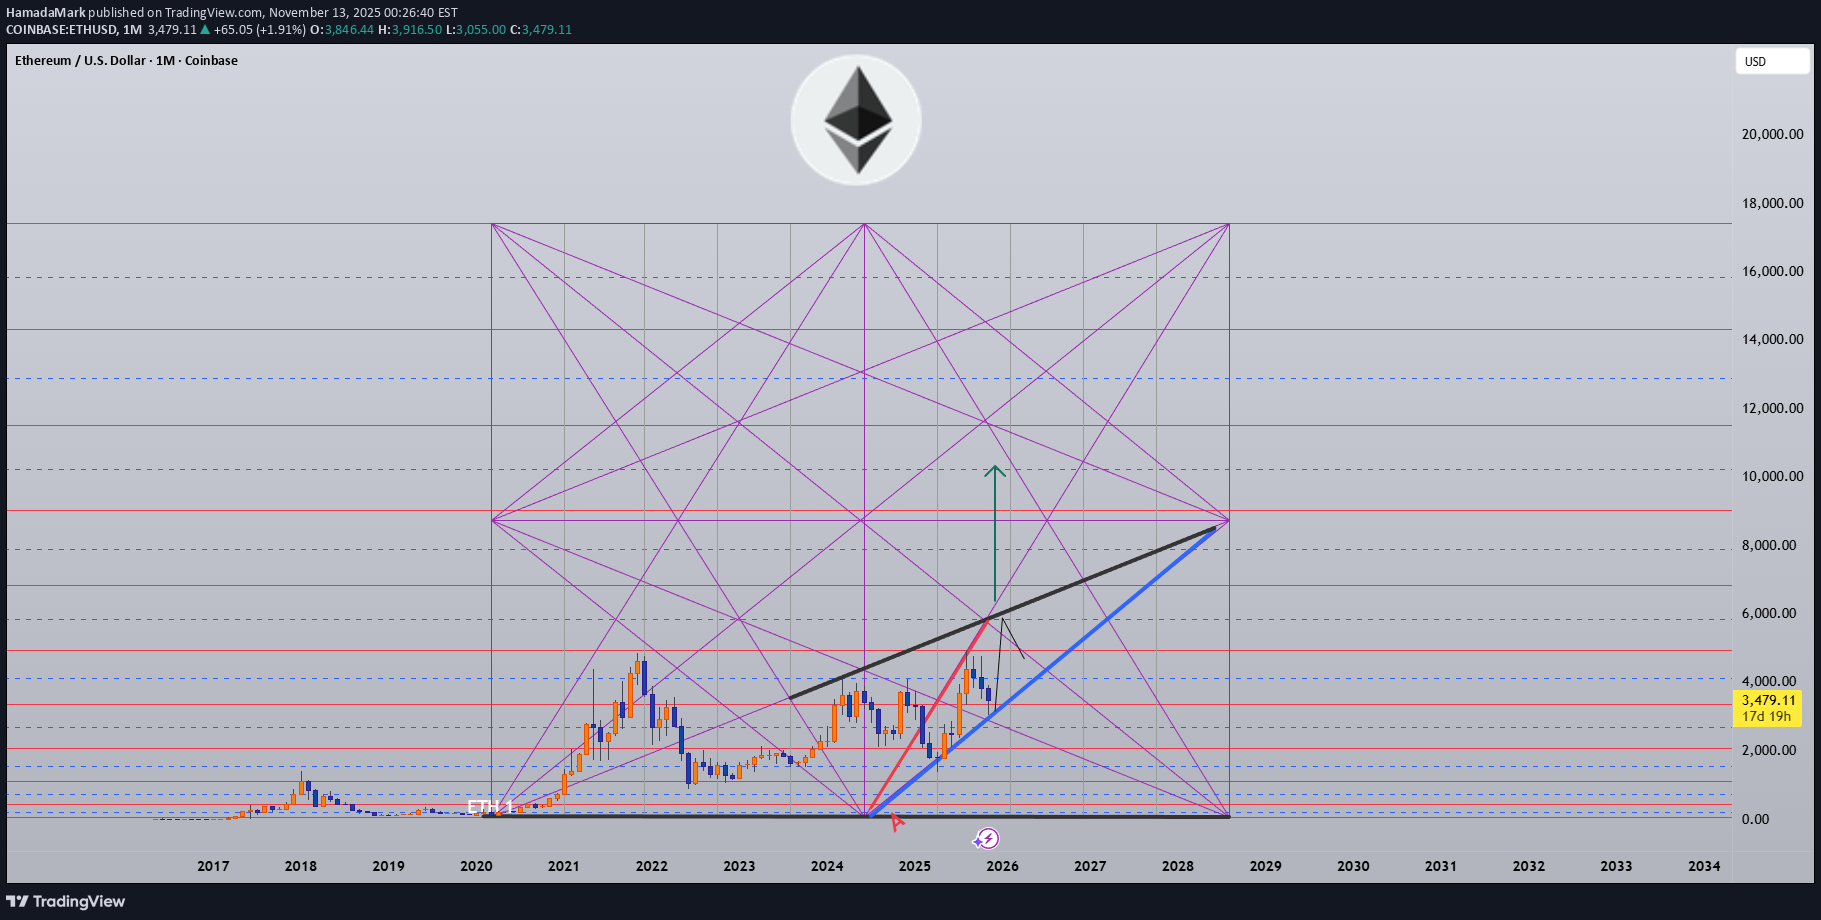
🧭 Gann Method Analysis This study is entirely based on Technical Analysis (Gann method) — no speculation, just structure and time cycles. 🔹 Gann Key Timing According to Gann cycles, 📅 25 November marks the start point of a new bullish attempt for ETH. The $2,500 level is the critical line if ETH closes a monthly candle below $2,500, it signals a significant change in the long-term roadmap. 🧭 Trend Setup As long as ETH holds $2,500 and stays above the Blue Trend Line (A), The bullish roadmap remains valid. 🎯 Roadmap Targets Breakout Key: $5,100 → Main breakout confirmation Target 1: $5,900 – $6,700 → First bullish leg (until Feb 2025) Target 2: $8,200 – $8,900 → Full bullish year if 2026 confirms Target 3: $10,150 → Extended top projection (2027–2028) 📌 All levels remain valid as long as ETH holds $2,500 on the monthly close. 💰 Trade Plan We have active entries: from $3, XXX, with remaining buy levels between $1,500–$1,850–$2,150. Max investment: 15 % of wallet. Risk-Reward (R: R): ≈ 1: 2 or higher. Set up invalidation: Monthly close below $2,500. Example: If you hold 10 ETH, you risk about $10K vs. the potential upside of $35–70K. ⚖️ Summary Support to hold: $2,500 Breakout confirmation: $5,100 Main targets: $5,900 → $6,700 → $8,900 → $10,150 Cycle: 2025 → 2028 Exposure: 15 % max Always trade with a clear plan and controlled risk. ⚓ Renzo Tip “The chart tells its truth to the patient — not the loudest trader, but the calm observer of time.” 🤲 Prayer May Allah guide us to trade with clarity, protect our effort from greed and confusion, and reward our discipline with lasting growth and wisdom.ETH 2017-2025 History! 🔹 2017 Cycle — ETH from $345 → $2000 Traded ETH under $15 and ETC around $7–10 🔹 2018 Crash — ETHUSDT analysis during market breakdown. 🔹 2019 Rotation Call — ETHBTC +4× cycle strength. 🔹 2020 Momentum Phase — ETHBTC +3× follow-through. 🔹 2020 Projection — ETH targeting $5K before top. 🔹 2022 Top Signal — Shark pattern & reversal zone identified. 2025 Work we ask Allah reconcile and repay
HamadaMark
پیشبینی شگفتانگیز LINK: مسیر صعودی تا ۱۶۰ دلار تا سال ۲۰۲۷ با تحلیل گن!
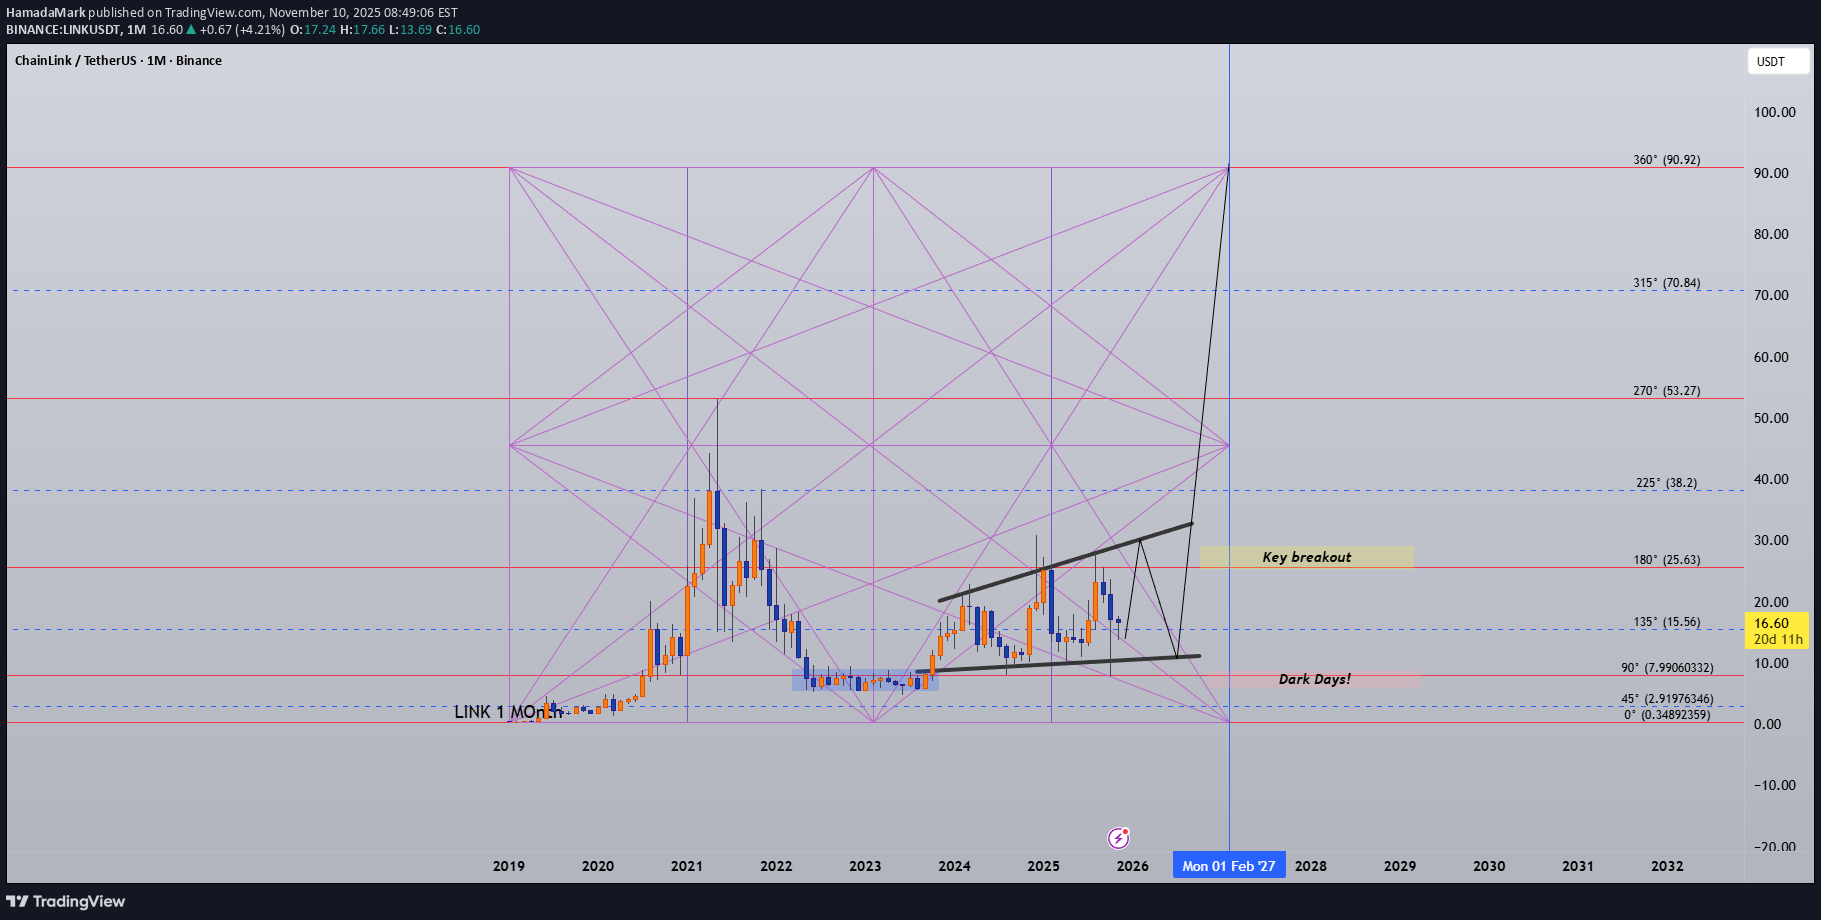
📊 #LINKUSDT Update 2025-2026-2027 I see a buy opportunity forming on LINK with a target around $30. A confirmed breakout above this line could open the way toward new ATH targets at $70 → $105 → $160. 🔑 Key Levels $15 → Tight trading range $10 → Main support line (must hold) $30 → Key resistance and first breakout target ATH targets: $70 → $105 → $160 If LINK ever closes a weekly candle below $10, That would signal a negative structure and likely invalidate this setup. ⚙️ Trade Plan 🎯 Entry Zone: Current levels around $15–$16-14 💰 Target 1: $30 💎 Targets 2–4: $70 / $90 / $160 🛡 Stop-Loss: Below $9 (weekly close basis) ⚖️ Max Risk Per Trade: 2–3% → If trade goes against us, losses capped at 2–3% of capital. ⏰ Duration: 180-720 days 🎲 Confidence in Trade: High! ⚓ Renzo Tip “When the rope tightens near the edge, pull only with patience — not fear. The breakout comes to the calm sailor.” 🤲 Prayer May Allah guide our trades with wisdom, protect us from greed and haste, and bless every patient decision that follows a clear plan.Chainlink (LINK) Fundamental Analysis (as of November 10, 2025) Supply: Chainlink has a maximum and total supply of 1,000,000,000 LINK, with a circulating supply of approximately 696,849,970 LINK (about 70% of total). Trading Volume: 24-hour trading volume is around $729 million, showing a 30% increase recently, indicating rising market activity. Market Cap & Price: Current market cap stands at ~$11.3 billion, with LINK trading at $15.58–$16.24 USDT. Team: Founded by Sergey Nazarov (CEO) and Steve Ellis (CTO); Chainlink Labs employs over 600 experts in cryptography and decentralized systems, with advisors like Dahlia Malkhi. Activity: Enabled over $26 trillion in transaction value; recent events include SmartCon 2025 and collaborations with institutions like Swift and UBS for DeFi and tokenized assets. Roadmap Updates: 2025 emphasizes capital markets and government adoption; Q1 highlights include CCIP expansions, Data Streams, and Chainlink Runtime Environment (CRE) launch in November for cross-chain workflows. Other Fundamentals: As the leading oracle platform, Chainlink powers secure data delivery for blockchains, with proven uptime and integrations in DeFi (e.g., Aave) and traditional finance, driving adoption amid blockchain growth.
HamadaMark
تحلیل تکنیکال طلا ۲۰۲۵: اهداف انفجاری و نقاط حمایت کلیدی (اکتبر)

📊 #GOLDUSD Update 🔑 Key Zones PRZ: $4,371 (Gold stopped nicely at $4,381!) Local Support Zone: $4,180–$4,050 Holding this range can send Gold soaring again toward: ➡️ $4,500 → $4,750 → $5,200 If these supports are lost, → next downside zones are: ➡️ $3,950 → $3,850 → $3,750 📅 Timeframe & View Short-term: Gold trading between $4,180–$4,050 — key range before the next big leg. Long-term: ATH projection levels: 💎 $5,300 → $5,700 → $7,300 → $7,700 These correspond with critical years for the global cycle: 2025 (Oct–Nov) performance 2027 2031 2033 Every pullback in this decade-long uptrend remains a buy opportunity. ⚖️ Gold or BTC? For the short term, my focus shifts to BTC. But once that phase completes, I’ll move back to Gold for the long wave. 💰 Long-Term Holders For those holding gold long-term (1 year+): Any pullback below $3750 remains a strong buy zone for adding. ✅ Quick Recap 📍 PRZ hit: $4,371–$4,381 🛡 Support: $4,180–$4,050 🚀 Upside Targets: $4,500–$4,750–$5,200 ⚠️ Downside Risk: $3,950–$3,850–$3,750 🧭 Cycle Years: 2025, 2027, 2031, 2033 💰 Focus: Short-term BTC → Long-term Gold 🧭 Personal Trading Note I only trade Gold in the real market, and use the demo setup here purely for tracking and study. ⚓ Renzo Tip “When the tide turns, the wise trader doesn’t fight it — he rides one wave, then waits for the next.” 🤲 Prayer May Allah bless us with patience in the long waves, wisdom in every entry, and reward us with clarity in both gold and time.The Eternal Luster of Gold In the dawn of time, when the earth was young and rivers whispered secrets to the stones, a wanderer named Elara found a gleam in the silt of a sun-kissed stream. It was pure gold, radiant like a captured star fallen from the heavens. She held it in her palm, feeling its warmth pulse like a heartbeat, and in that moment, humanity’s soul awakened to the allure of eternity. As seasons turned to centuries, gold wove itself into the story of empires. In ancient Egypt, pharaohs crowned themselves with its glow, believing it to be the flesh of gods. It built pyramids that reached for the sky and tombs that guarded kings forever. Across the sands in Mesopotamia, merchants traded it for spices and silks, its weight a promise of power and trust. Translation moment: Gold became the first universal symbol of value. People trusted it more than words or promises because it did not rust, fade, or vanish. The Greeks saw in gold not only wealth but wisdom, the symbol of the sun’s eternal fire. Alexander the Great carried it across the continent, forging an empire of golden threads. Rome rose on its back, minting coins whose clink echoed through history. Through the ages, gold endured the rush of California’s dreamers, the halls of Versailles, and the quiet vaults of modern fortunes. It has been both a curse and a blessing, the fuel of wars and the gift of love, whispering of beauty’s fragility and the human desire for something that lasts beyond the grave. In its shine, we see ourselves fragile yet forever chasing light. The Digital Dawn of Bitcoin Centuries later, under the glow of computer screens, a visionary named Satoshi dreamed of a new gold born not from the earth but from the ether of ideas. Bitcoin appeared in 2009 amid a world weary of banks and broken trust. Like gold’s ancient gleam, Bitcoin was mined not with picks but with puzzles solved by machines. It promised freedom, a currency without kings, flowing from person to person, unbound by borders or empires. Translation moment: Bitcoin works like digital gold. Instead of digging the ground, miners use computers to solve problems and unlock new coins. No one controls it, and that is what makes it powerful. Through doubt and frenzy, it rose as a beacon for those seeking sovereignty in a digital world. Its volatility became its soul, a reminder that true value is built on belief. Bitcoin speaks to ingenuity and rebellion, a star of code guiding us toward a future where wealth is weightless yet profoundly honest. Gold’s Cycles: Echoes of War and Crisis In the early 20th century, gold was held under fixed prices until the Great Depression of 1929 shattered these illusions. The 1934 dollar devaluation lifted it from 20.67 to 35, restoring faith amid despair. When World War II erupted in 1939, gold’s role as a refuge was muted by controls, yet it quietly held its place as the world’s silent guardian. The 1970s awakened its wild spirit. The Nixon Shock of 1971 freed gold from 35, sparking a bull run during the 1973 Oil Crisis. The 1979 Iranian Revolution led to a 1980 peak of 850, a leap of more than 2,000 percent, as investors sought safety from the chaos. Translation moment: When fear rises, people rush to gold. Every major war or economic crisis has sent gold upward because it feels safe when paper money loses trust. The 1987 stock crash caused brief dips, but the 1990 Gulf War reignited its glow. Around 2000, after the Dot-com Bust, gold found new life, climbing from $ 270 to over $1,900 during the 2008 Financial Crisis. It dipped to 1050 in 2015, then surged again past 2000 during the 2020 pandemic. The 2022 Ukraine War added another chapter with prices climbing above 2700 by 2025. Across a century of crises, gold has risen whenever fear tested humanity’s resolve, teaching patience and fortitude through its quiet endurance. Bitcoin’s Cycles: Echoes of Innovation and Crisis Born from the ashes of the 2008 Financial Crisis, Bitcoin began its story at mere cents. It traded below $1 until 2011, when it reached $30 before crashing by 90 percent following the MTGOX collapse. In 2013, it soared to 1242 only to fall again to 200 in 2015 as regulations tightened. The 2017 bull run lifted it to nearly 20000 before another long winter brought it to 3200 in 2018. Each fall taught resilience, each rise renewed belief. During the 2020 pandemic, it fell below 5000 before rallying to 69000 in 2021. The Ukraine War and the FTX collapse of 2022 brought it down to 16000, but also proved its role in humanitarian aid. By 2024, the halving and ETF approvals helped it break 100000, marking Bitcoin’s rise as digital gold. Translation moment: Bitcoin’s rhythm follows four-year halving cycles when mining rewards are cut in half. This keeps supply limited, which often triggers new bull runs as demand returns. Every four years, it's halving cycles 2012, 2016, 2020, 2024, fueling new waves of adoption and correction. Bitcoin grows strongest in times of uncertainty, echoing humanity’s drive to evolve beyond limits.The Harmony of Gold and Bitcoin Modern Parallels In today’s markets, gold’s ancient glow meets Bitcoin’s electric pulse. As of October 17, 2025, their correlation stands near 0.85, close to its historic high of 0.9. Both rise as guardians against inflation and the erosion of trust in the dollar. Gold trades near 4310 per ounce a record high while Bitcoin hovers around 104700 showing brief fractures in their unity. Gold offers the comfort of touch while Bitcoin provides the thrill of code. Together, they reflect fear and hope, the twin emotions that drive every market. Translation moment: A correlation of 0.85 means they often move in the same direction. When fear or inflation rises, both gold and Bitcoin tend to rise in tandem. Analysts warn of bubbles in stocks, gold, and crypto, yet optimism remains for Bitcoin’s growth through 2026, while gold holds its defensive strength. Gold carries risks of storage cost and theft, but steadiness in chaos. Bitcoin carries volatility and regulatory challenges, but it also offers unmatched innovation and reach. One is the anchor, the other the dream, and both reward those who hold conviction through uncertainty. Epilogue: The Timeless Balance Gold and Bitcoin form a bridge between the ancient and the future. Gold, the earth’s eternal treasure, stands as a symbol of stability and truth. Bitcoin, the digital heir, shines with the spark of innovation and freedom. Experts view gold as the ultimate inflation hedge, forged in fire and tested over centuries. They see Bitcoin as its digital counterpart, scarce by code and limitless in reach. Gold’s weight grounds us in reality while Bitcoin’s light expands our imagination. In 2025, as gold surpasses $4,346 and Bitcoin hovers near $105,000, the wise investor sees not rivals but reflections. Translation moment: Gold reminds us to protect what we have. Bitcoin reminds us to dream of what could be. Together, they balance caution and courage, the two forces every generation must master. One whispers of legacy, the other of evolution, yet together they tell humanity’s oldest story, our unending quest to preserve value against time and to chase the light that never fades. 🙏 I ask (Allah) for guidance and success. 🤲CYCLES
HamadaMark
بیت کوین در آستانه انفجار یا سقوط؟ مرز حیاتی 128 هزار دلاری BTC را بشناسید!

BTCUSD (3-Month Macro View) 📊 Discipline First: Chart timeframe = 3 M candles. This view focuses on the macro cycle and long-term structure rather than short-term noise. Key Levels & Plan Main Resistance: $128 K zone → key breakout or rejection level. If BTC fails to hold $128 K: a healthy pullback toward $99 K ± 2 K is expected. This aligns with Fibonacci 2.0 ≈ $107 K and 1.618 ≈ $90 K zones (major re-entry areas). If BTC holds and confirms breakout: next macro sell zone lies between $137 K–$141 K, close to Fib 2.618–3.0 levels. 🧭 Macro logic: BTC currently trades around $124 K after a parabolic leg. The market is testing the upper Fibonacci cluster (2.618–3.0). History shows similar behaviour near major cycle peaks → sideways consolidation → 30–35 % pullback → new impulse. That’s why the plan balances both outcomes (“Plan A: Breakout / Plan B: Pullback”). Cycle Outlook (2025 → 2027) ✅ If Breakout holds: target $137 K–$141 K, potential overshoot $153 K–$181 K (Fib 3.0–3.618). ⚠️ If rejection: retrace to $99 K range (≈ −31 %), then rebuild base for next leg. 🔄 Time horizon: the projection extends to Q4 2027, matching the next halving + liquidity wave period. Tools Used Fibonacci retracement (0.5 → 3.618 projection). 3 M EMA trend lines (15 MA / 30 MA). RSI macro divergence confirmation (lower panel shows hidden bullish continuation pattern). ⚓ Renzo Tip “When the wind blows strong, weak sails tear, but the wise captain knows where to unload the weight.” → Meaning: in volatile peaks, lighten exposure — strength lies in controlling load, not chasing wind. 🤲 Prayer Line May our trades stay disciplined, our minds patient, and our sails guided by wisdom, not fear.i will trade $121-118-116K with 5-10% invest SL below $114K 3 Days close we ask Allah reconcile and repaystill in the game as no 3 days close below $114K
HamadaMark
TRUUSDT Setup – Real World Asset DeFi Play | Buy Zones + Target
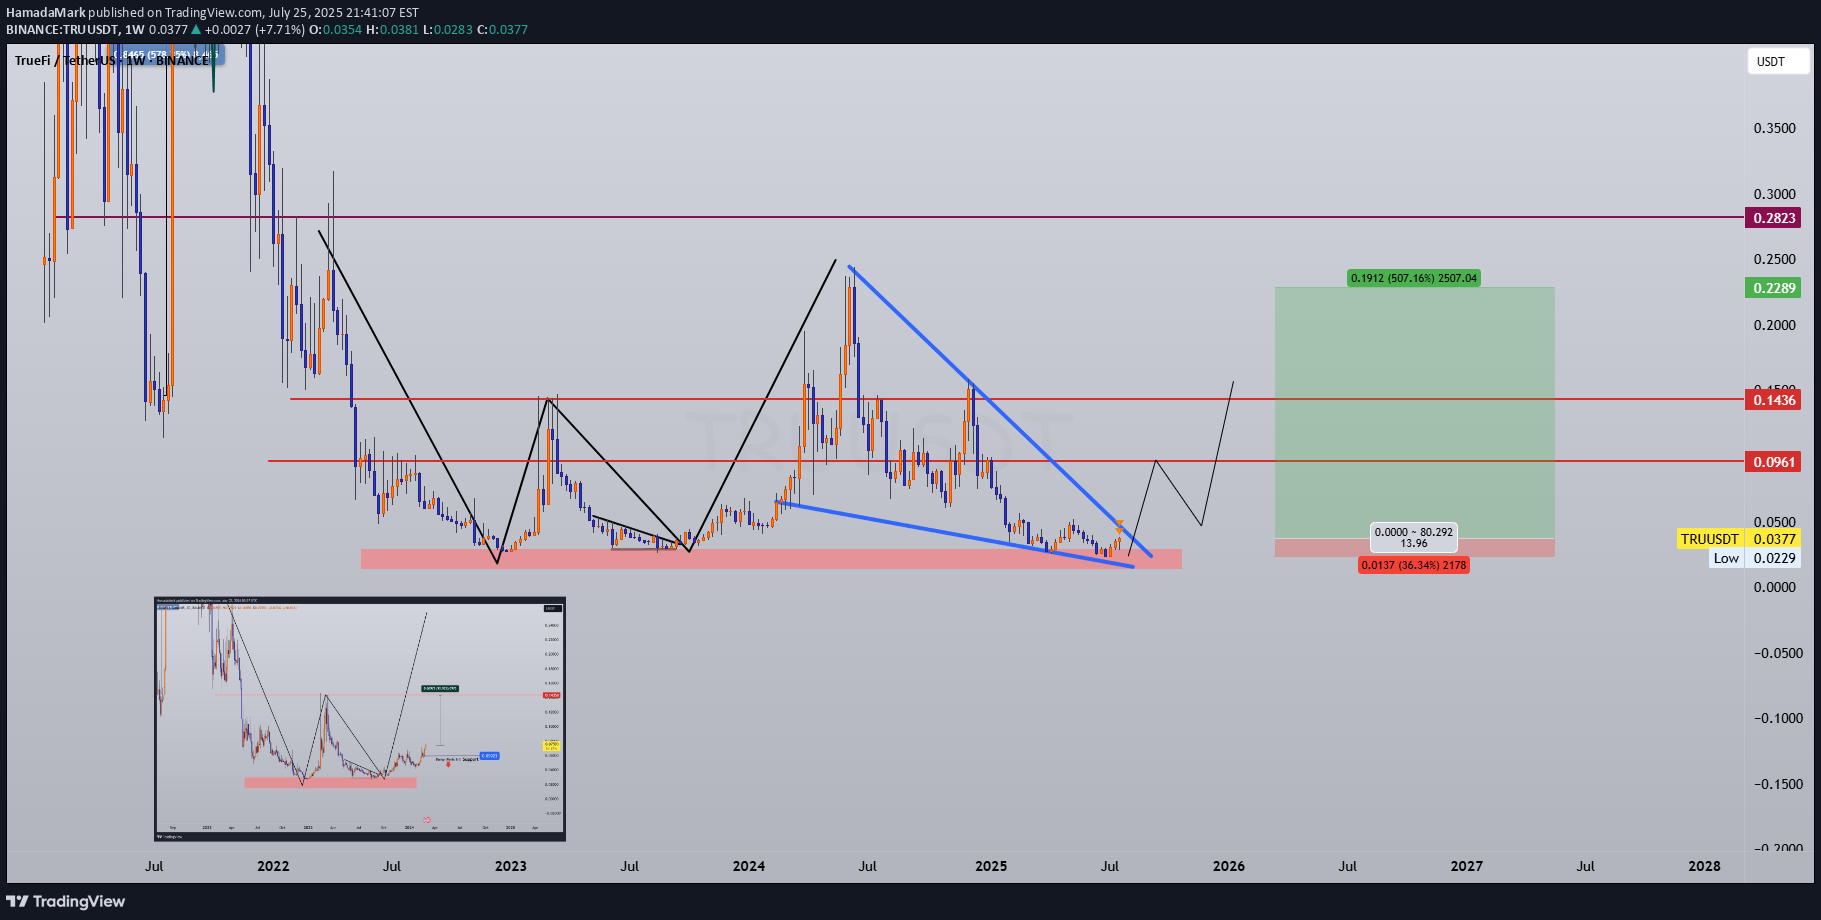
📌 Coin: TRU (TrueFi) 💰 Buy Levels: ✅ First Entry: $0.0378 ✅ Second Entry: $0.0325 ✅ Third Entry: $0.0270 🛑 Panic / SL Level: Weekly close below $0.0240 🧠 Fundamental Analysis (FA) – In Short *️⃣ Sector: DeFi / Real World Assets (RWA) Lending *️⃣ Use Case: TrueFi is a decentralized credit protocol focused on unsecured and real-world asset lending, serving institutions with on-chain transparency. *️⃣ Tech: Combines DeFi-native liquidity pools with off-chain credit assessment for borrowers. Offers tokenized credit portfolios, automated debt servicing, and risk scoring. *️⃣ Narrative Fit: Perfectly aligned with the RWA + on-chain credit markets narrative, TrueFi offers one of the few active RWA lending infrastructures in DeFi. *️⃣ Adoption: Partnered with large institutions including Archblock (formerly TrustToken), active in real-world treasury and asset-backed lending markets. *️⃣ Unique Angle: TrueFi pioneered on-chain uncollateralized lending — a rare use case bridging traditional finance (TradFi) with DeFi. 📊 Tokenomics & Market Data (As of July 2025) 🪙 Current Price: ~$0.034 🧾 Market Cap: ~$38M 🔢 Rank: ~Top 450 🧮 Circulating Supply: ~1.1B TRU 🔒 Max Supply: 1.45B TRU ⚙️ Token Use: Governance, staking, incentive alignment for underwriters and lenders 💡 Inflation: Fixed max supply, most emissions already circulated 🎯 Bull Market Target (Realistic) Target Range: $0.09 – $0.12 *️⃣ Based on revaluation of DeFi protocols aligned with RWA lending and increased institutional adoption. 🚀 Mega Bullish Target (Speculative Top) Target Range: $0.18 – $0.28+ *️⃣ If on-chain credit and RWA tokenization become core crypto narratives, TRU could be a top re-rated microcap in that sector. *️⃣ As one of the first RWA lending protocols with real integrations, it has potential to lead a sector-wide DeFi resurgence. ✅ Final Take 🧠 TRU stands out as one of the earliest movers in institutional RWA lending on-chain. Your $0.027–$0.0378 entries are deep within macro support, and the $0.024 SL offers clear protection against breakdown. Low market cap + strong narrative = explosive upside if RWA gains traction. we ask Allah reconcile and repay
HamadaMark
#Avalanche (AVAX) Setup | Can Subnets Ride the ETF Wave?
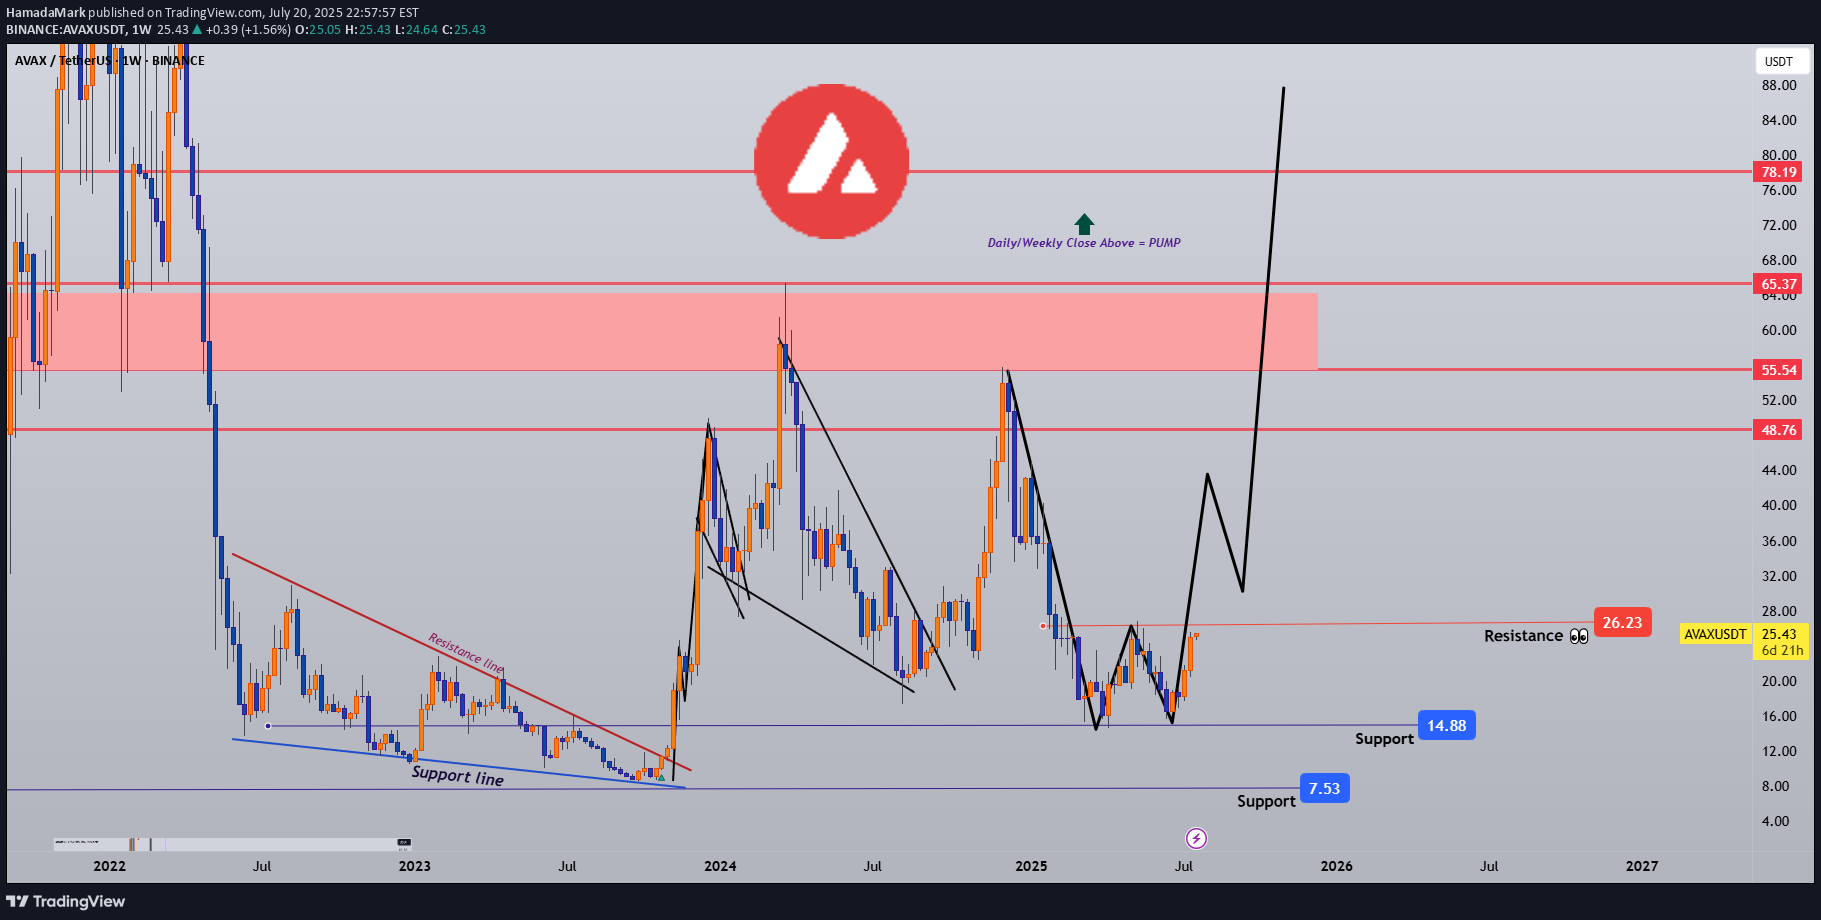
📌 Coin: AVAX (Avalanche) 💰 Buy Levels: ✅ First Entry: $25.00 ✅ Second Entry: $22.00 ✅ Third Entry: $19.00 🛑 Panic / SL Level: Weekly close below $17.00 🧠 Fundamental Analysis (FA) – In Short *️⃣ Sector: Layer 1 / Modular Smart Contract Platform *️⃣ Use Case: Avalanche is a high-performance blockchain enabling scalable, low-latency dApps, tokenized assets, and Web3 games through custom subnets. *️⃣ Tech: Uses Avalanche consensus across three chains (X/P/C), delivering near-instant finality, sub-second transaction speed, and flexible design. *️⃣ Narrative Fit: Strong narrative alignment with RWA (Real World Assets), Web3 Gaming, and future ETF inclusion due to institutional activity. *️⃣ Enterprise Adoption: Already used by JPMorgan pilot programs, Citi, Deloitte, MasterCard, and more — making it one of the few real-world-tested chains. *️⃣ Unique Angle: Subnets allow permissioned chains, native gas tokens, and fully custom blockchains — ideal for both DeFi and enterprise. 📊 Tokenomics & Market Data (As of July 2025) 🪙 Current Price: ~$23.30 🧾 Market Cap: ~$9B 🔢 Rank: Top 15 🧮 Circulating Supply: ~395M AVAX 🔒 Max Supply: 720M AVAX 🔥 Deflationary Mechanism: AVAX burn from fees, reducing long-term supply 🛠️ Validator Rewards: Distributed through staking + subnet usage 🎯 Bull Market Target (Realistic) Target Range: $48 – $65 *️⃣ Based on prior cycle resistance, subnet growth, and DeFi/gaming recovery. 🚀 Mega Bullish Target (Speculative Top) Target Range: $95 – $135+ $200 *️⃣ Avalanche is at the front of RWA tokenization, already powering platforms like Intain, and involved in enterprise pilots with Citi, JPMorgan, and Mastercard. *️⃣ If RWA becomes the core crypto narrative, Avalanche’s modular subnet design could drive institutional adoption at scale. *️⃣ While not yet in ETFs, its technical credibility + enterprise presence makes it a top candidate for future L1 ETF exposure or crypto asset baskets. *️⃣ Combine institutional flow + Web3 gaming + subnet scaling, and you get a realistic path to triple-digit price discovery. ✅ Final Take 🧠 Avalanche is a technically mature Layer 1 with real-world traction and modular scaling via subnets — giving it strong utility and upside. we ask Allah reconcile and repay💰 Buy Levels: ✅ First Entry: $25.00 ✅ Second Entry: $22.00 ✅ Third Entry: $19.00 🛑 Panic / SL Level: Weekly close below $17.00#AVAXUSDT #LINKUSDT
Disclaimer
Any content and materials included in Sahmeto's website and official communication channels are a compilation of personal opinions and analyses and are not binding. They do not constitute any recommendation for buying, selling, entering or exiting the stock market and cryptocurrency market. Also, all news and analyses included in the website and channels are merely republished information from official and unofficial domestic and foreign sources, and it is obvious that users of the said content are responsible for following up and ensuring the authenticity and accuracy of the materials. Therefore, while disclaiming responsibility, it is declared that the responsibility for any decision-making, action, and potential profit and loss in the capital market and cryptocurrency market lies with the trader.