
Goldfinch_song
@t_Goldfinch_song

What symbols does the trader recommend buying?
Purchase History
پیام های تریدر
Filter
Goldfinch_song
آپْتوس (APT): فرصت خرید بلندمدت از کف قیمتی با پشتوانه استیبل کوینهای سنگین!
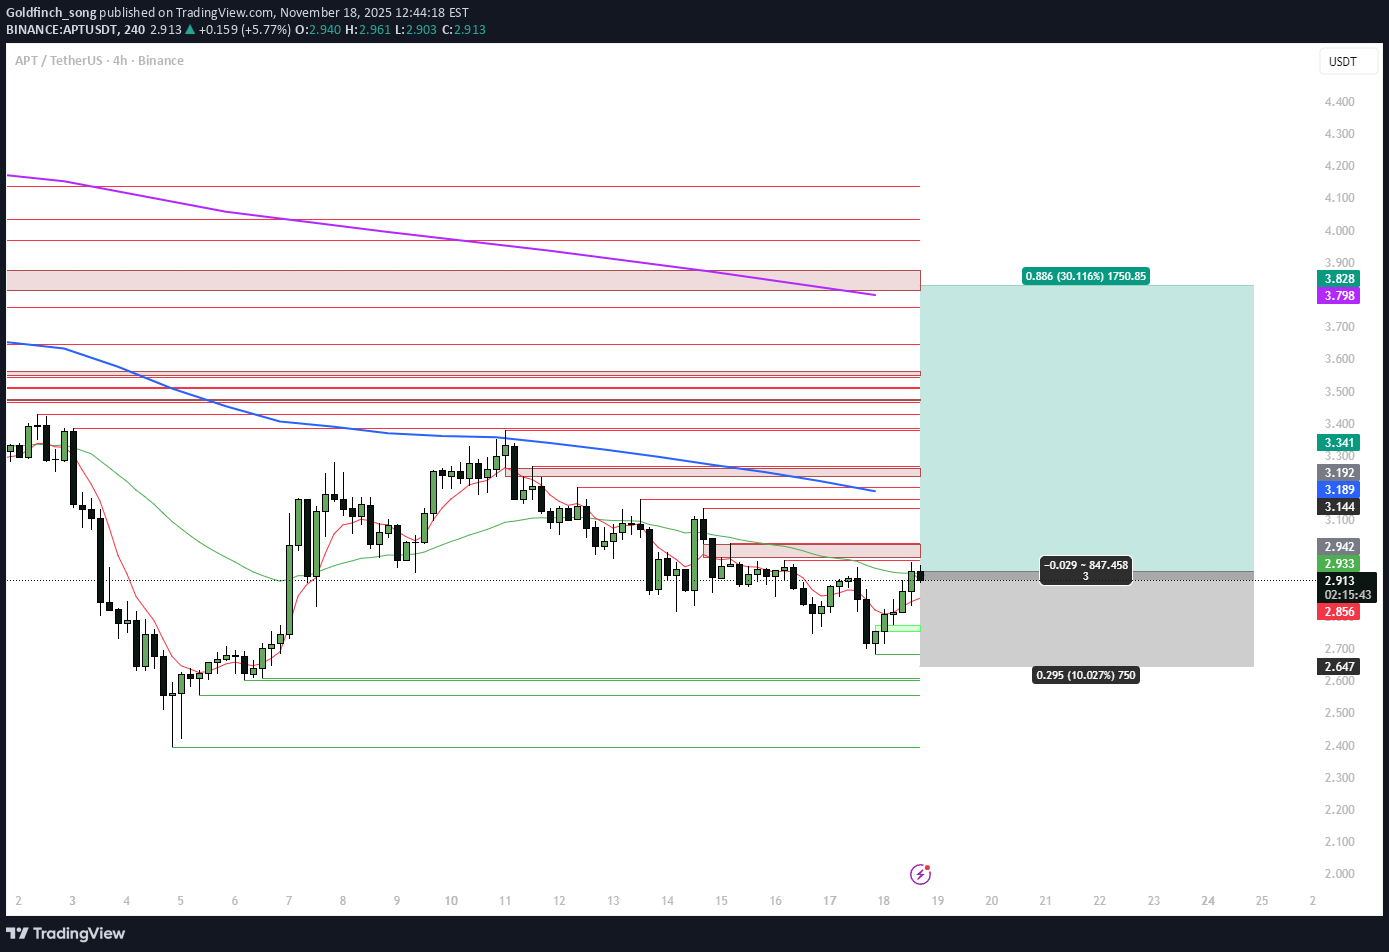
Aptos is trading around $2.9 with a market cap near $2.1B, still down ~85% from the $19.9 ATH. At the same time the chain carries ~$512M TVL and ~$1.27B in stablecoins (almost half of that in the RWA token BUIDL). That’s a lot of liquidity for a token this depressed. Over the last month APT is up ~+10%, and on several recent days Aptos briefly beat both Ethereum and Solana by net stablecoin inflows. The main fundamental driver is the Aave V3 launch on Aptos (first non-EVM deployment) plus an institutional staking narrative (Everstake + Paribu Custody). The big overhang is still tokenomics: ~11–12M APT unlocks each month in 2025 and generally high inflation vs current on-chain demand, plus the controversial “freeze” function at protocol level. Technical view (#4h) On the 4H chart APT has been in a controlled downtrend from the 3.7–3.8 area and recently put in a local low near 2.63–2.65, right on my lower ATR / demand zone. Now: Price is reclaiming the short EMA and pressing into the 4H EMA band from below around 2.9–3.0. Below sits a well-defined support shelf at 2.60–2.65; above are stacked supply/FVG levels around 3.16–3.20 and a larger cluster near 3.8–3.9, which coincides with higher-TF EMA and previous breakdown zone. My 4H system has flipped from pure deviation mode to an early trend-reversal long: oversold extension + first reclaim of the EMA band. I treat this as a swing-long attempt from a local base inside a bigger bearish cycle, targeting a move back into the prior distribution zone. Trade plan (swing 3–10 days) Entry: around 2.90–2.95 (current price area). Main target: 3.30–3.35 – first 4H supply band and old support. Extended target: 3.80–3.85 – upper supply zone and confluence with higher-TF resistance. Stop / invalidation: below 2.63–2.65. A confirmed 4H close under this level would mean the current base failed and I step aside instead of averaging down. This gives roughly 3:1 R:R toward the extended target. Fundamental context Aptos is a Move L1 with strong stablecoin presence: ~$1.27B in stables and ~$512M TVL, plus meaningful RWA share (BUIDL ≈44% of stablecoin cap). Aave V3 on Aptos is the first non-EVM deployment for Aave, anchoring a more “institutional” DeFi narrative on this chain. Institutional staking partnerships (Everstake + Paribu Custody) support the idea of APT as a staking asset, but not yet as a clear “number go up” token. Main risks: continuous monthly unlocks (~11M+ APT), inflationary supply vs demand, and competition from larger L1s (Sui, Solana) with bigger TVL and higher chain revenue. Alternative scenario If APT loses 2.63–2.65 and starts closing 4H candles below this zone on rising volume, I’ll consider the current long thesis invalid and look for a deeper capitulation / deviation toward 2.4–2.2 before reassessing. No averaging into unlock-driven selling. Not financial advice – just how I’m structuring a 4H swing long on APT around strong on-chain liquidity and Aave V3, while respecting the heavy tokenomics overhead.
Goldfinch_song
تحلیل تکنیکال و استراتژی خرید UNI پس از تصویب "ادغام"؛ هدف ۱۰ دلار!

Uniswap remains one of the key DEX protocols: TVL is around $4.5B and 30-day DEX volume is roughly $94.6B, which keeps Uniswap at the top of the sector by liquidity and fee generation. Over the last 30 days UNI is up ~+22%, with a sharp acceleration in November (70%+ week) after the UNIfication proposal: enabling protocol fees and burning up to 100M UNI (~16% of supply). That fundamentally changes expectations for UNI as a value-accrual token rather than “governance only”. On derivatives, UNI trades with deep liquidity: OI ≈ $560M, ~ $1.16B futures volume and ~$220M spot per 24h, so larger positions can enter/exit without severe slippage. Regulatory tail risk also eased earlier this year when the SEC closed its investigation into Uniswap Labs without charges. Technical setup (#4h) After the vertical post-UNIfication spike into the 10–11 area, UNI has been digesting the move in a sideways 4H range roughly between 7.3 and 8.1: Price is hovering around the 4H EMA band; on higher TFs (1D–3D) UNI still trades above the main EMAs, keeping the broader uptrend intact. Multiple tests of the lower part of the range (7.3–7.5) have been bought back, with my PRICE_EMA long signals firing near the lower deviation/ATR zone. Overhead, a major supply/OB cluster sits around 10–10.5, which also matches the prior spike highs and HTF resistance. I view this as a post-news consolidation above support within an emerging bullish trend. Strategy context This trade comes from my 4H EMA-based swing system (trend-following mode): The system focuses on buying pullbacks to the EMA band during strong momentum phases and targeting prior liquidity zones. Sample of 30+ trades on alts shows roughly ~70% win rate with average winners larger than losers, at the cost of relatively wide stops and multi-day holding times. UNI currently fits the “momentum + consolidation on EMAs” template for this system. Trade plan (swing 3–10 days) Entry zone: ~7.5–7.7 (current spot around 7.6–7.7). Main target: 10.2–10.3 – retest of the post-UNIfication spike high and upper supply block. Stop / invalidation: below 6.8–6.9 (under the lower ATR band and recent local lows). A 4H close below this zone would mean the consolidation broke down and the “second leg” scenario is off. This gives a rough R:R of ~3.5:1 from entry to the 10.2–10.3 target. I’ll look to trail partial size if price breaks and holds above 8.5 (orange level) with strong volume, but the core idea is to catch one clean extension from the current range into the upper resistance cluster. Fundamental snapshot Key bullish points: UNIfication: proposal to turn on protocol fees and burn up to 100M UNI (~16% supply), aligning Labs, Foundation and DAO economics and finally connecting UNI to protocol cash flows. Strong fee engine: Uniswap generates ~$1.25B annualized fees, ~$100M in the last 30 days, currently all going to LPs – a large “pool of value” that fee switch can redirect partially to UNI. Sector leadership: ~$94.6B 30-day DEX volume and deep liquidity in UNI markets (tens of millions in depth), making it one of the core DeFi blue chips. SEC case closed: investigation into Uniswap Labs ended without charges, cutting a major tail risk. Key risks: UNIfication is not fully implemented yet – parameters of fee switch and burn (LP share vs DAO vs burn) can still change and may trigger LP outflows. DeFi / DEX tokens as a group still trade at a discount vs L1s, and Fear & Greed is in Extreme Fear territory. UNI is still ~−80% below its $44 ATH, so structurally it’s early in any potential new DeFi cycle. Alternative scenario If UNI breaks down and starts closing 4H candles below 6.8–6.9 with no new positive catalysts on UNIfication or DeFi sentiment, I’ll treat this setup as invalid and stand aside, watching the 6.0–5.5 area for a deeper retrace and fresh structure before considering new longs. Not financial advice — just my structured 4H EMA swing long on UNI, combining the current consolidation pattern with system stats and the UNIfication fundamental narrative.
Goldfinch_song
سیگنال خرید قوی JUP: فرصت بازگشت به میانگین پس از سقوط شدید (آیا کف قیمتی تشکیل شده است؟)
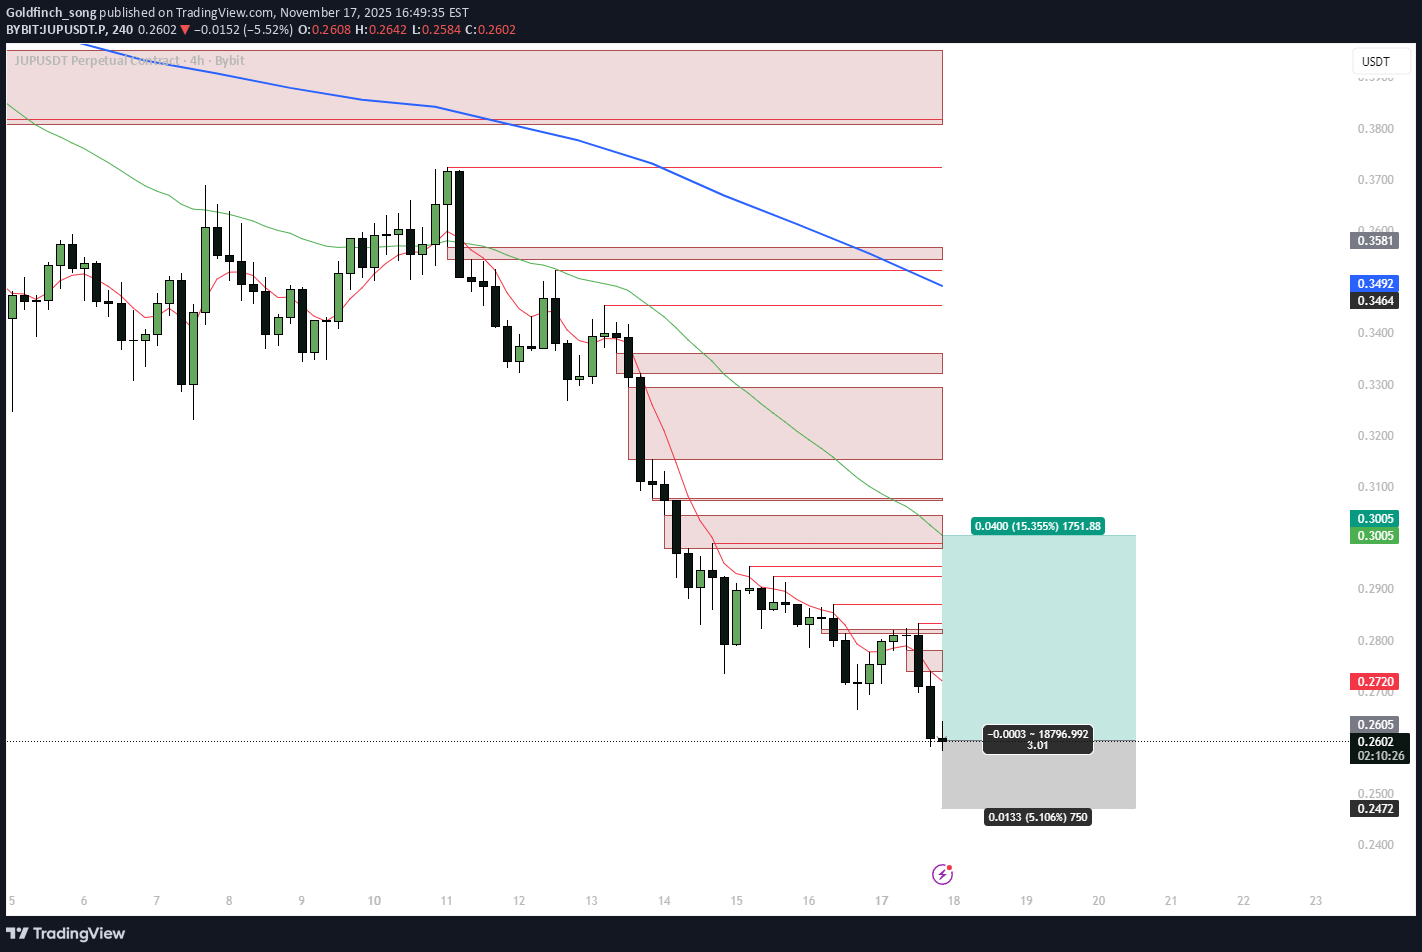
JUPUSDT (Bybit) is trading near the lower end of its autumn range after a clean 4H downtrend from the 0.33–0.34 area. My 4H EMA deviation system has just printed a long signal as price extends away from the higher-timeframe averages. Technical setup (#4h) Price is below the 4H, 1D and 3D EMAs, with Dev% on multiple TFs showing strong downside extension (high single-digit / low double-digit % below the mean). We’ve just tagged a new local low around 0.25–0.26 with several multi-TF exhaustion markers firing near the lower ATR band. Overhead, the first liquidity pocket and resistance cluster sits around 0.26–0.28, with a larger supply/FVG zone and EMA confluence around 0.30–0.31. I treat this move as a late leg of the existing selloff and a potential mean-reversion opportunity back into the 4H EMA ribbon and prior supply. Strategy stats (this 4H deviation system) Backtest/forward sample: 33 trades, all longs Win rate: ~69.7% (23 wins / 10 losses) Avg PnL per trade: ~+4.1% Avg winning trade: ~+10.0% Avg losing trade: ~−9.6% Avg bars in trade: ~34 bars on #4h (≈ 5–6 days), with losers typically lasting longer than winners The system is built to catch oversold 4H swings with a relatively high hit rate and symmetric win/loss size, so sticking to invalidation levels is crucial. Trade plan (swing 3–7 days) Entry: around 0.26 (current long triggered in this area). Main target: 0.300–0.305 — previous 4H supply zone and confluence with the EMA band. Stop / invalidation: below 0.247. A 4H close under this level would mean the current demand failed and opens the door toward deeper supports around 0.23–0.22. This setup offers roughly 3:1 R:R from entry to the 0.30–0.305 target. Fundamental snapshot (Jupiter) Jupiter is the main DEX aggregator and perps venue on Solana. Over the last 30 days: Protocol fees / revenue are roughly $78.8M / $19.0M, showing a robust on-chain business across spot + perps. Governance approved a burn of ~130M JUP (~4% of circulating supply) from the Litterbox Trust (vote passed on 4 Nov 2025). Token unlocks continue on a scheduled basis (e.g. ~53.47M JUP on 28 Oct 2025), keeping some overhang in the short term. November 2025: launch of the Jupiter ICO / launchpad platform, adding another product line on top of swaps and perps. Saros DLMM integration is aimed at deeper liquidity for JUP and ecosystem pairs. Net read: cash-flow-positive DeFi infra with upcoming product catalysts, but short-term price still sensitive to unlocks and derivatives positioning — a good environment for volatile swings and mean-reversion trades. Alternative scenario If unlock / derivative selling pressure accelerates and JUP starts closing 4H candles below 0.247, I’ll consider this idea invalid and look for a new deviation long lower in the 0.23–0.22 zone rather than averaging down. Not financial advice — this is my structured 4H EMA deviation long on JUP, combining system stats with current Jupiter fundamentals.
Goldfinch_song
سیگنال خرید قوی برای SUI: استفاده از استراتژی انحراف قیمت برای بازگشت به میانگین
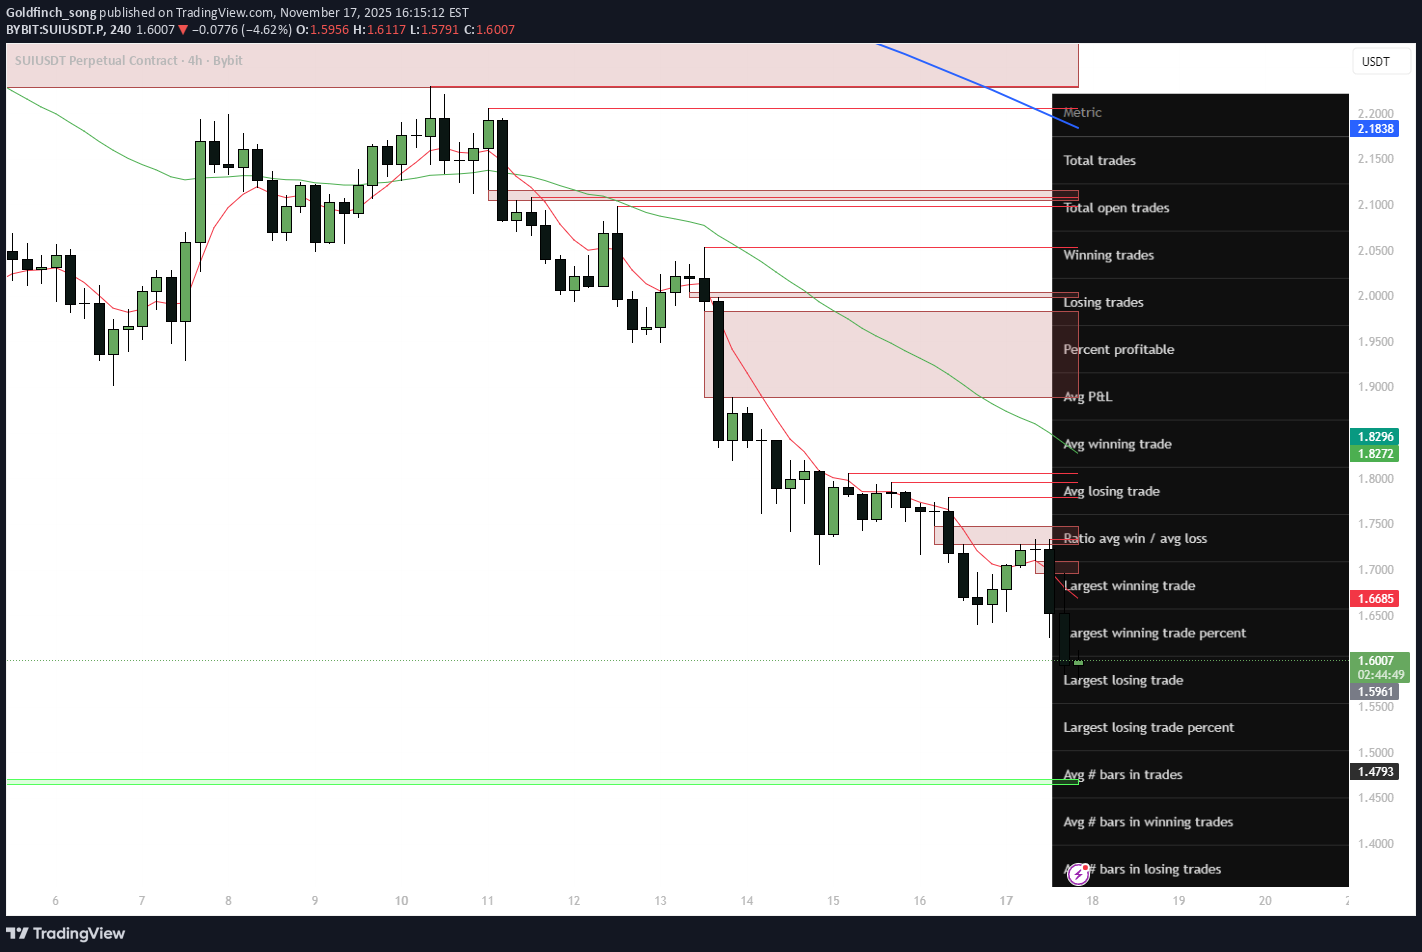
Got a fresh long signal from my 4H EMA deviation strategy on SUIUSDT (Bybit). After a persistent downtrend from the 2.3–2.0 area, price has flushed into my lower deviation / demand zone and is now extended from the main EMAs on several timeframes. On the chart (#4h): – Price is trading well below the 4H and 1D EMAs, Dev% on multiple TFs shows strong extension away from the mean. – We just printed another local low with a cluster of my multi-TF “exhaustion” signals, right on the lower ATR band. – Above price sit the first liquidity pockets around 1.66–1.69 and then a larger supply/FVG zone near 1.75–1.83, aligned with the 4H EMA ribbon. – I treat this move as a liquidation / unlock front-run leg inside a still-resilient higher-TF range for SUI. Strategy stats (for this 4H deviation system) 31 trades, all longs: – Winrate ≈ 83.9% (26W / 5L) – Avg win ≈ +12.5%, avg loss ≈ −6.6% → avg R:R ≈ 2.37 – Avg holding time ≈ 24 bars on #4h (about 4 days) So the system is designed to take oversold 4H swings and ride the mean-reversion back into the EMA band / supply zones over 2–5 days. Trade plan (swing 2–5 days) – Entry: around 1.60–1.62 (current long triggered near 1.61). – Main target: 1.75–1.77 — first 4H supply zone and mid of the previous distribution block. – Extended target: 1.82–1.83 — upper boundary of the 4H supply cluster and confluence with higher EMA/ATR levels. – Invalidation: 4H close below 1.48. That break would mean the current demand zone failed and I step aside. This gives an R:R of roughly 1:2 from entry to the extended target. Fundamental snapshot SUI is still holding in the upper part of its yearly range despite the recent correction. Over the last 30 days: – TVL around ~$3.03B (≈$1.64B bridged, ~$1.39B native), with strong DEX volume (~$383.5M/day) and perps volume (~$144.3M/day). – Narrative tailwinds: upcoming USDsui native stablecoin from Bridge (Stripe-backed), institutional rails via Crypto.com custody/liquidity, and the Mysticeti v2 core upgrade from Mysten Labs. – Headwinds: notable November unlocks (~$146.6M pool), TVL pullback of ~15% from the October peak and sector-wide risk-off in L1/alt space. Net read: structurally positive fundamentals and growing ecosystem, but short-term risk is higher due to unlocks and derivatives positioning — ideal conditions for sharp but tradeable mean-reversion moves. Alternative scenario If unlock selling and risk-off pressure continue and SUI starts closing 4H candles below 1.48, I’ll treat this as a deeper leg toward the next demand around 1.40–1.35 and will wait for a new deviation signal rather than averaging down. Not financial advice — just a structured 4H deviation long based on my system stats and current SUI fundamentals.
Goldfinch_song
تحلیل SYRUP (Maple Finance): فرصت خرید شیرین در کمین پس از ریزش شدید!
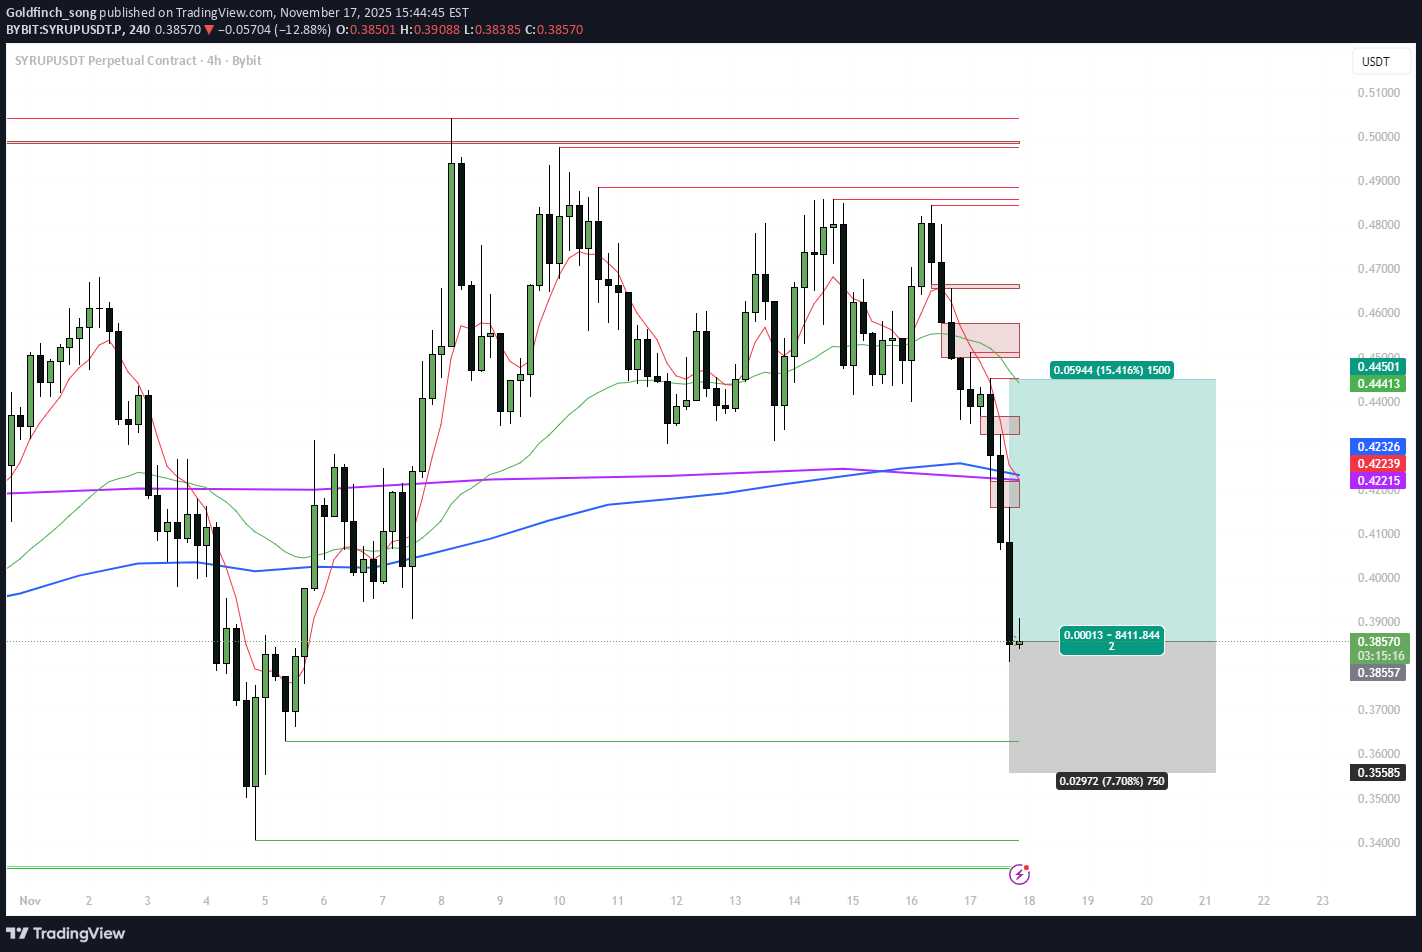
SYRUP (Maple Finance) printed a strong flush on the 4H chart and is now trading in my first demand / deviation zone after breaking down from the 0.42–0.45 range. Fundamentals remain constructive: – AUM > $5B in Q3, up ~66% QoQ. – Q3 revenue around $4M with an October ATH of ~$2.16M. – 25% of protocol revenue is allocated to SYRUP buybacks and staker rewards (MIP-018/019), directly linking the token to cash flows. So we have a fundamentally supported DeFi credit token going through a short-term deleveraging move. On the 4H chart: – Price is trading below both 4H and 1D EMAs, with Dev% showing clear oversold conditions vs the mean. – The last leg down came with a vertical selling cluster into the lower ATR band. – Above price, the key liquidity zones are 0.422–0.423 (broken support + EMA area) and 0.44–0.445 (supply cluster / range high). I treat this as a potential mean-reversion setup rather than a fresh downtrend start. Trade plan (swing 1–5 days) – Long area: 0.395–0.405, with optional partial add on a spike toward 0.38. – Main target: 0.422–0.423 — retest of broken support and the 4H EMA region. – Extended target: 0.44–0.445 — upper supply zone and range high. – Invalidaton: 4H closes below 0.355. Stop goes under this level; if it breaks and holds, the setup is done and I wait for a new base lower (0.334–0.31). This gives an approximate R:R of ~1:2 toward the main target and higher if the extended target is hit. Alternative scenario If DeFi risk keeps unwinding and 0.355 fails to hold, I expect price to explore the 0.334–0.31 area, where a new accumulation zone may form. In that case this long idea is invalid and I’ll re-map the structure before looking for the next entry. Not financial advice — just my 4H EMA deviation swing framework combined with current fundamentals on Maple Finance.
Goldfinch_song
سیگنال خرید قوی PLUME: بازگشت از کف با کاتالیزورهای RWA و USDC
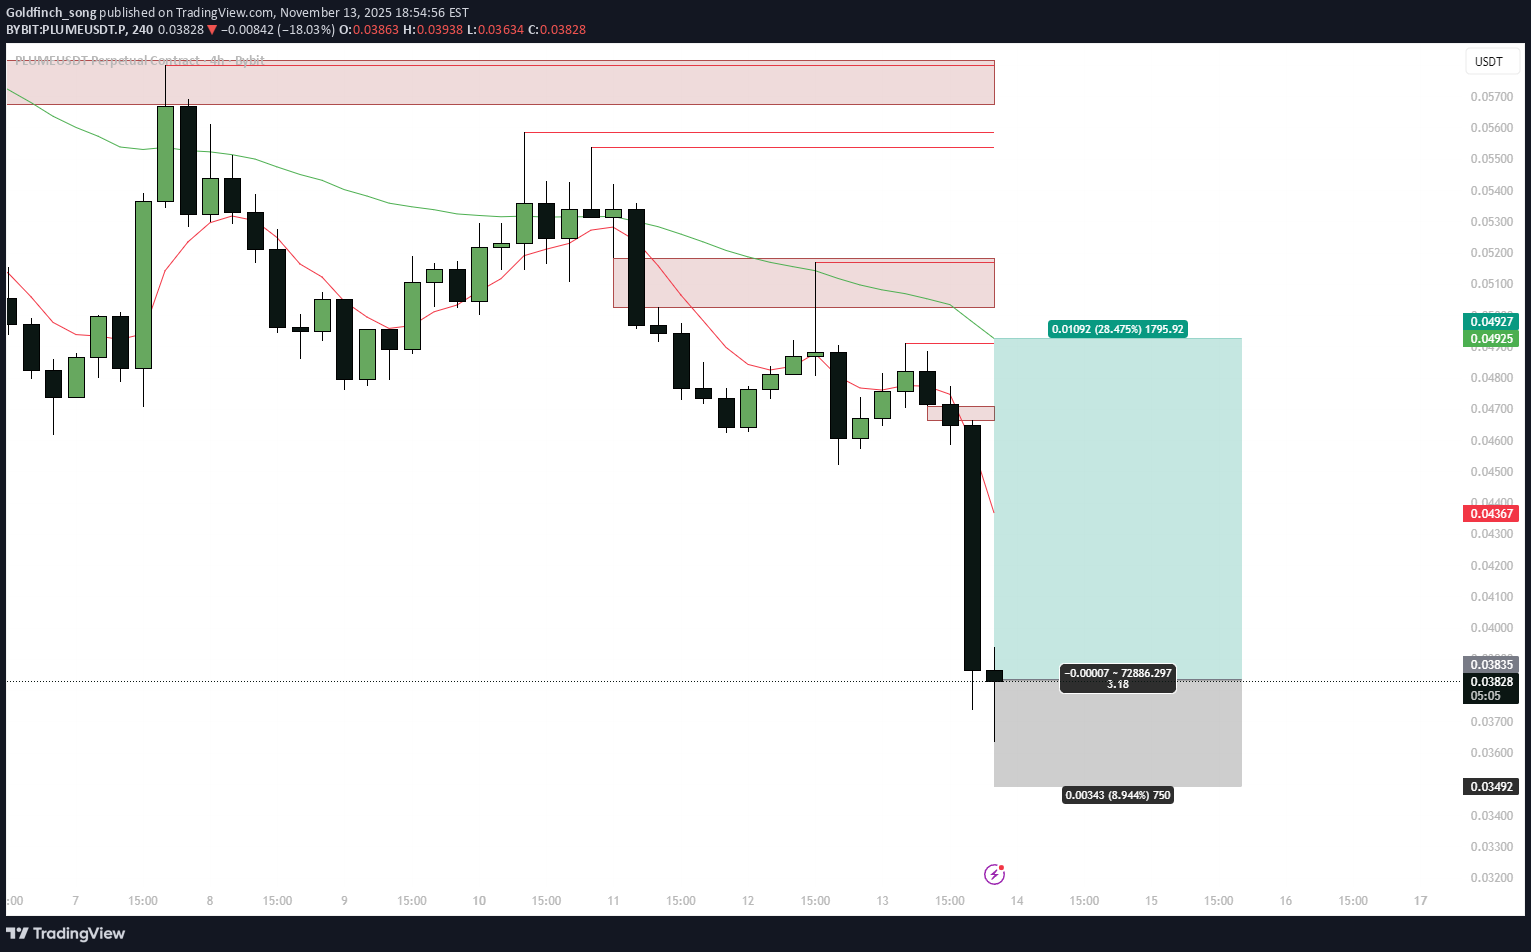
Setup PLUMEUSDT just printed a fresh 4H EMA Deviation long signal after a sharp flush below the EMA stack. Price is trading around 0.038–0.039, with all key timeframes (15m, 1H, 4H, 1D, 3D) in “Below / Oversold” state on my EMA Dev dashboard. Current 4H deviation is ~28%, above the historical oversold average (~26%), which fits my rules for a mean-reversion long. I am looking for a bounce back into the 4H EMA band and the nearest supply zone, where the previous distribution leg started. Technical context The downtrend from 0.055–0.056 pushed price under the 4H and 1D EMAs and into the lower ATR corridor. The last impulsive candle washed out local longs and expanded deviation to one of the highest readings in the current sample. Key levels on the chart: • Entry zone: 0.038–0.039 (current 4H demand / max negative deviation) • First target: 0.0485–0.0490 (4H EMA cluster + local supply) • Optional second target: 0.055–0.056 (prior breakdown area / 1D EMA region) • Invalidation: sustained 4H close below the spike low around 0.034–0.035 As usual with this strategy, I’m not trying to catch the exact bottom – the edge comes from entering when deviation is stretched and closing into the EMA / resistance band. Strategy stats (PLUME, 4H EMA Dev long) Backtest sample: 20 trades, long only. Winrate: 75%. Avg PnL per trade: +3.75%, avg winner +8.15%, avg loser −9.45% (win/loss ratio ~0.81). Largest winner +17.4%, largest loser −15.4%. Losing trades tend to last longer (≈62 bars) than winners (≈25 bars), so if price sits under EMAs too long without mean reversion, I prefer to cut rather than “marinate” in drawdown. Given the current ~28% negative deviation, the upside to the 4H EMA/supply (~+25–28%) is larger than the historical average winner, while downside to invalidation is kept near the typical loss profile. Fundamentals & narrative Plume is positioning as an RWA chain with a focus on compliant tokenized assets: CCTP V2 and native USDC are now live on Plume, enabling smoother cross-chain liquidity flows. Nest Protocol is relaunching on Plume using Pendle-style mechanics with TVL in the hundreds of millions, supporting the yield/RWA narrative. There is active collaboration with Circle (CCTP + USDC workshop) and a growing stack of institutional RWA products (WisdomTree funds, Galaxy allocation, prior SEC transfer-agent registration, etc.), although some of those catalysts are already “spent” in the short term. Main overhang: an upcoming unlock of ~239.65M PLUME (~2.4% of supply) on 21 December, which can cap the upside if spot demand doesn’t keep up. My fundamental score here is around BBB+ – constructive RWA + USDC story, but with clear unlock risk. Trade plan Base case: fade the current oversold deviation on 4H, ride the move back into 0.048–0.049, and optionally trail a small remainder toward 0.055–0.056 if momentum and flows improve. If price fails to bounce and closes 4H below 0.034–0.035, I consider the EMA Dev setup invalid for now and step aside until a new deviation cluster forms. Not financial advice – this is a systematic mean-reversion long based on my EMA Deviation framework plus the current RWA / USDC catalysts on Plume.
Goldfinch_song
Long from accumulation range: targets 1.50 → 2.35 (Weekly FVG)
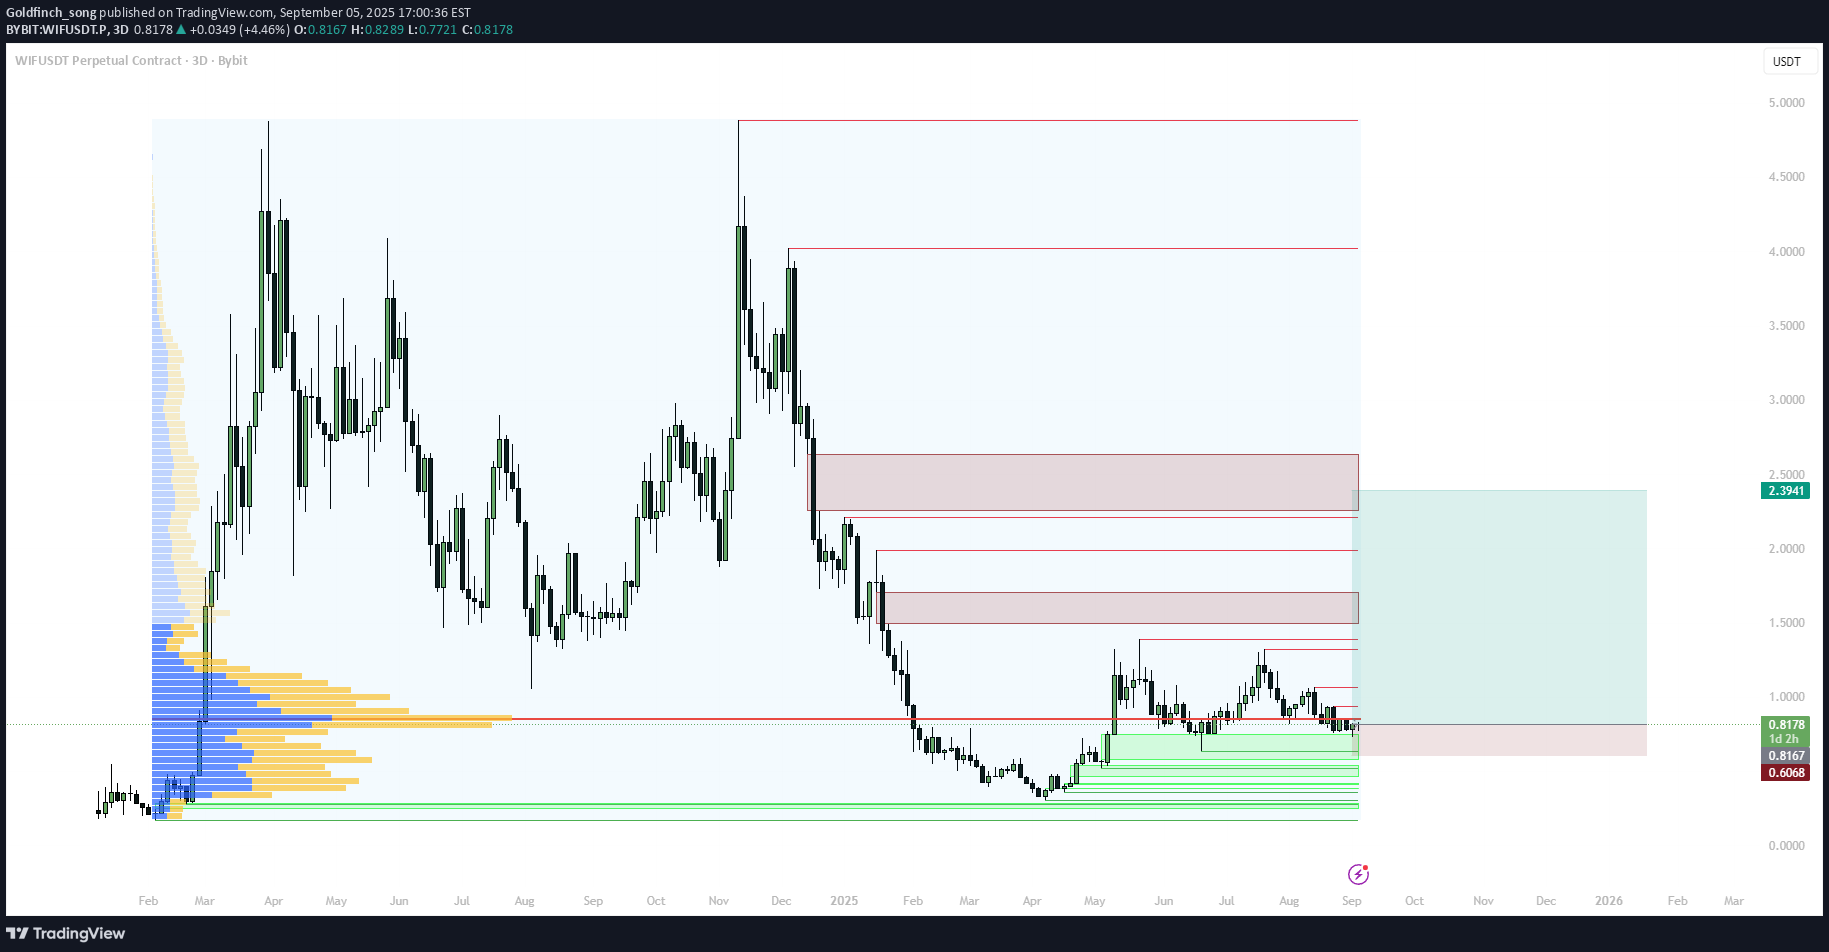
Price is sitting at the upper edge of the 0.78–0.83 accumulation. Above, unfilled FVG clusters on D1/W1 act as magnets; the first target is 1.50, then 2.00–2.35 (Weekly FVG). VPVR shows the main volume base at 0.70–0.83. Idea Counter-trend long from range support with base R/R ≈ 3.7. Expectation: liquidity sweep to the upside and FVG fills. Trade Plan (laddered limits) Entries: 0.820 (40%), 0.780 (30%), 0.650 (30%) Hard stop (invalidation): 0.611 TP1: 1.500 (take 50%) TP2: 2.350 (leave 50%) Risk / Reward Max risk to stop: −23.63% from 0.800 → 0.611. Upside: +87.5% to 1.50 and +193.8% to 2.35. Base R/R ≈ 3.7. Management After 1.00–1.05, move stop to breakeven (avg entry). After TP1, trail under the latest H4/D1 HL and hold for the Weekly FVG 2.00–2.35. Key Levels Support: 0.83 / 0.78 / 0.72–0.70 / 0.65 Resistance: 1.00 / 1.20–1.35 / 1.50 / 1.95 / 2.35 Confirmation Triggers H4/D1 close above 0.90–1.00 (fresh HH) Impulsive move from 0.78–0.83 with volume and absorption of the last bearish block Alternative (bearish) Clean break and acceptance below 0.611 cancels the idea; wait for a new base/re-accumulation. Risks Meme coins are prone to sharp liquidity flushes; use strict position sizing and respect the stop.
Goldfinch_song
Reload at $0.40, ride the trend toward $0.90–$1.20
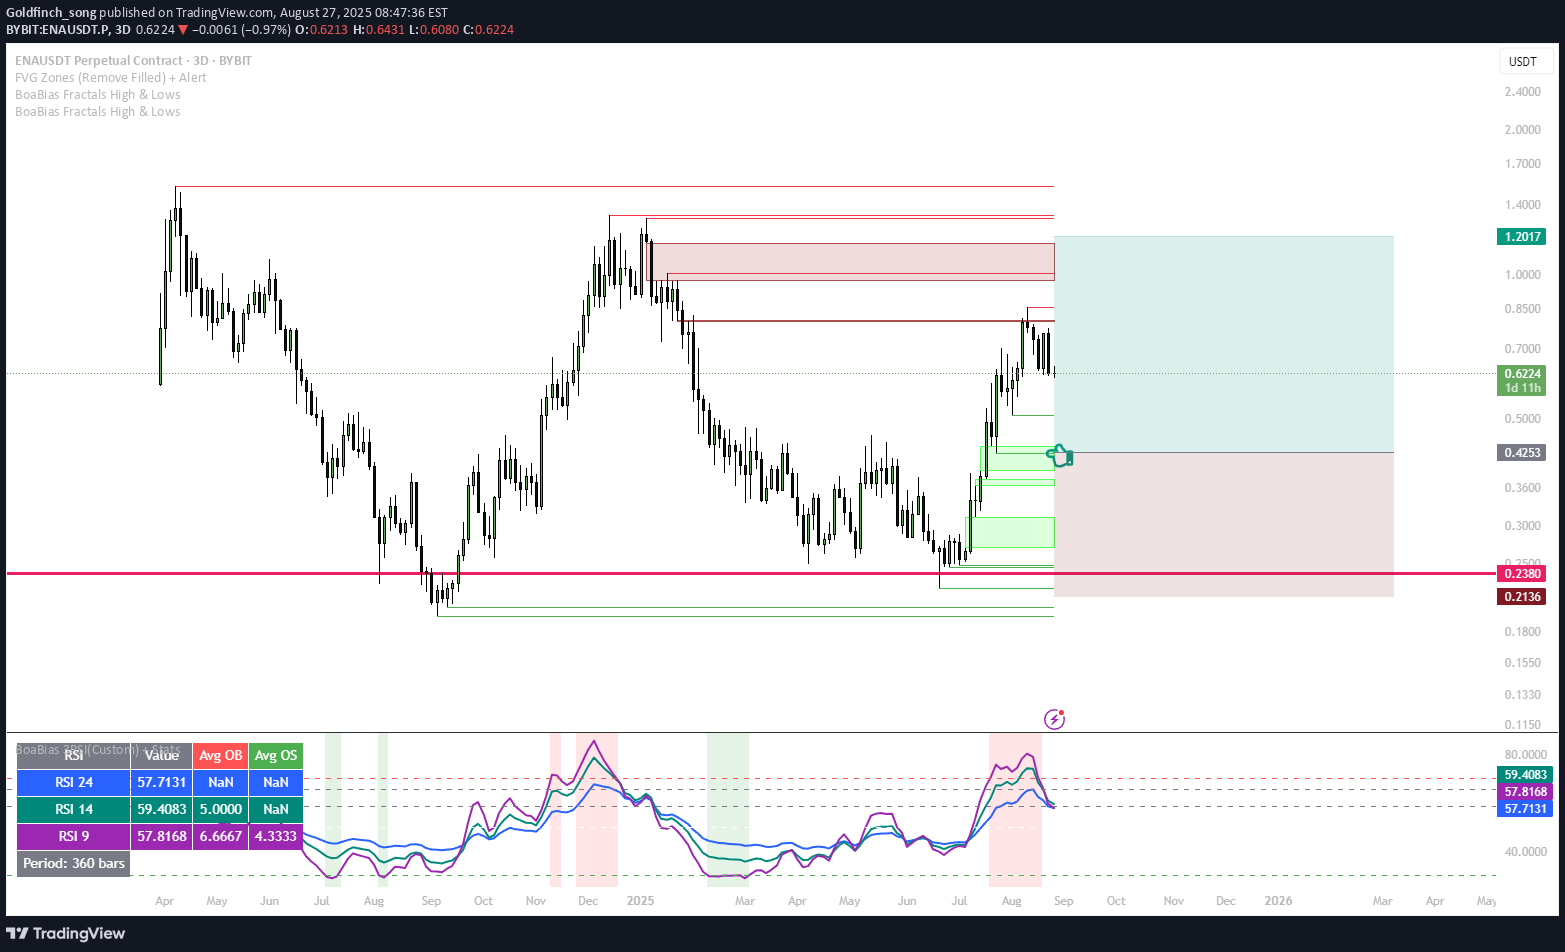
ENA is tracking a higher-timeframe bullish structure while eyeing a deep retest at $0.40. That zone aligns with prior demand and alert levels from the author. The monthly support / invalidation sits at ~$0.238 — a break below would negate the idea. Trade Plan (Swing) Entry: $0.4000 (limit; consider a ladder $0.415 → $0.400 → $0.385) Stop (hard): $0.2380 (monthly break) → −40.50% Targets: TP1: $0.70 (+75.0%) — partials/stop to BE TP2: $0.90 (+125.0%) — main take TP3 (stretch): $1.20 (+200.0%) Baseline R:R: ~3.09 : 1 (0.40 → 0.90 vs. 0.238) Scenarios A) Preferred — Deep Retest & Reversal at $0.40 Trigger: Wick into $0.41–$0.39 with H4/W1 SFP/BOS + reclaim of $0.40. Execution: Fill ladder; add on reclaim > $0.40 (flip to support). Invalidation: Daily/Weekly close < $0.238 (monthly level lost). Tighten if H4 structure fails repeatedly below $0.39. B) Shallow Pullback, Continuation Above $0.40 Trigger: Hold >$0.40 without a deep tag; higher lows on H4. Execution: Buy on retest $0.40–$0.41 with confirmation (LL→HL shift). Invalidation: H4 acceptance < $0.40 (failed flip); hard stop unchanged $0.238. Smart Money View Setup resembles a “deep reload” into demand before expansion. If $0.40 holds and flips, the draw favors inefficiency fills toward $0.70 → $0.90, with $1.20 as extension once weekly momentum compounds. Risk & Management Size down to respect the HTF stop distance; ladder entries to improve average. After TP1 $0.70, move stop to break-even and trail below fresh higher lows on H4/D1. Avoid chasing mid-range between $0.45–$0.65 without a clean pullback or structure break.
Goldfinch_song
Sweep-&-Reclaim at Range High
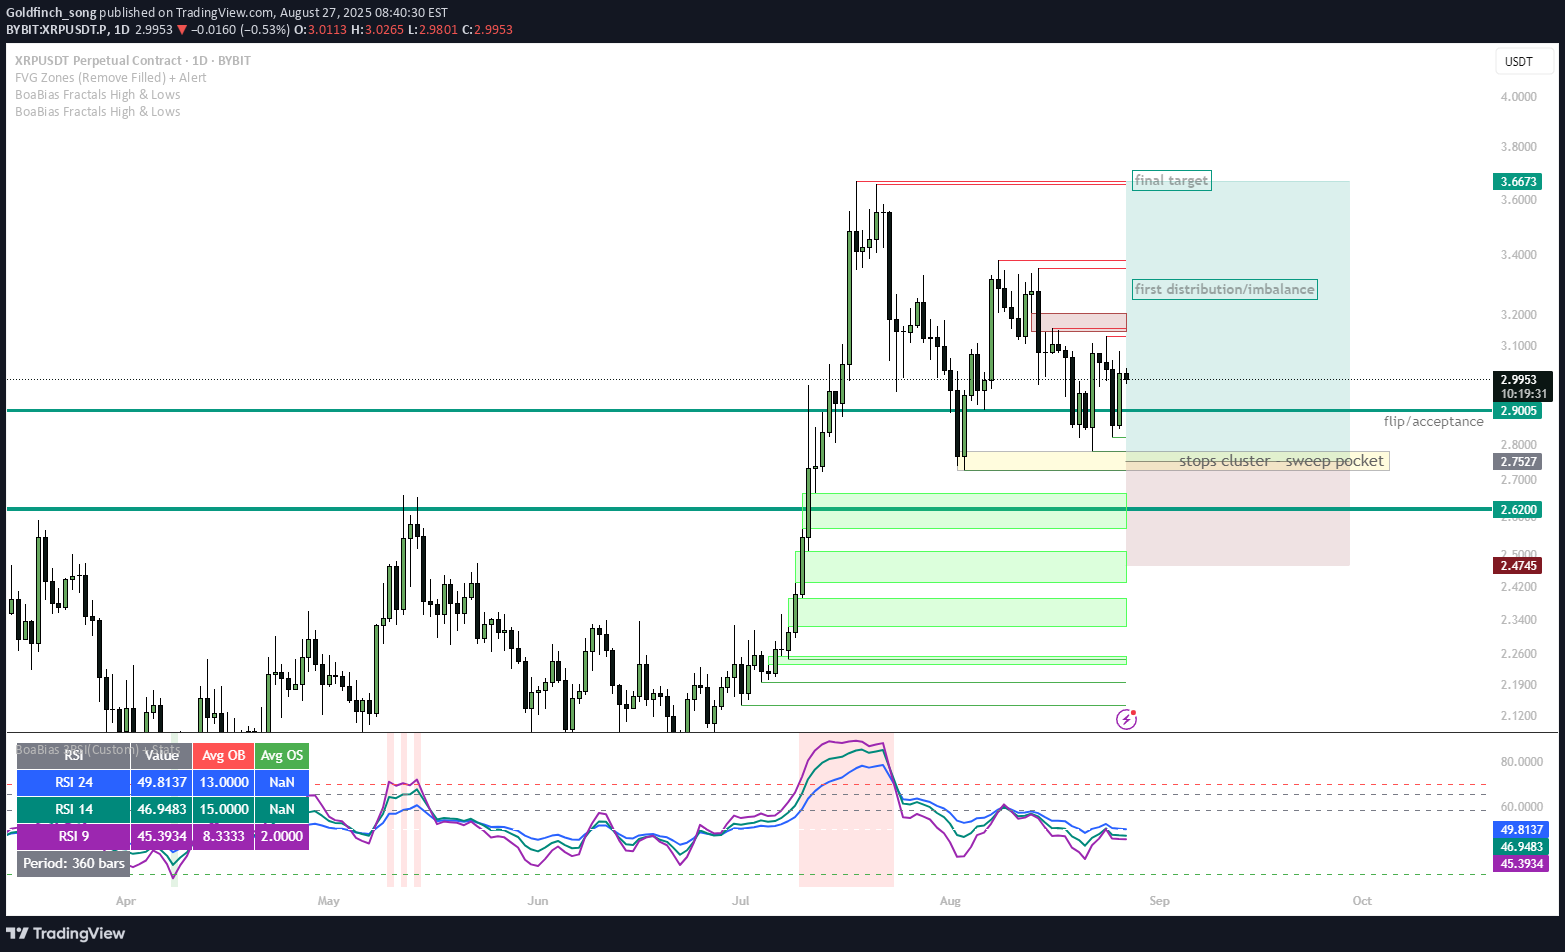
XRP is holding the upper third of the range with liquidity building on both sides. Classic SMC setup: sweep the inside of the range → reclaim → trend continuation upward. Confluence from author view: strenSetup & Levels Entry idea: $2.70-2.80 (limit after reclaim) Stop: $2.62 (below range low/liquidity pocket) → -9.66% Target: $3.70 → +33.59% R:R: ~3.29 : 1 Decision/Flip zone: prior range high / reclaim line around $2.90 Liquidity pools: equal lows cluster below $2.70–$2.62, resting buys above $3.30–$3.50 into $3.70 Scenarios A) Sweep & Reclaim (Preferred) Trigger: Wick below the mid/inner range (ideally toward $2.80–$2.75), H1/H4 SFP + close back above $2.90 (acceptance). Execution: Buy the reclaim > $2.90 or first retest of $2.90 as support. Targets: TP1: $3.25–$3.35 (range mid/imbalance fill)** — reduce 30–50% TP2: $3.70 (range high extension) Invalidation: H4 close back below $2.90 after reclaim (failed acceptance) or hard stop $2.62. B) Direct Continuation from $2.90 Trigger: Clean H1/H4 hold above $2.90 without deep sweep. Execution: Limit at $2.90–$2.93 with tight risk to plan stop. Targets: Same as A (TP1 $3.25–$3.35, TP2 $3.70). Invalidation: H4 close < $2.90 (acceptance lost) or hard stop $2.62. Bearish Invalidation Scenario Daily close < $2.62 = range demand lost → idea invalid. Stand aside and reassess lower liquidity magnets. Risk Management Move stop to BE on break-and-hold >$3.25 or after TP1 hit. If entry comes after a deep sweep, allow for one retest of the flip before tightening stops. Avoid chasing mid-range; wait for acceptance signals, not just wicks. Smart Money View Purposeful liquidity take below intra-range lows to fuel a reclaim bid. Equal lows near the stop zone invite the sweep; equal highs overhead (into $3.70) offer the draw.gth into alt rotation once majors resolve.
Goldfinch_song
Breakout > $112,000 or Demand Reload $107,000–$104,000
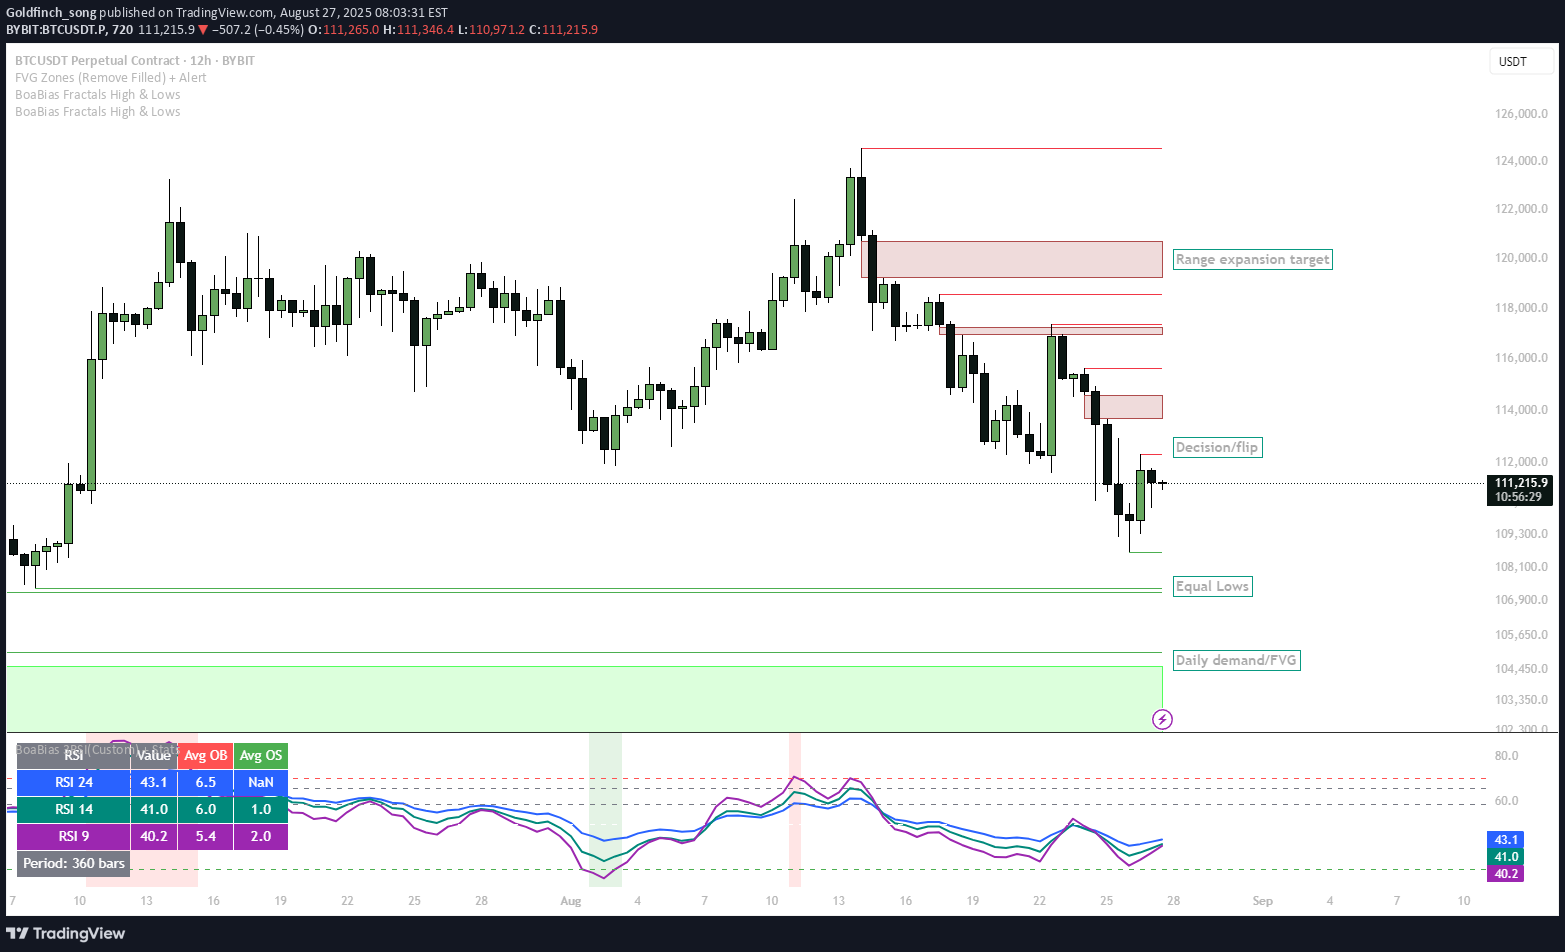
BTC is compressing below the decision level at $112,000. Liquidity is stacked at Equal Highs $112,300–$113,700 and Equal Lows near $107,000, with a daily demand/FVG around $104,000. Expect a quick liquidity sweep before direction is chosen. Trade Plan Scenario A — Breakout Long (> $112,300-112,700) Trigger: H1/H4 close above $112,700 with acceptance (no immediate reclaim back below $112,300). Entry: Stop-limit on confirmation or on the first clean retest of $112,000 as support (flip). Targets: • TP2: $115,000+ (range expansion) Invalidation: H4 close back below $112,000 after the flip (failed breakout). Conservative hard invalidation: daily close < $111,500. Scenario B — Demand Long ($107,000–$104,000) Trigger: Sweep/visit of $107,000 into $104,000 FVG/demand, then bullish reversal signal on H1/H4 (SFP, BOS + retest). Entry: Ladder limits $107,000 → $104,000. Invalidation: Daily close below $104,000 (demand lost). Tighter option: H4 close < $102,156. Positioning & Risk Split size 50/50 across scenarios (breakout vs. reload) or use conditional orders. Move stops to BE after TP1 or once $112,000 holds as support. Expect wicks: allow for confirmation; avoid chasing mid-range.
Disclaimer
Any content and materials included in Sahmeto's website and official communication channels are a compilation of personal opinions and analyses and are not binding. They do not constitute any recommendation for buying, selling, entering or exiting the stock market and cryptocurrency market. Also, all news and analyses included in the website and channels are merely republished information from official and unofficial domestic and foreign sources, and it is obvious that users of the said content are responsible for following up and ensuring the authenticity and accuracy of the materials. Therefore, while disclaiming responsibility, it is declared that the responsibility for any decision-making, action, and potential profit and loss in the capital market and cryptocurrency market lies with the trader.