
GoldFxMinds
@t_GoldFxMinds

What symbols does the trader recommend buying?
Purchase History
پیام های تریدر
Filter
GoldFxMinds
Gold H1 — Buyers Reload Below, Sellers Lurk Above
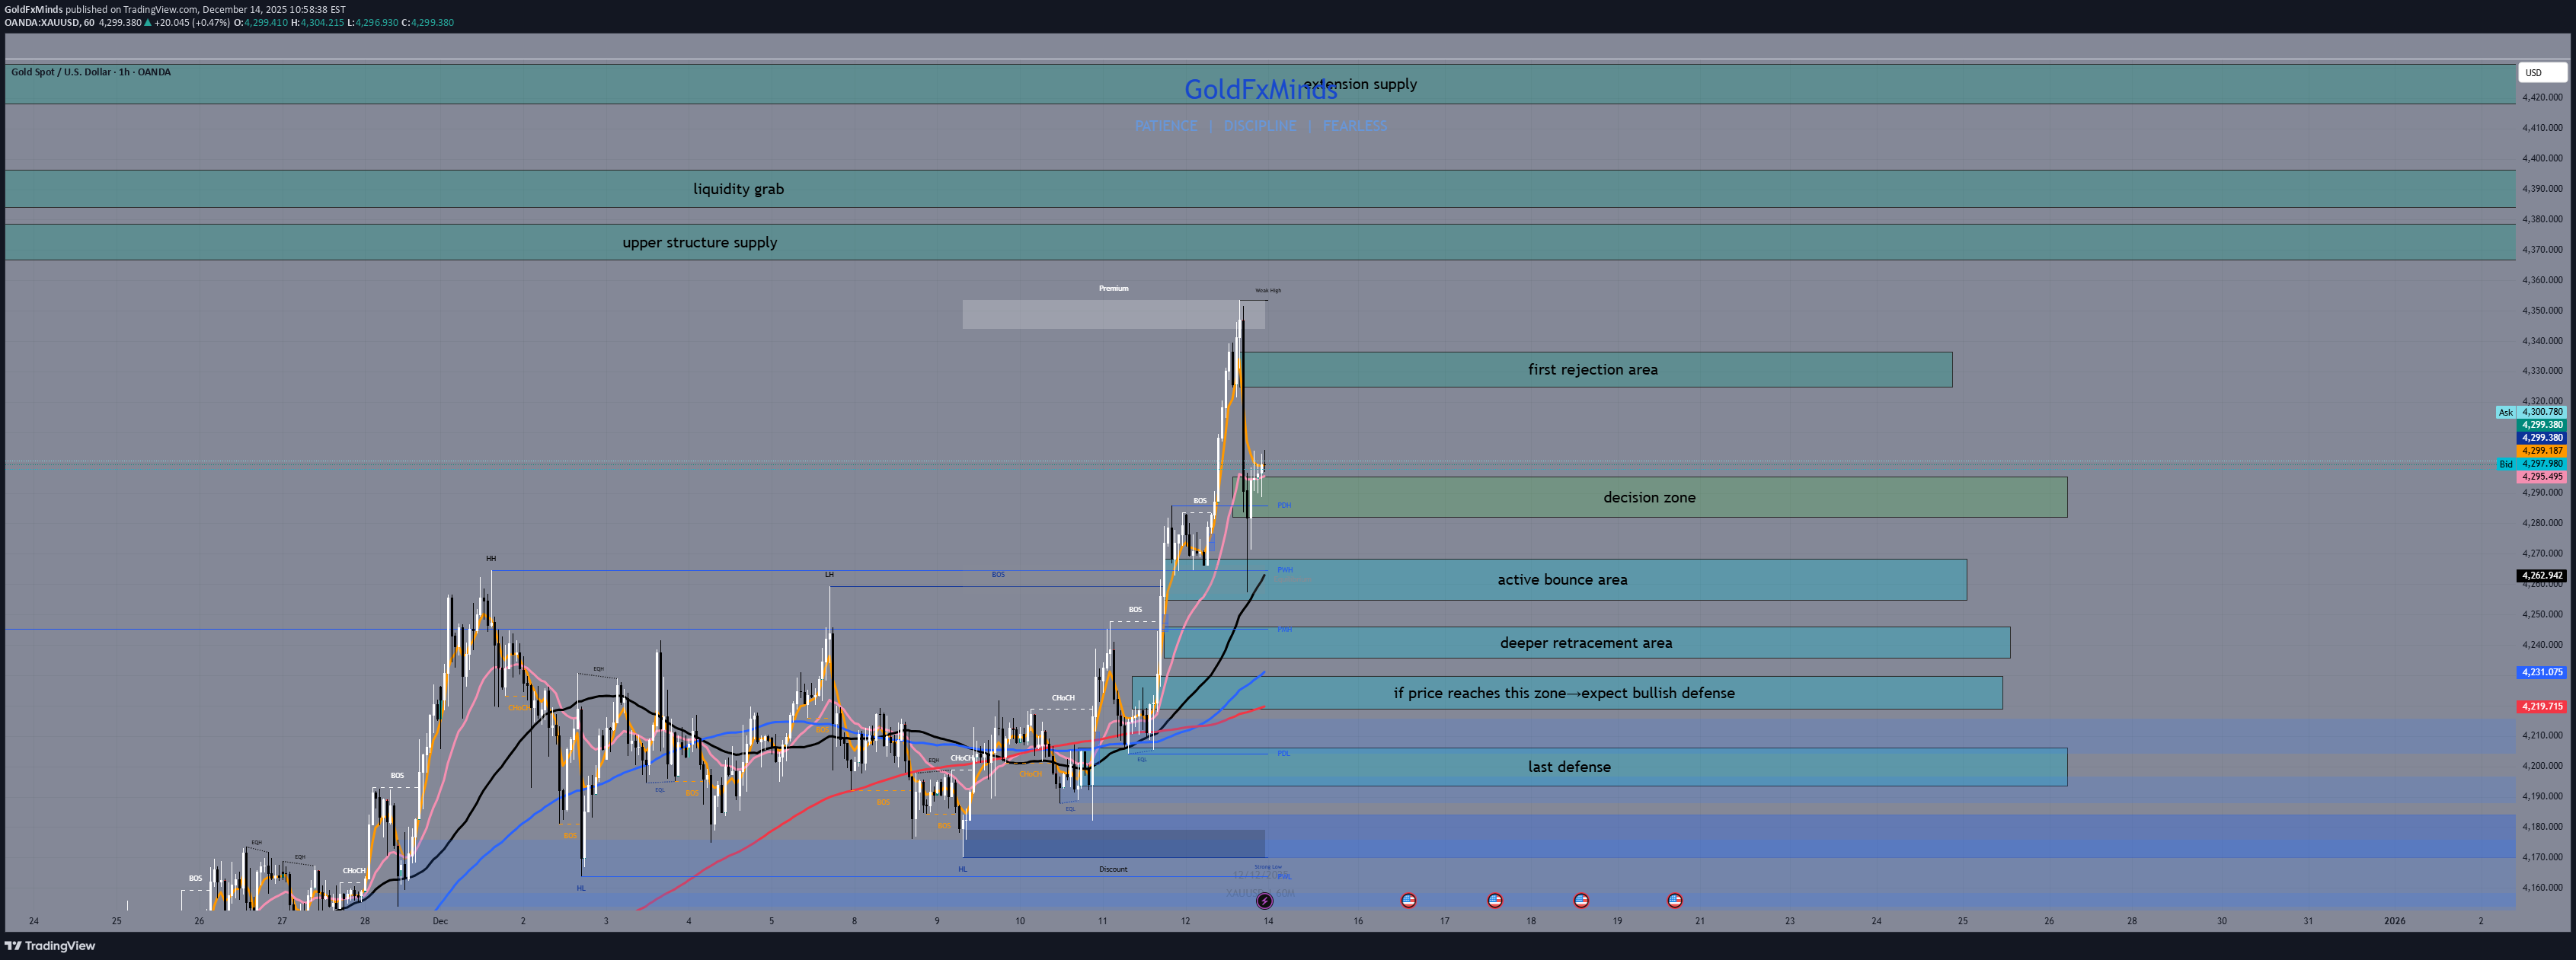
Hey traders, On the H1 chart, gold is still holding a bullish structure, but the market is clearly transitioning from impulse into reaction. The strong move from the lows already happened, and price is now sensitive to intraday supply while still respecting value below. This is no longer a market for chasing breakouts. It’s a market where levels matter more than speed. H1 Context After the last bullish impulse, price moved well above the short-term EMAs. That confirms strength, but also tells us that upside progress will likely come in steps, not in straight lines. Fibonacci retracement aligns with the EMAs below, defining clear buy zones, while structure and inefficiencies above define where selling pressure can appear. ⚪ H1 Decision Zone 4285 – 4295 This is the real decision area on H1. Here, price has slowed down and overlapped. This is where the market pauses and decides whether it has enough strength to continue higher or whether it needs to rotate lower first. Inside this zone, patience is key. A clean move away from it defines the next intraday leg. 🟦 H1 Buy Zones 4254 – 4268 | Bounce buy zone This zone already delivered a clean reaction. It aligns with the equilibrium of the last move and with the rising EMAs. If the structure remains bullish, buyers should be willing to defend this area again. 4234 – 4246 | Pullback buy zone A deeper retracement where the correction becomes clearer but still constructive. This zone often acts as a reload area before another attempt higher. 4218 – 4230 | Main pullback buy zone This is the core value area on H1. If price reaches this zone, the market is properly rebalancing the move. Buyers need to step in here to keep the intraday structure intact. 4194 – 4206 | Deep pullback buy zone This is the last buy area on H1. Below this zone, the bullish intraday structure starts to weaken. 🟥 H1 Sell Zones 4325 – 4335 | First rejection area This is the first intraday supply above price. Here, buying pressure can start to fade and the market may show its first signs of weakness. Best used for first rejection, not aggressive selling. 4366 – 4378 | Upper structure supply This zone is still part of the H1 structure. Price can stall or reject here without being overextended. Good area to watch for loss of momentum and failed continuation. 4384 – 4396 | Liquidity grab zone Above structure highs, stops are exposed. Spikes into this area are often fast and emotional, with higher rejection risk. Bullish Scenario If price holds above the 4285 – 4295 decision zone, the bullish scenario remains active. In that case: first upside test is 4325 – 4335 acceptance above that opens the door toward 4366 – 4378 further extension can reach 4384 – 4396, but momentum quality matters Bearish Scenario If price fails to hold the 4285 – 4295 decision zone, the market shifts into pullback mode. In that case: first reaction is expected at 4254 – 4268 deeper pullback can reach 4234 – 4246 stronger correction targets 4218 – 4230, with 4194 – 4206 as the last intraday defense As long as price holds above the deep buy zone, this remains a correction within a bullish structure. Final Thought On H1, gold is about progression, not prediction. Buy when price returns to value. Sell as price steps into layered supply. And when price sits in the decision zone, wait. Which supply do you think gets the reaction first: first rejection or upper structure? Drop your thoughts below and follow GoldFxMinds for clean intraday maps and disciplined execution.
GoldFxMinds
Gold – H4 Outlook | Continuation or Pullback
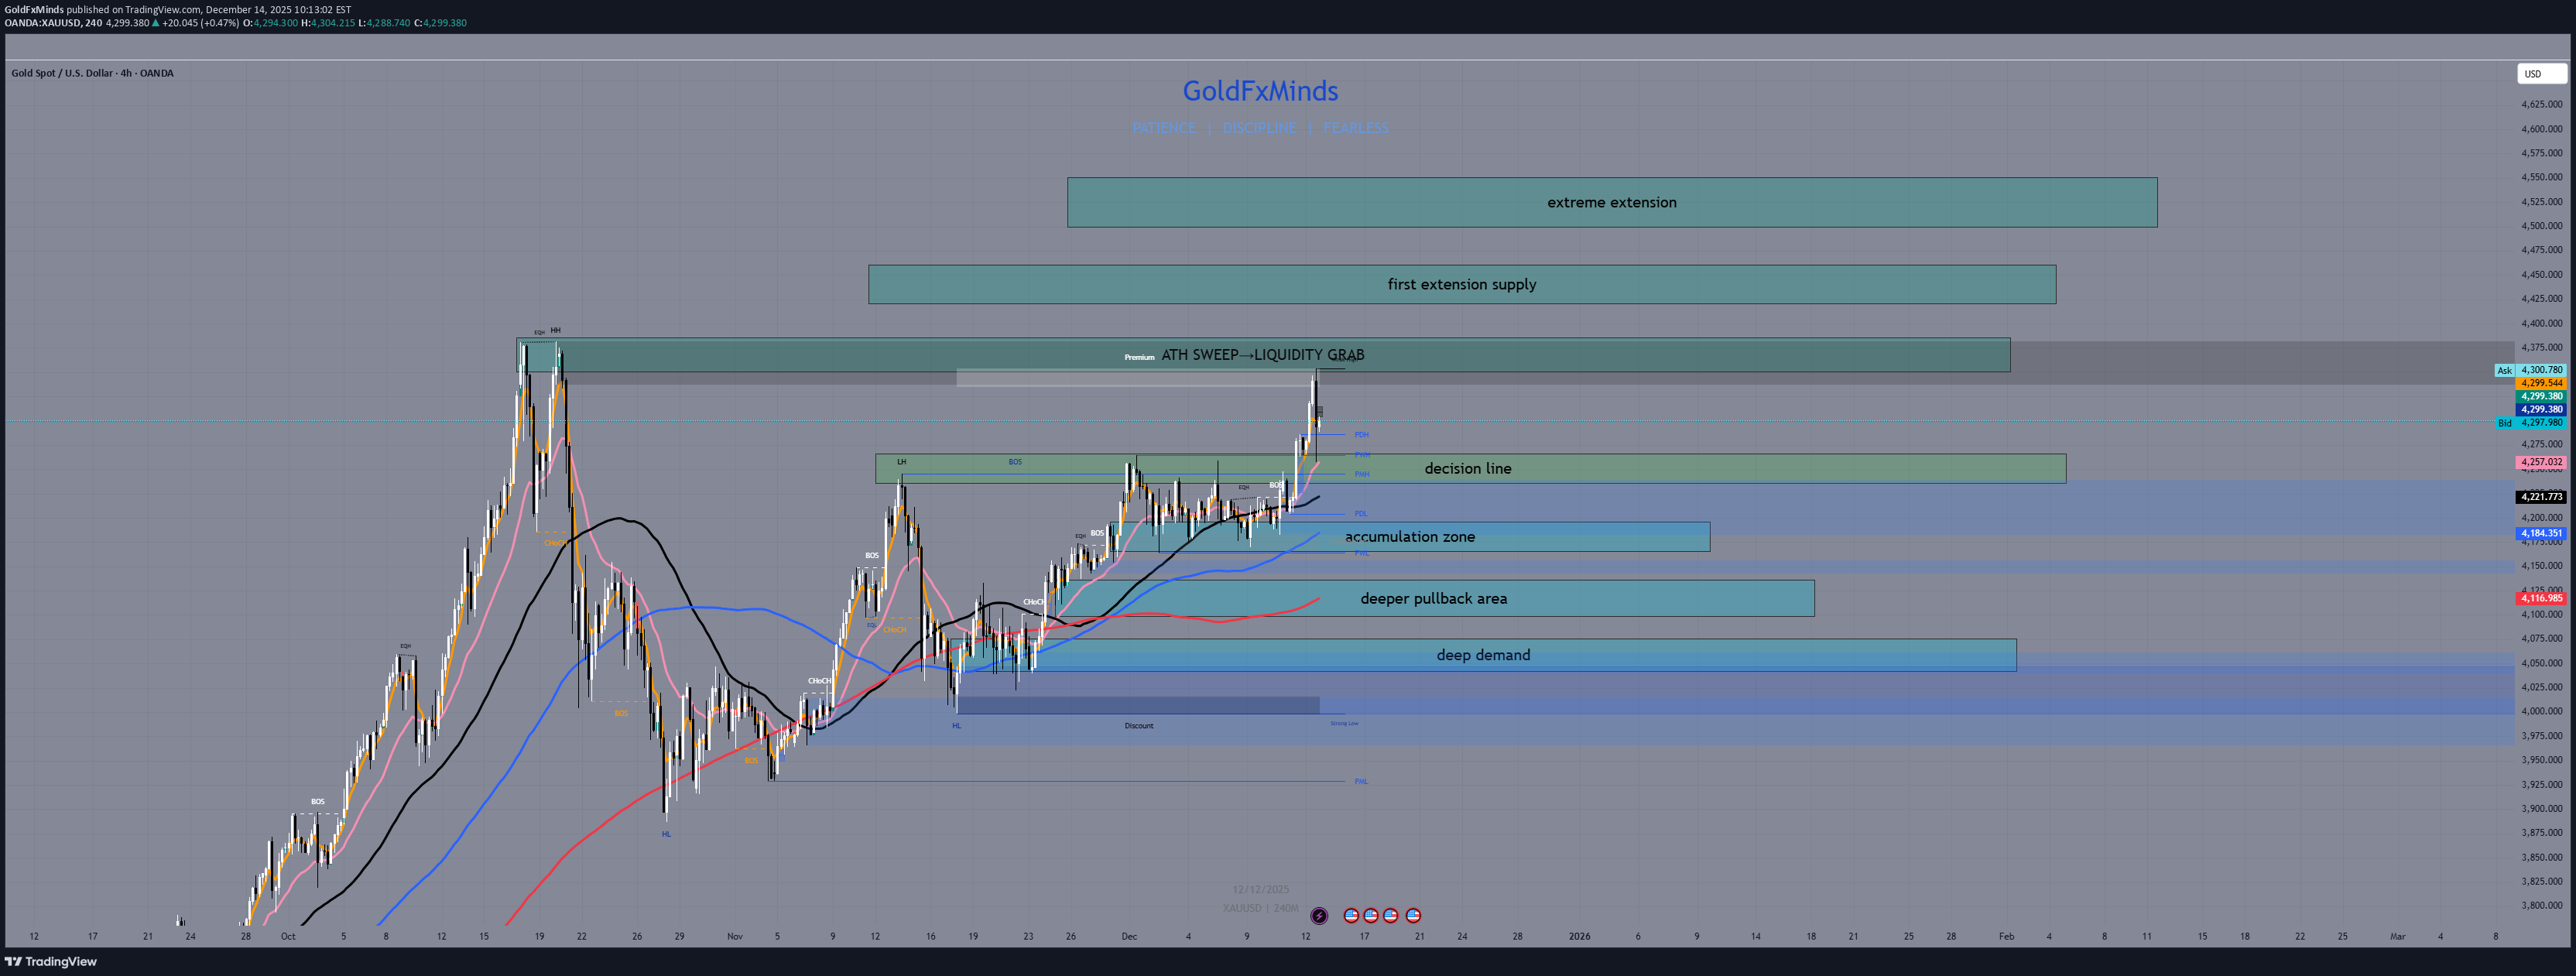
Hey traders, On the H4 chart, gold has already delivered a strong bullish move. The impulse from 4000 to 4355 is complete, and price is no longer pushing higher in a clean way. Instead, the market is slowing down, reacting more often, and starting to rotate. This is not a bearish market. But it is also not a market to chase. From here, price has two clear options: either it continues higher, or it pulls back to build value again. H4 Context The overall structure remains bullish. Higher highs and higher lows are still intact, and there is no structural break on H4. However, price is already far from the base of the last impulse. That means: buying high carries more risk selling only makes sense near extremes the middle is a waiting area At this stage, location matters more than direction. ⚪ Decision Zone 4235 – 4265 | Decision This is the key area on the H4 chart. If price holds above this zone, the market keeps the door open for continuation If price breaks below this zone, the market shifts into pullback mode H4 closes around this area are what matter, not quick spikes. This zone decides whether gold pushes higher first or corrects lower first. 🟦 H4 Buy Zones If price moves below the decision zone, these are the areas where buying starts to make sense again within a bullish structure. 4165 – 4195 | Accumulation This is the first buy zone. Price can slow down here and build a base. If the trend is strong, buyers should defend this area and prevent a deeper pullback. 4100 – 4135 | Pullback This is the main correction zone on H4. A move into this area is normal after the last impulse and does not damage the trend. This is where continuation is often rebuilt. 4045 – 4075 | Deep pullback This is the last buy zone on H4. If price reaches this area, the market is correcting deeply, but the bullish structure can still survive. Below this zone, the structure starts to weaken. 🟥 H4 Sell Zones On H4, selling only makes sense at clear extremes. 4350 – 4385 | ATH sweep This is the area above the highs where stops sit. Fast spikes and emotional buying often happen here, followed by hesitation or rejection. 4420 – 4460 | Extension trap Price is stretched in this zone. Breakouts here often fail if there is no strong follow-through. 4500 – 4550 | Extreme extension This is a very stretched area. If price reaches this zone, the market is no longer trending cleanly and is likely distributing. Bullish Scenario The bullish scenario stays valid as long as price holds above the decision zone. If gold stays above 4235 – 4265, the market can attempt another push higher. The first area to watch is 4350 – 4385. A clean break above that zone can lead to higher extensions, but those moves would already be late-stage. Continuation requires holding above the decision zone, not just quick wicks. Bearish Scenario The bearish scenario activates only if price breaks below the decision zone. A break below 4235 – 4265 shifts the market into pullback mode: first reaction area is 4165 – 4195 if that fails, price can move toward 4100 – 4135 a deeper correction can reach 4045 – 4075 As long as price holds above 4045, this remains a pullback, not a trend reversal. Final Thought Gold is still bullish on H4, but this phase is not about prediction. It’s about waiting for price to come into the right areas and reacting there. Buy lower. Sell higher. Wait in between. What do you think: continuation above the decision zone, or pullback into accumulation first? Drop your thoughts below 👇, follow GoldFxMinds for more clean H4 outlooks, and let’s read the market together. 🚀✨
GoldFxMinds
Gold – Daily Outlook (D1) | Trend Up, But Liquidity Is Building
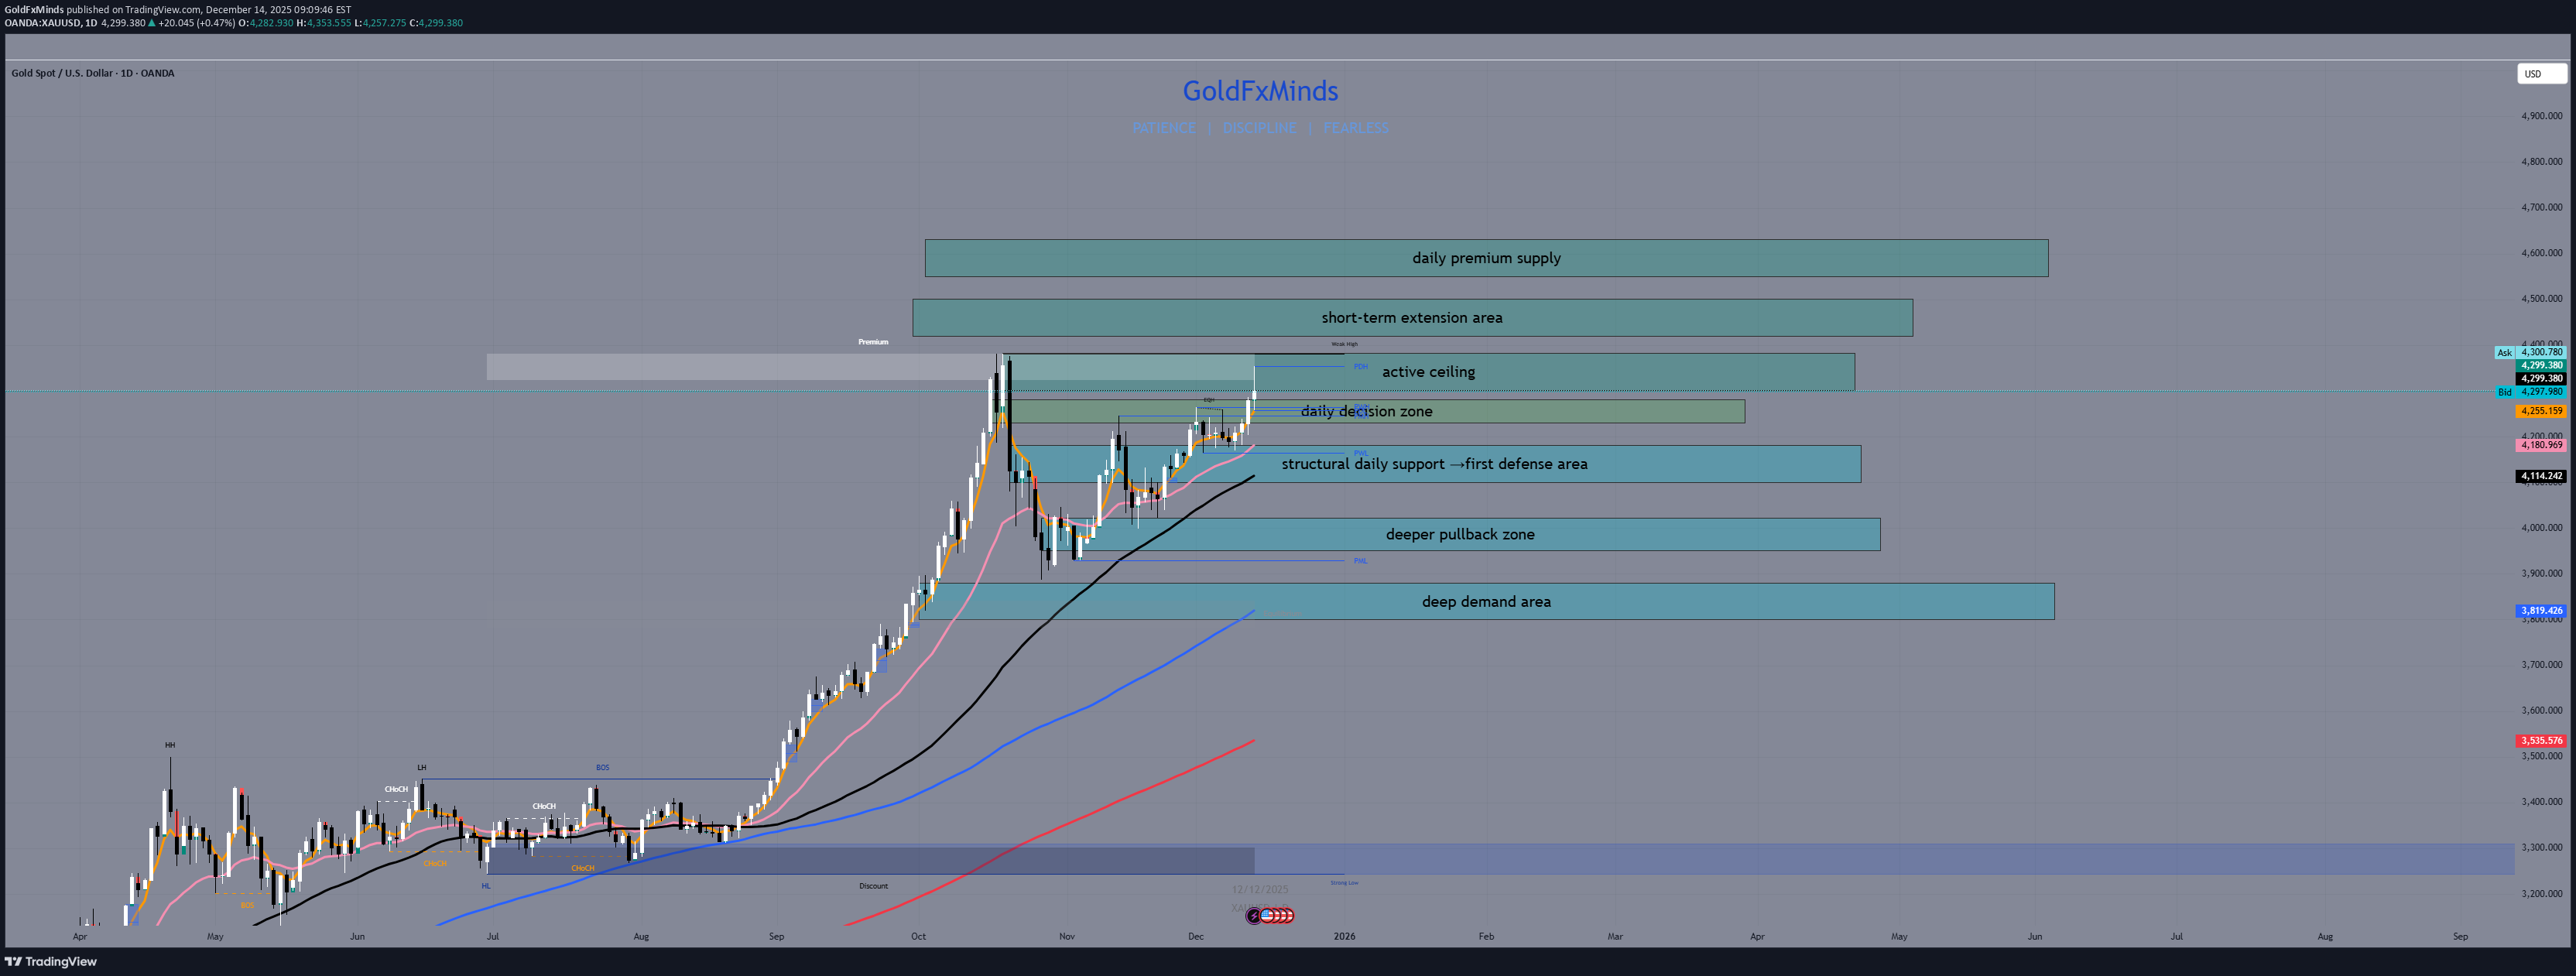
Hey traders, On the daily chart, gold remains in a clear uptrend. Structure is intact, but the character of price has changed. Moves higher are slower, candles hesitate more, and reactions appear faster. This usually tells us one thing: liquidity is building. Daily Bias Bias stays bullish, as long as daily structure holds. Higher highs and higher lows are still respected. No daily close has flipped the structure bearish. However, price is stretched. From here, continuation is possible — but only if buyers manage liquidity correctly. Otherwise, the market looks for a reset. 🟥 Daily Zones Above – Where Exhaustion & Traps Can Appear 4300 – 4380 | Daily Exhaustion Area Price is already reacting here. Smaller candles and hesitation suggest buying pressure is thinning. This is where late buyers often get trapped if acceptance fails. 4420 – 4500 | Buy-Side Liquidity Area Above the current highs, liquidity is sitting. If price pushes here, expect stop runs and sharp reactions rather than clean continuation. 4550 – 4630 | Extension Trap Zone If price reaches this area, the move is late-stage. This is where upside extensions often turn into traps and fast reversals. 🟦 Daily Zones Below – Where Pullbacks Can Settle 4180 – 4100 | Shallow Pullback Zone A controlled pullback into this area keeps the daily trend clean. This is where buyers are expected to defend structure. 4020 – 3950 | Deep Pullback Zone A move here signals momentum cooling. Structure can still hold, but the market clearly needs time to rebalance. 3880 – 3800 | Sell-Side Liquidity Zone Below this area, sell-side liquidity is exposed. If price trades here, the daily trend is under serious pressure. ⚪ Daily Decision Zone 4230 – 4280 | Daily Imbalance Area This is where daily control shifts. Holding above → buyers absorb selling pressure Losing it → imbalance resolves lower toward pullback zones Daily closes around this area matter far more than intraday noise. Bullish Scenario If price holds above the imbalance area and buyers manage to absorb selling near the exhaustion zone, continuation remains possible — but it will likely be slow and tactical, not impulsive. Bearish Scenario If price fails to hold the imbalance area, the market starts correcting inefficiencies. A pullback toward the shallow or deep pullback zones becomes the natural path. This remains corrective unless sell-side liquidity is fully taken. Final Thought Gold is still trending higher. But right now, the market is more interested in liquidity and balance than speed. At this stage, waiting for price to show its hand is often the best trade. Are you seeing continuation — or signs of exhaustion? Drop your thoughts below 👇, follow GoldFxMinds for clean daily structure, and let’s trade what price does, not what we hope. ✨
GoldFxMinds
GOLD – Weekly Outlook | A Real Decision at the Highs
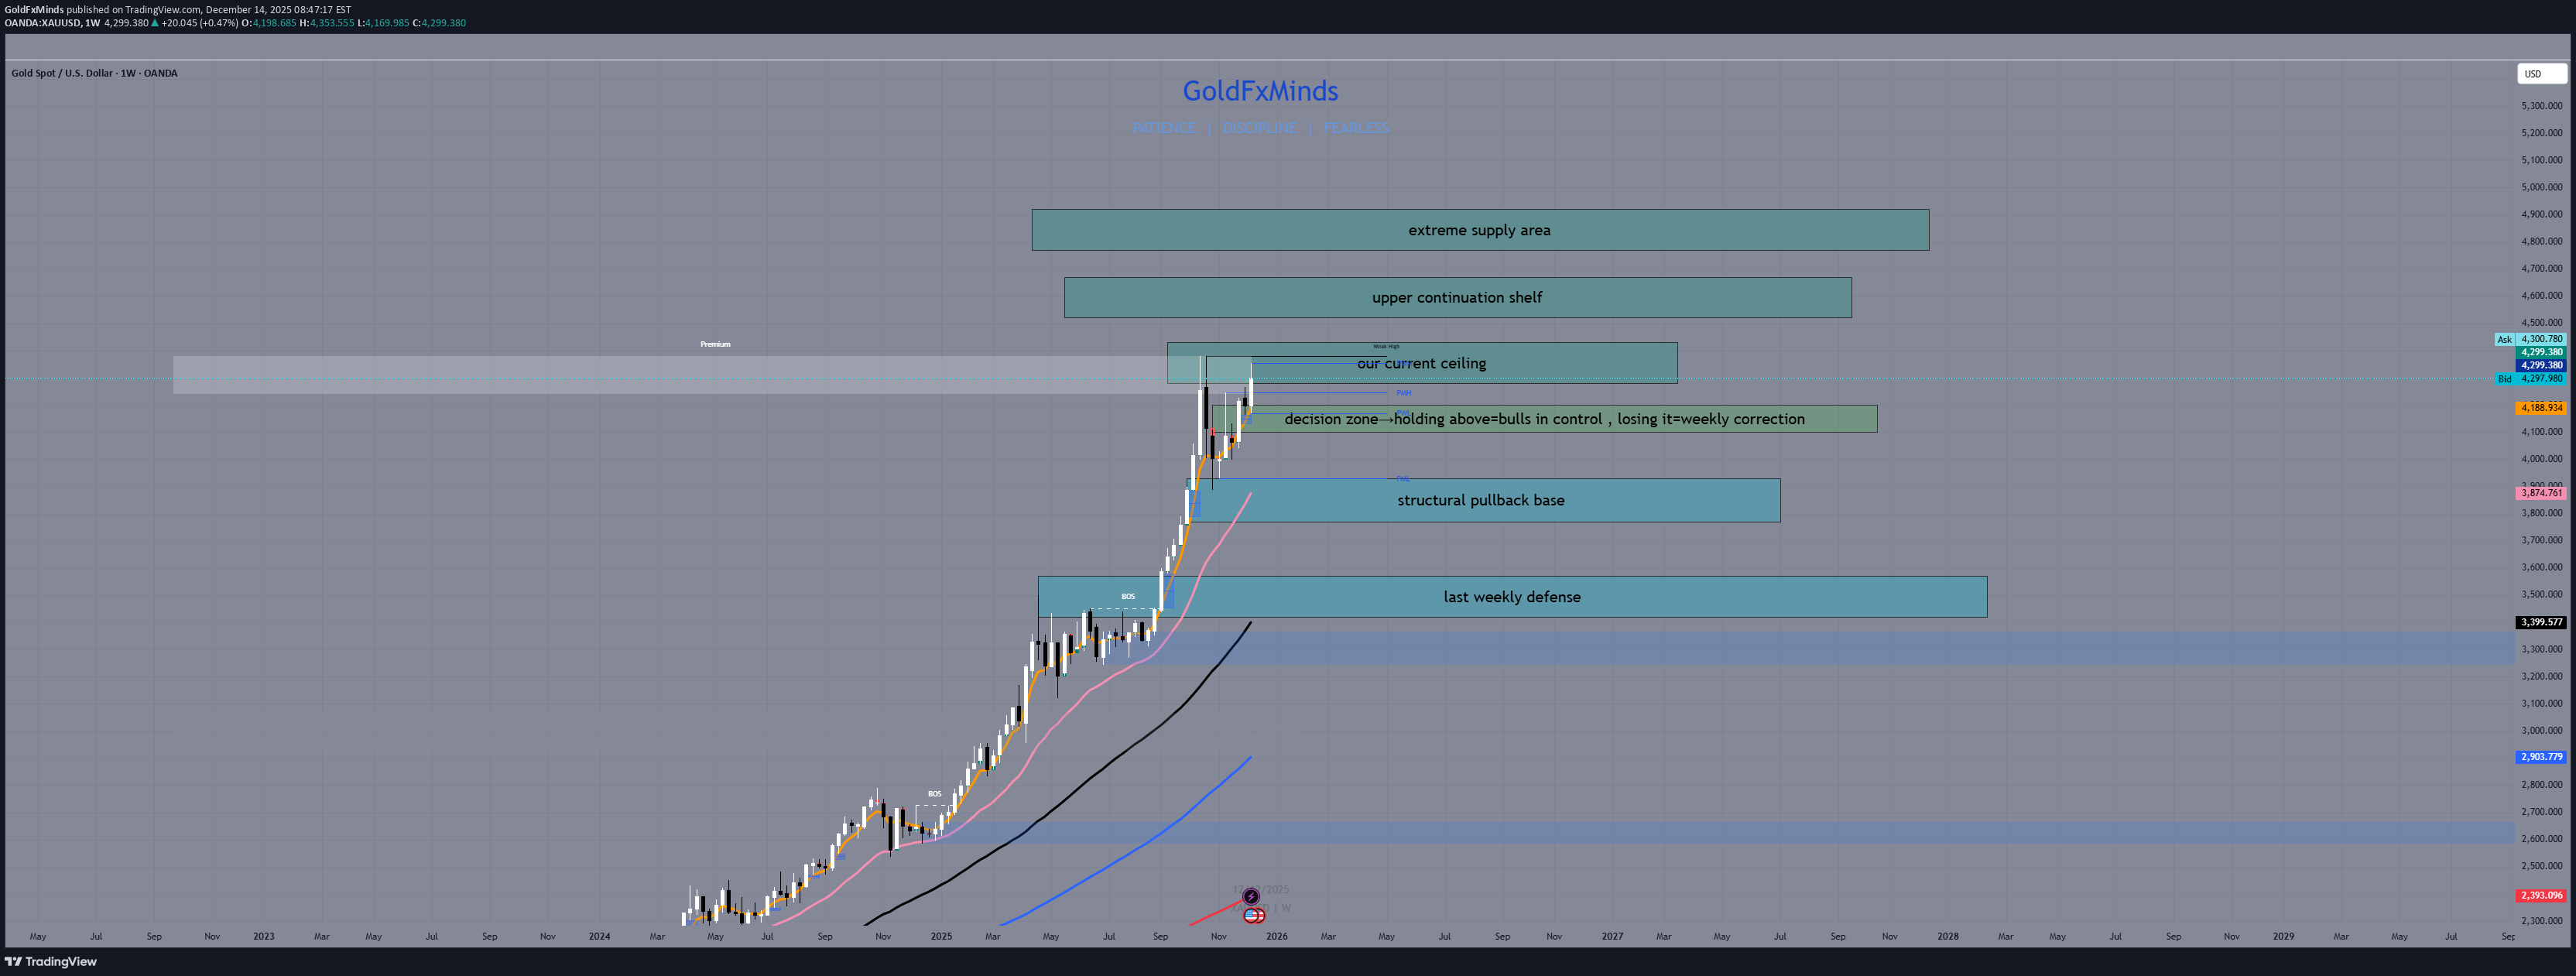
Hello traders, Gold opens the new week holding firm at elevated prices. The weekly trend is still bullish, but price is no longer in expansion mode. The pace has slowed, candles are compressing, and the market is clearly negotiating value at the top of the range. This week is not about chasing direction. It’s about how price reacts at a critical weekly level. Macro Context 🌍 This week is driven by USD data tied to consumption and the labor market. Key releases: Retail Sales (headline & core) ADP Employment Change Unemployment Claims & Unemployment Rate Manufacturing & Services PMIs Consumer Sentiment There is no Fed decision and no Powell. Without a central-bank catalyst, the macro backdrop favors reaction, digestion, and range behavior, especially with gold already trading in premium. Weekly Bias📝 The bias remains bullish, but conditional. Weekly structure still shows higher highs and higher lows. There is no bearish weekly break of structure. At the same time, price is stretched and momentum is slowing. Continuation requires acceptance above current levels — otherwise, the market naturally seeks balance lower. 🟥 Weekly Supply Zones 4280 – 4430 This is the first major weekly supply area. Price is already reacting here with hesitation and upper wicks. This zone decides whether continuation is possible or capped. 4520 – 4670 If buyers manage acceptance above the first supply, this is the next upside reaction area. Momentum is likely to slow again here. 4770 – 4920 Extreme premium. If price reaches this zone, the market enters a higher-risk phase where distribution becomes more likely. 🟦 Weekly Support Zones 3920 – 3770 Primary weekly support and the backbone of the current bullish leg. A pullback into this zone would still be healthy. 3570 – 3420 Deeper structural support. Losing this area would signal that the weekly trend is no longer in control. ⚪ Weekly Decision Zone 4100 – 4200 This is the weekly pivot. Holding above keeps the bullish structure intact Losing it opens the door for a broader corrective move toward support Everything this week rotates around this zone. Bullish Scenario If gold holds above the decision zone and starts accepting above the first supply, upside continuation remains valid. The move higher is likely to be measured and controlled, not impulsive. Bearish Scenario If sellers continue to reject premium and price closes below the decision zone, a weekly pullback toward the first support becomes the natural path. This remains corrective unless deeper support breaks. Gold is strong.Gold is also expensive. The trend is intact, but location demands patience. This week is about reading reaction, not predicting expansion. What do you think about gold at this weekly decision point? Drop your thoughts below 👇, follow GoldFxMinds for more weekly precision outlooks, and let’s read the market together 🚀✨.
GoldFxMinds
سقوط و جهش طلا: پیام هشداردهنده جهانی که بازارها از آن غافل شدند
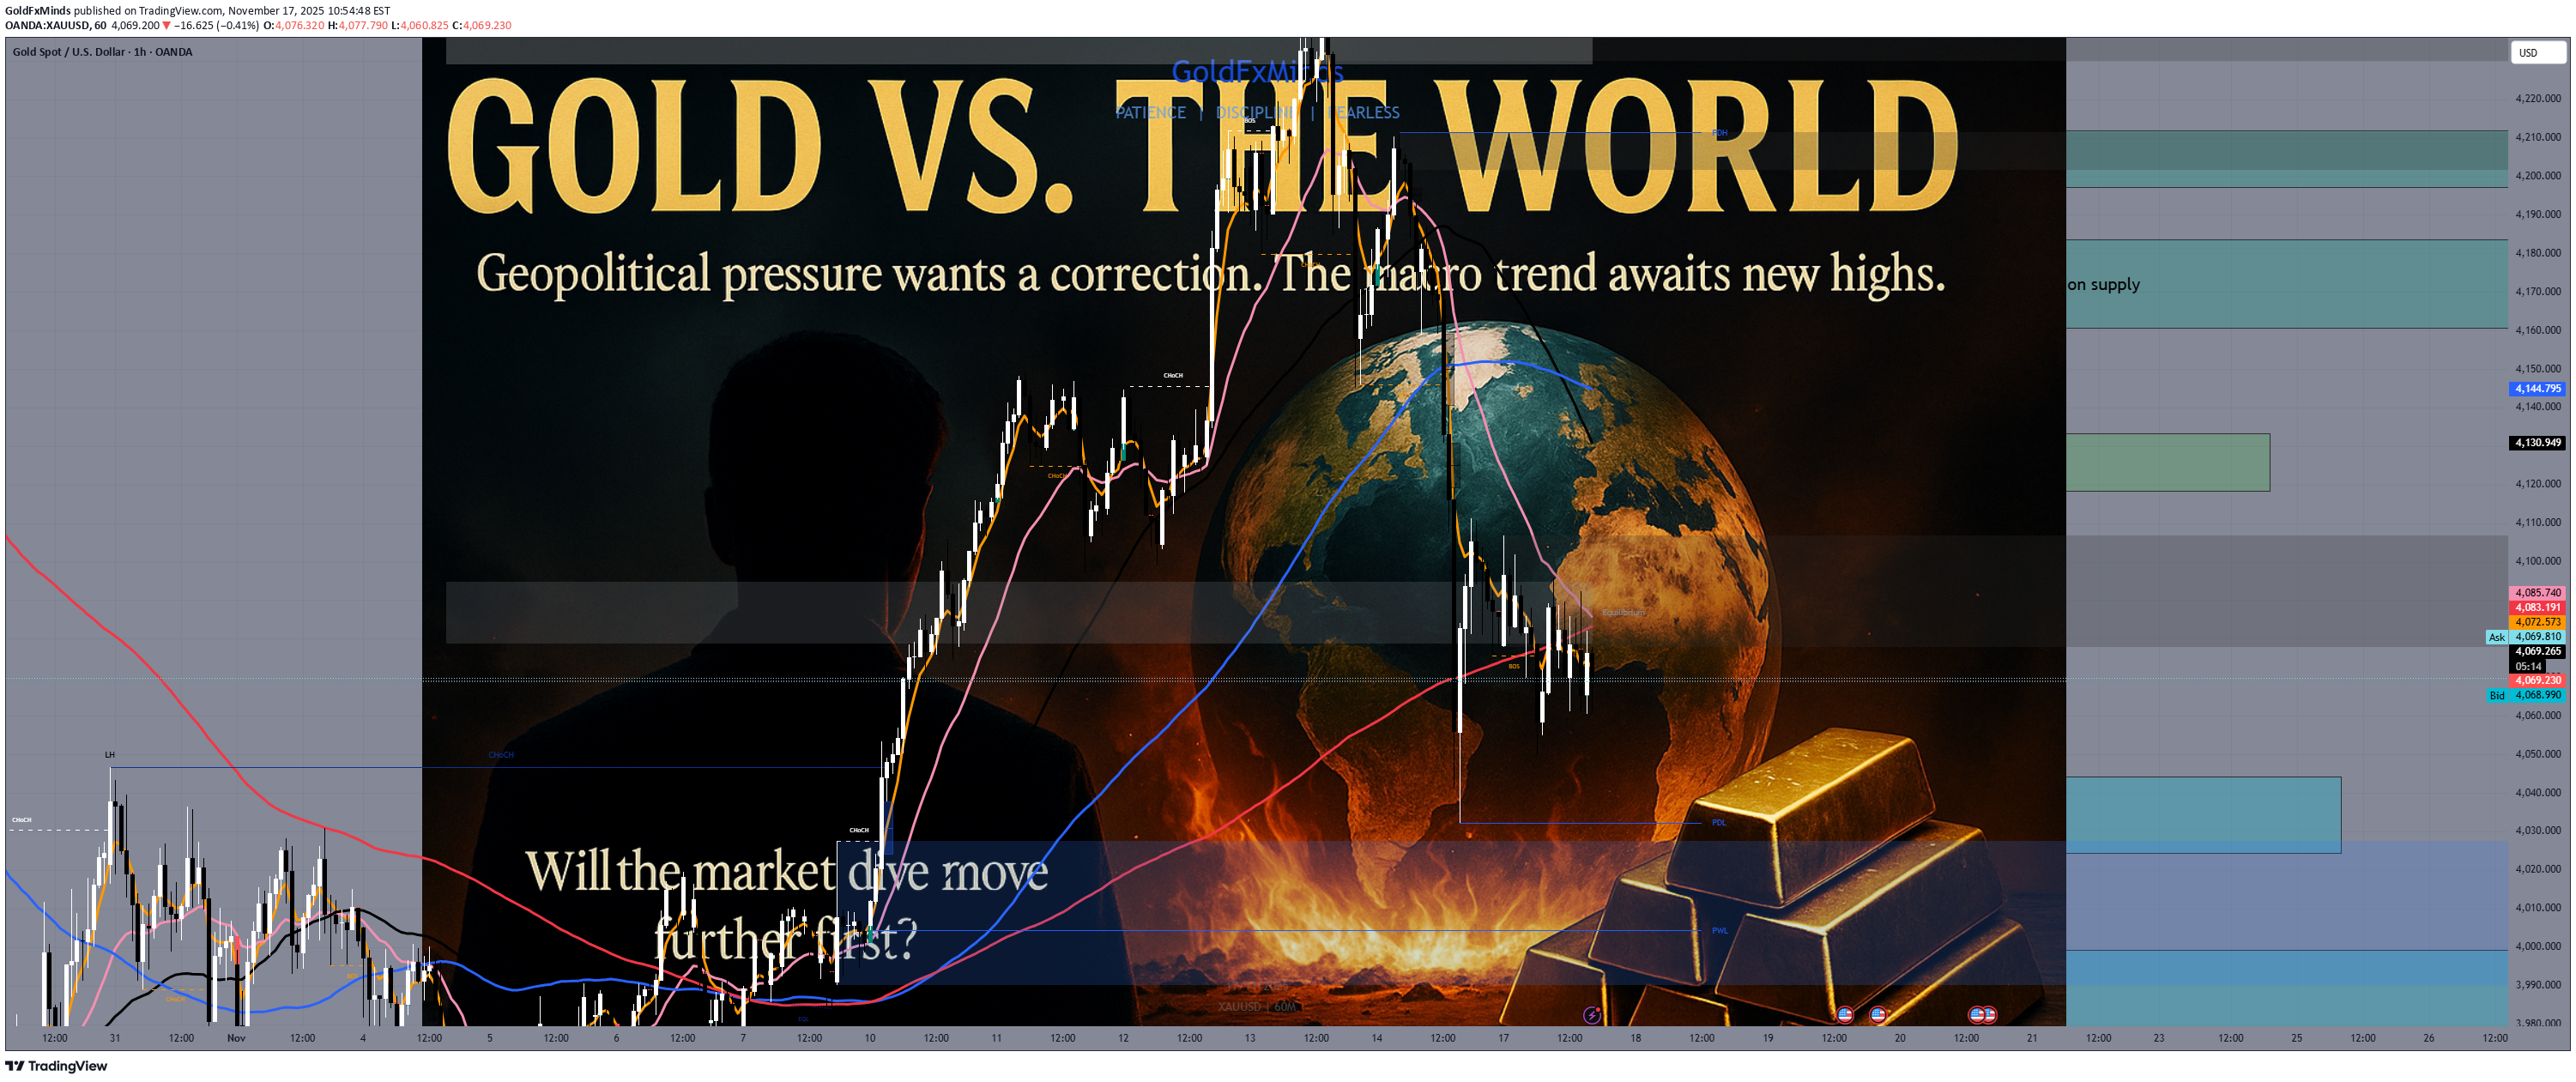
🌍✨ GOLD vs THE WORLD — The Story Behind the Drop, the Bounce, and What Comes Next We’re not just analysing gold today. We’re watching how the world shifts — quietly, but violently — beneath the charts. Gold reacts before the world admits something is wrong. And this week, it reacted loudly. 🧨 1 — The Moment the Market Blinked Gold didn’t fall “just because.” Last week delivered a chain of global stress: geopolitical pressure resurfacing governments shifting fiscal strategies central banks squeezed between inflation and recession global policy discussions that caught traders unprepared No indicator could capture all of it. But price did. 🔥 2 — The Tariff Shock Nobody Priced In Recent U.S. discussions about potential tariff adjustments on countries importing Russian energy injected fresh uncertainty into global markets. Why does this matter? Because it indirectly influences: inflation expectations global energy costs supply chain stability risk sentiment across major economies When energy becomes uncertain, gold becomes protection. And institutions moved quicker than anyone expected. 🥇 3 — Why Gold Fell… and Why It Didn’t Stay Down The drop from 4215 → 4040 looked brutal, but macro structure says something else entirely: 🔹 Liquidity grab above 4240–4300 Big players hunted stops — not positions. 🔹 Profit-taking after extended highs Retail believed in “safe haven”. Institutions believed in “cash flow”. 🔹 Bond & USD volatility accelerated the fall Algorithms followed instantly. 🔹 4040 held to the pip Not by luck — by macro demand stepping in. Central banks are still accumulating. Global tensions remain high. Trust across economies is weakening. In environments like this, gold rarely stays down. 🌪️ 4 — Politics Moves Slowly. Gold Moves First. Markets don’t react to speeches. They react to consequences. These global policy discussions have the power to: reposition supply chains influence commodity flows alter inflation increase global uncertainty When uncertainty rises, gold prepares long before headlines stabilize. 📉 5 — Correction or Macro Reversal? The Truth 📌 Weekly The long wick simply reset excess optimism. Bullish structure holds above 3920–3980. 📌 Daily A controlled correction. EMAs still support bullish continuation. Momentum cooled — structure didn’t break. 📌 Macro This is not a landscape where gold collapses. Not with: geopolitical risk elevated central banks buying aggressively inflation pockets still alive global trust fragile Correction: yes. Reversal: no. But volatility? Absolutely. 🛣️ 6 — The Two-Path Map Ahead Gold stands between two futures: 🟢 Path 1: Bullish Continuation If uncertainty stays elevated and yields cool: 4040–4000 holds macro higher-low forms upside opens toward 4160 → 4240 → 4300 Higher extensions unlock if geopolitical pressure increases. 🔴 Path 2: Deeper Macro Pullback If sentiment stays defensive and USD remains strong: discount into 3980–3920 becomes possible But even this is bullish macro territory — exactly where institutions prefer to accumulate. ⚔️ 7 — What Traders Forget: Gold Is a Mirror Gold doesn’t move on its own. It moves with the world. When trust weakens, gold strengthens. When politics escalate, gold neutralizes. When economies shake, gold reflects the truth. This isn’t just price action. It’s a global mood indicator — and right now, the world feels uneasy. 🟡✨ Gold Is Not a Trade… It’s a Signal When the world shifts, gold whispers first. When the world breaks, gold screams first. When the world calms, gold confirms it. We’re not watching candles — we’re watching consequences. 🚀 If this Market Story opened your perspective… 👇 Drop a comment, hit Follow, and smash Like — let’s navigate the storm together, one chapter at a time. ✨
GoldFxMinds
طلا در نقطه عطف تاکتیکی: نبرد کلیدی برای تعیین مسیر آینده
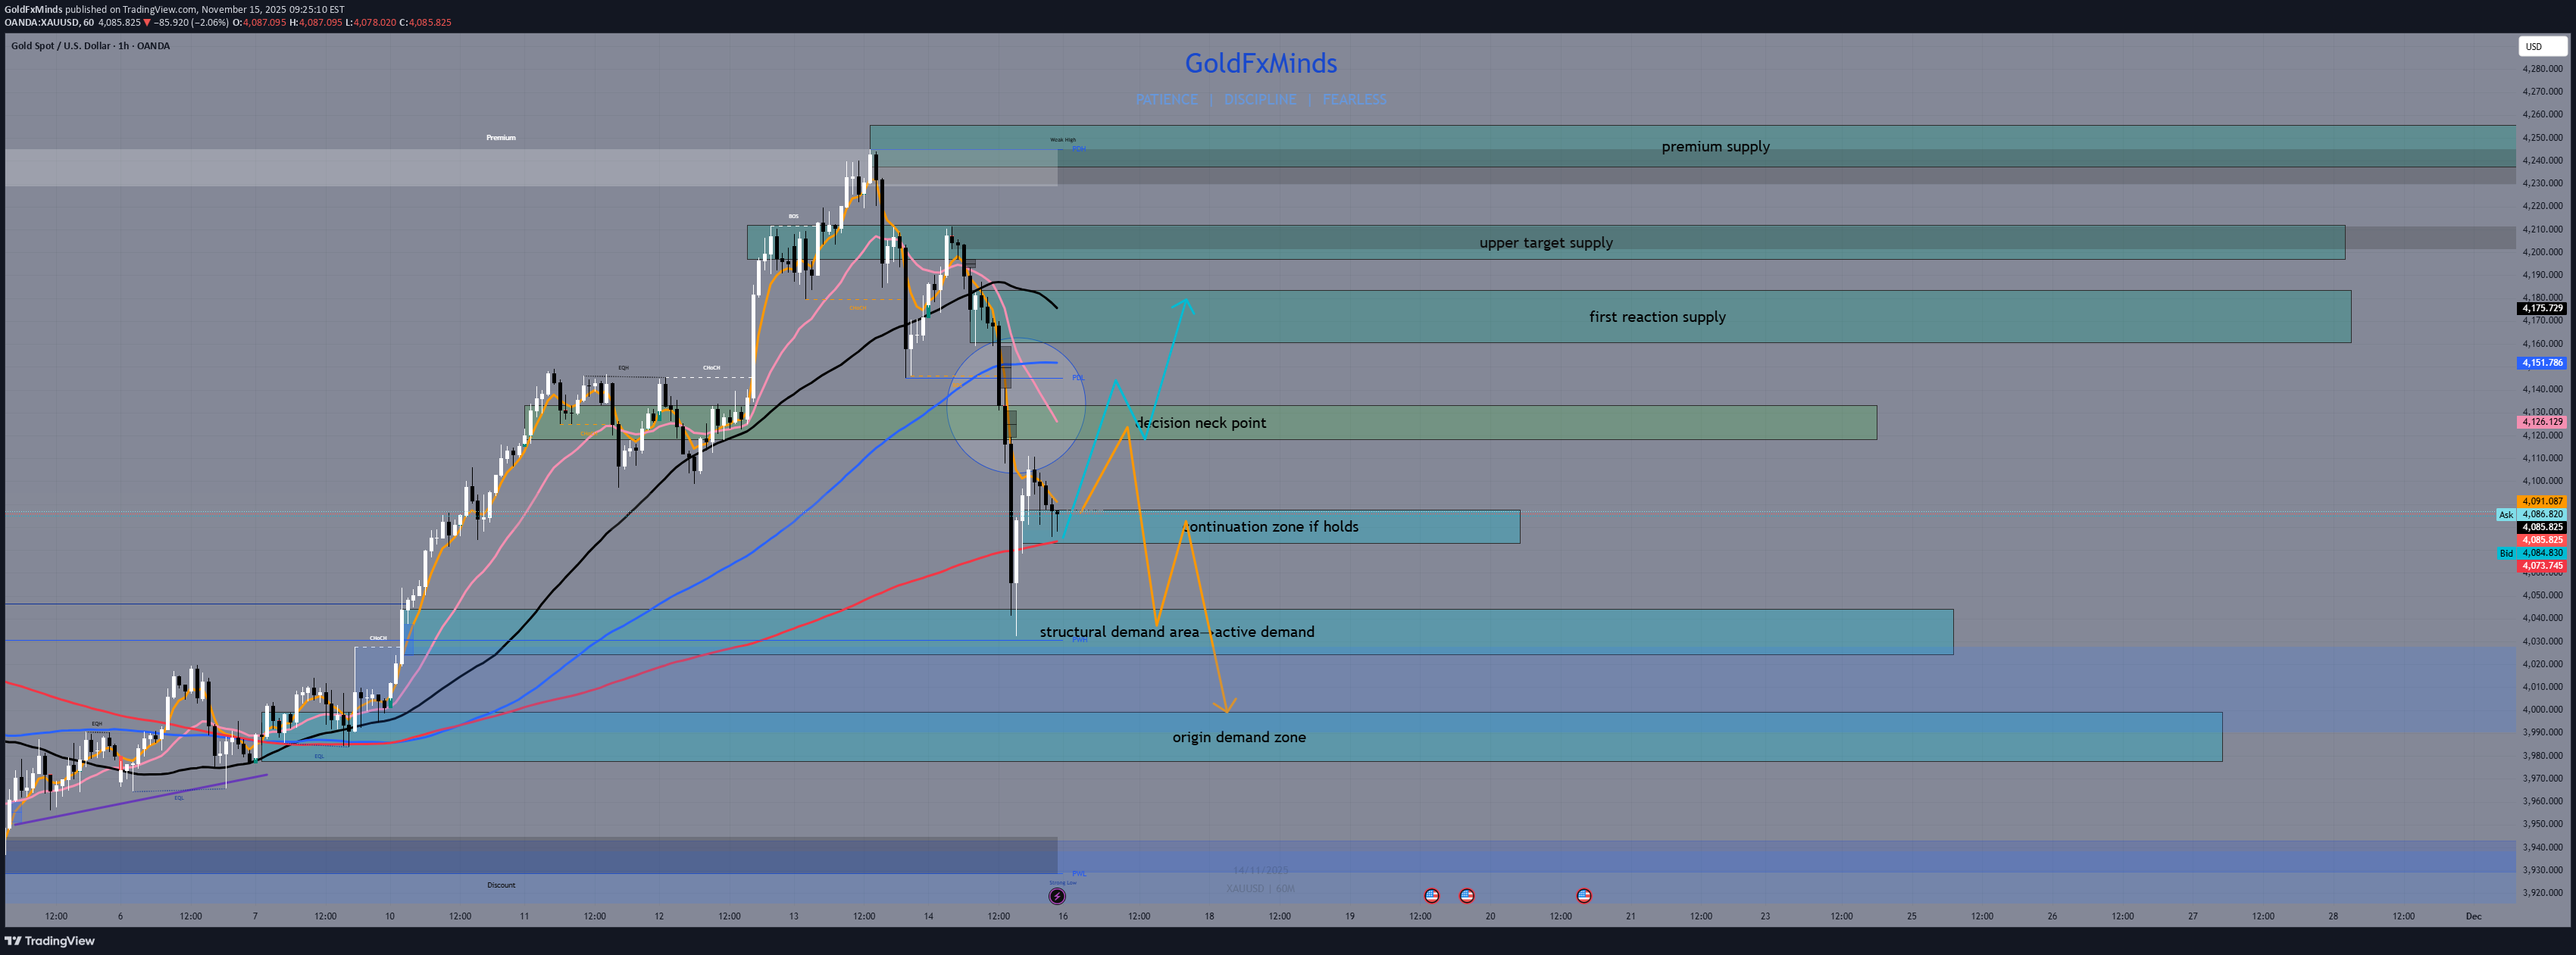
Hello traders, Gold enters the new week positioned right between reactive supply above and layered demand below, after completing a clean corrective leg from 4245 into 4085. The market is preparing for the next directional phase. 📰 Macro Pulse The week opens with markets waiting for fresh USD inputs — CPI impact continues to fade, while the dollar stabilizes ahead of mid-week catalysts. Gold stays supported by the broader HTF bullish macro trend, but the H1 chart is still navigating a corrective structure. This sets the stage for a tactical battlefield: buyers defending local demand, sellers guarding intraday supply. 🟥 H1 Supply Zones Above Price 1. First Reactive Supply 4 160 – 4 175 Where the impulsive selloff originated. A clean bearish OB with BOS confirmation — the first real ceiling intraday. 2. Upper Continuation Supply 4 197 – 4 211 The zone that extended bearish displacement. Strong continuation footprint. 3. Premium Extension Supply 4 240 – 4 255 Premium-level resistance. If gold reaches here, buyers are likely already overextended. 🟦 H1 Demand Zones Below Price 1. Continuation Demand Base 4 073 – 4 087 The demand currently holding price. Not a reversal zone, but an active continuation base. 2. Structural Demand Layer 4 027 – 4 044 The first deep structural support, matching the core of the bullish leg from early November. 3. Origin Demand Zone 3 986 – 4 000 The true origin of the full impulse 3980 → 4245. Ultimate downside limit before momentum structurally shifts. ⚪ Decision Zone H1 Mid-Range Imbalance 4 118 – 4 132 A clean Fair Value Gap that sits right at the mid-range of current structure. This zone will decide whether gold sets a deeper retrace or rotates upward. 🎯 Battlefield Map Gold opens Monday inside a compression between Continuation Demand Base and the mid-range imbalance, meaning H1 will choose direction early in the session. Acceptance above 4 118–4 132 shifts momentum back toward supply. Rejection keeps the correction alive and exposes deeper demand. 📌 Bullish Scenario Buyers defend 4 073–4 087, reclaim the imbalance at 4 118–4 132, and push toward: ➡️ First Reactive Supply (4 160 – 4 175) Above that, extension targets open toward ➡️ Upper Continuation Supply (4 197 – 4 211) 📌 Bearish Scenario Failure to reclaim the imbalance sends price back into deeper levels: ➡️ Structural Demand Layer (4 027 – 4 044) Loss of that zone exposes ➡️ Origin Demand Zone (3 986 – 4 000) which is the last structural defense of the bullish November leg. 🧭 Conclusion H1 is still in a corrective phase inside a bullish HTF macro environment. The 4 118–4 132 imbalance is the key battleground that will decide whether buyers regain control or sellers extend the correction. What do you think about this H1 map? Drop your thoughts below, leave a like, and follow for more premium precision outlooks. 🚀✨
GoldFxMinds
طلا: نبرد میانهرده در چرخه صعودی بزرگ؛ گام بعدی کجاست؟
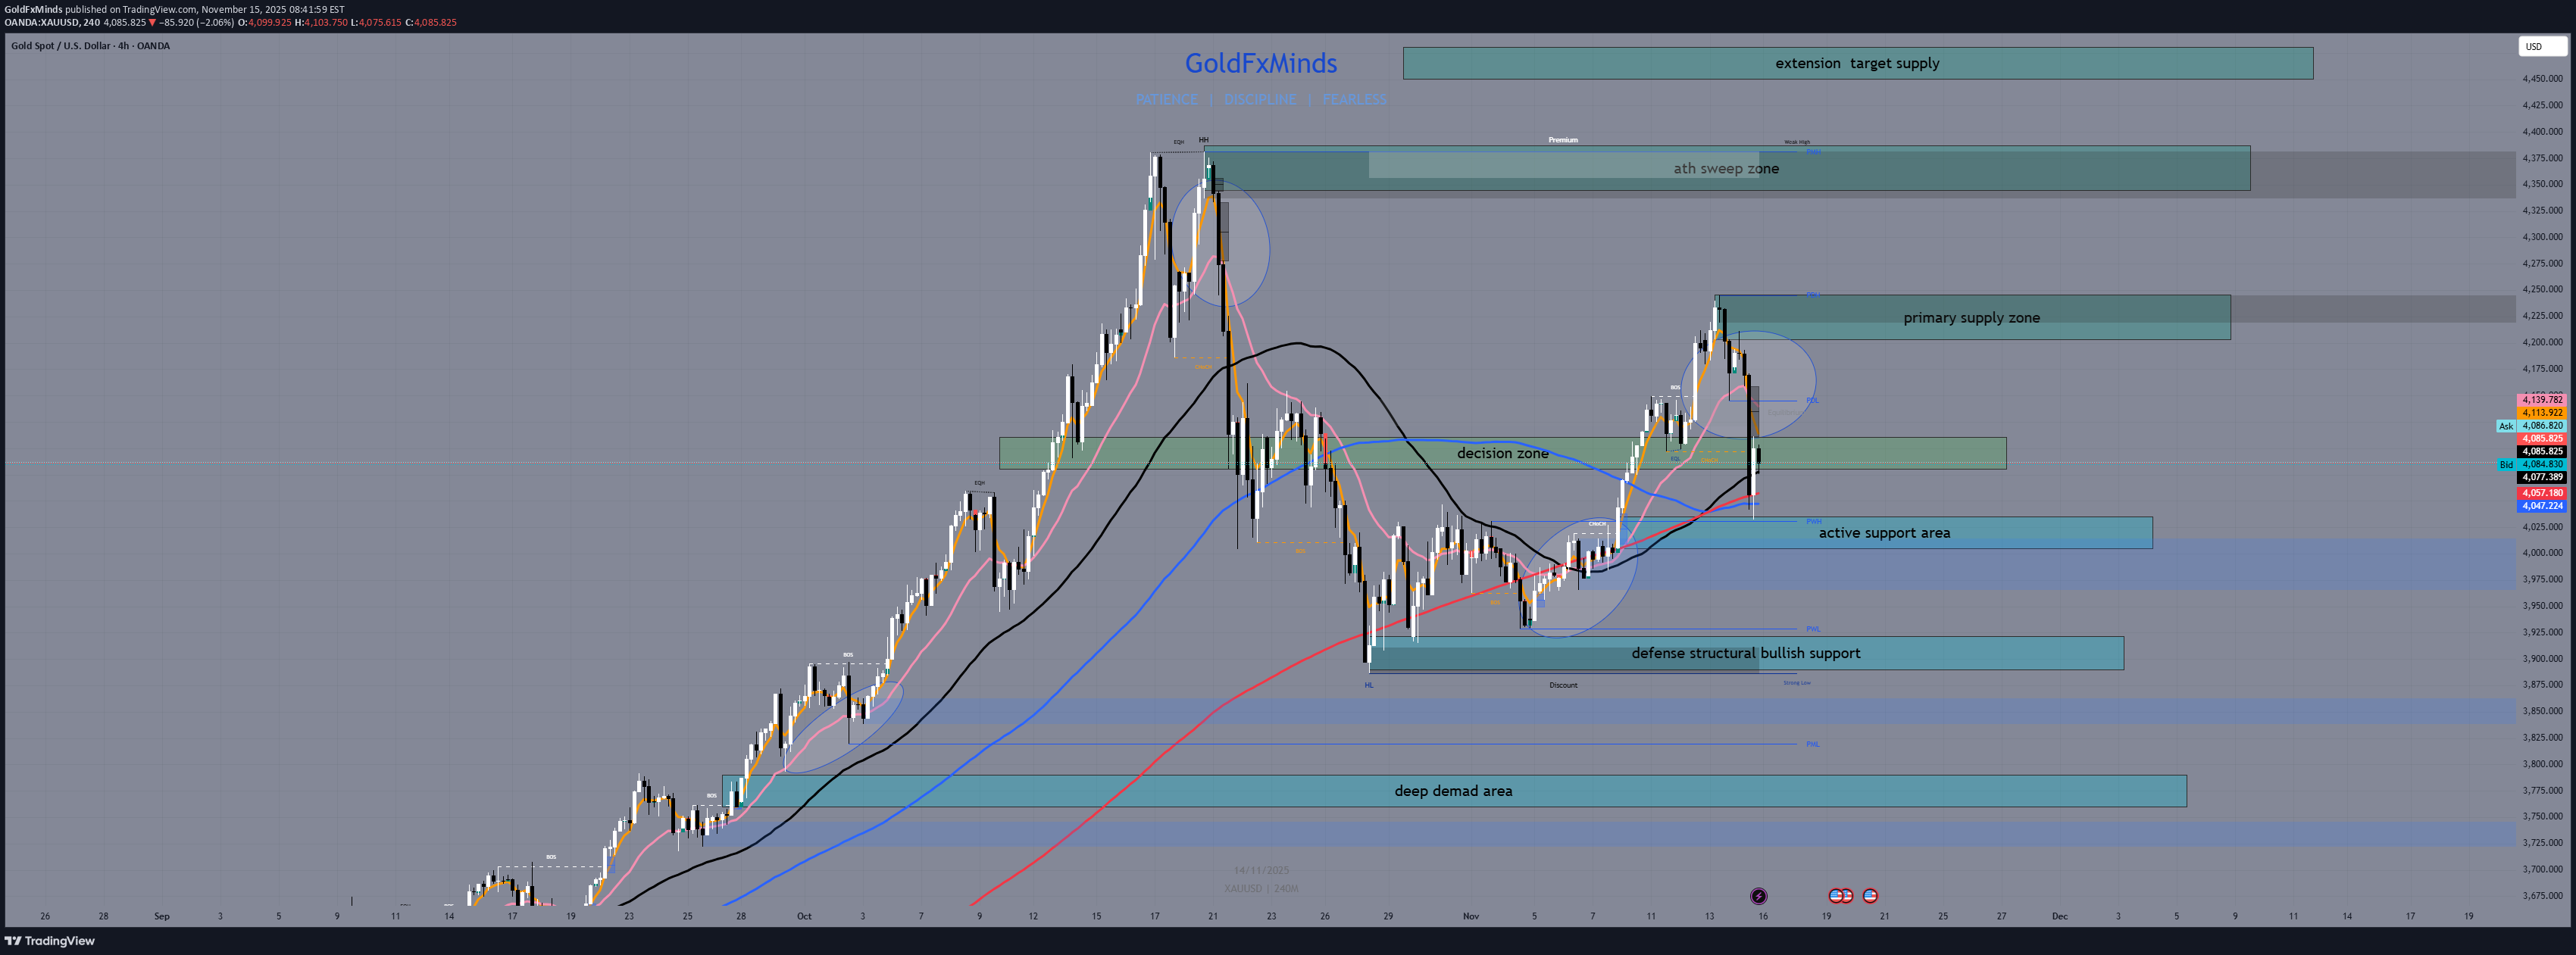
Hello traders, welcome to today’s premium four hour briefing. Gold is navigating a crucial phase inside a macro bullish cycle that began after the October all-time high around 4380. The market completed a deep correction into 3885, launched an impulsive rally into 4245, and is now retracing into mid-range levels around 4085. H4 structure is compressing, and the next reaction from demand or the decision zone will decide whether the market attempts continuation or sinks into a deeper pullback. 🌍 Macro Pulse Gold remains fundamentally supported. Lower US inflation readings, weakening labor momentum and the expectation that the Federal Reserve will continue a softer trajectory create a macro backdrop that favors dips being bought. However, yields remain sticky and risk sentiment is mixed, slowing the pace of bullish continuation. This aligns perfectly with the H4 structure: bullish on the larger cycle, corrective on the mid-term, and waiting for confirmation before expanding again. ⚔️ H4 Battlefield Overview The macro correction from 4380 into 3885 created a clean discounted base for accumulation. The rally into 4245 defined the new bullish leg. The current drop toward 4085 is a classical mid-leg retracement. On H4, demand layers remain intact below, while supply clusters above are untouched. An internal imbalance around 4120 to 4147 acts as the first upside magnet if bulls defend the lower levels. The decision zone at 4080 to 4110 controls the flow. H4 Bias: Bullish Corrective Gold leans bullish on H4, but remains inside a clean corrective pullback. Buyers still control the larger structure as long as demand zones continue to hold. 🟥 H4 Supply Zones Above Price (low → high) 1. Major H4 Supply Block 4205 – 4240 The consolidation that preceded the last aggressive sell-off. The first real supply layer above the current correction. 2. H4 ATH Rejection Supply 4345 – 4380 This is the institutional supply formed at the October all-time high. Strong macro rejection here defined the entire 4380 → 3885 correction. 3. H4 Extension Supply 4450 – 4480 The deeper premium layer projected from macro structure. If price breaks through 4380, this becomes the next major target. 🟦 H4 Demand Zones Below Price (low → high) 1. Immediate H4 Demand 4005 – 4035 The current zone stabilizing price. Strong wick reactions and absorption confirm active buyers. 2. Mid H4 Demand 3890 – 3920 The accumulation pocket that launched the current 3885 → 4245 leg. A foundational bullish block. 3. Deep H4 Demand 3760 – 3790 The deepest structural discount of the entire macro cycle. Only tested in case of a significant correction. ⚪ H4 Decision Zone 4080 – 4110 This mid-range pivot determines the next leg. Acceptance above shifts momentum upward. Rejection invites continuation to lower demand. 🎯 Upside Inefficiency Target 4120 – 4147 A clean H4 imbalance left by the drop. Not a supply zone. If demand holds, this is the first natural upside draw. 📈 Bullish Scenario Bulls need: Strong defense at 4005 – 4035 Reclaim of the decision zone at 4080 – 4110 Push into the imbalance at 4120 – 4147 Continuation toward 4205 – 4240 If 4240 breaks, gold opens direct road into 4345 – 4380. 📉 Bearish Scenario Sellers gain traction if: Price gets rejected at the decision zone Attempts into 4120 – 4147 fail Market slips back under 4070 Downside targets: Immediate demand 4005 – 4035 If this breaks, continuation into 3890 – 3920 Deep correction exposes 3760 – 3790 🔥 Conclusion Gold is consolidating inside a macro bullish cycle. The all-time high at 4380 remains the macro anchor. Price is now balancing between premium supply and discounted demand. The decision zone at 4080 – 4110 holds the entire map together. A clean breakout from this mid-range compression will define the next powerful leg. What do you think about this H4 map? Share your thoughts below, drop a like if it helped you, and follow GoldFxMinds for more premium multi-timeframe precision updates.
GoldFxMinds
طلا در قله: تحلیل هفتگی و نقطه سرنوشتساز بازار (صعود یا سقوط؟)
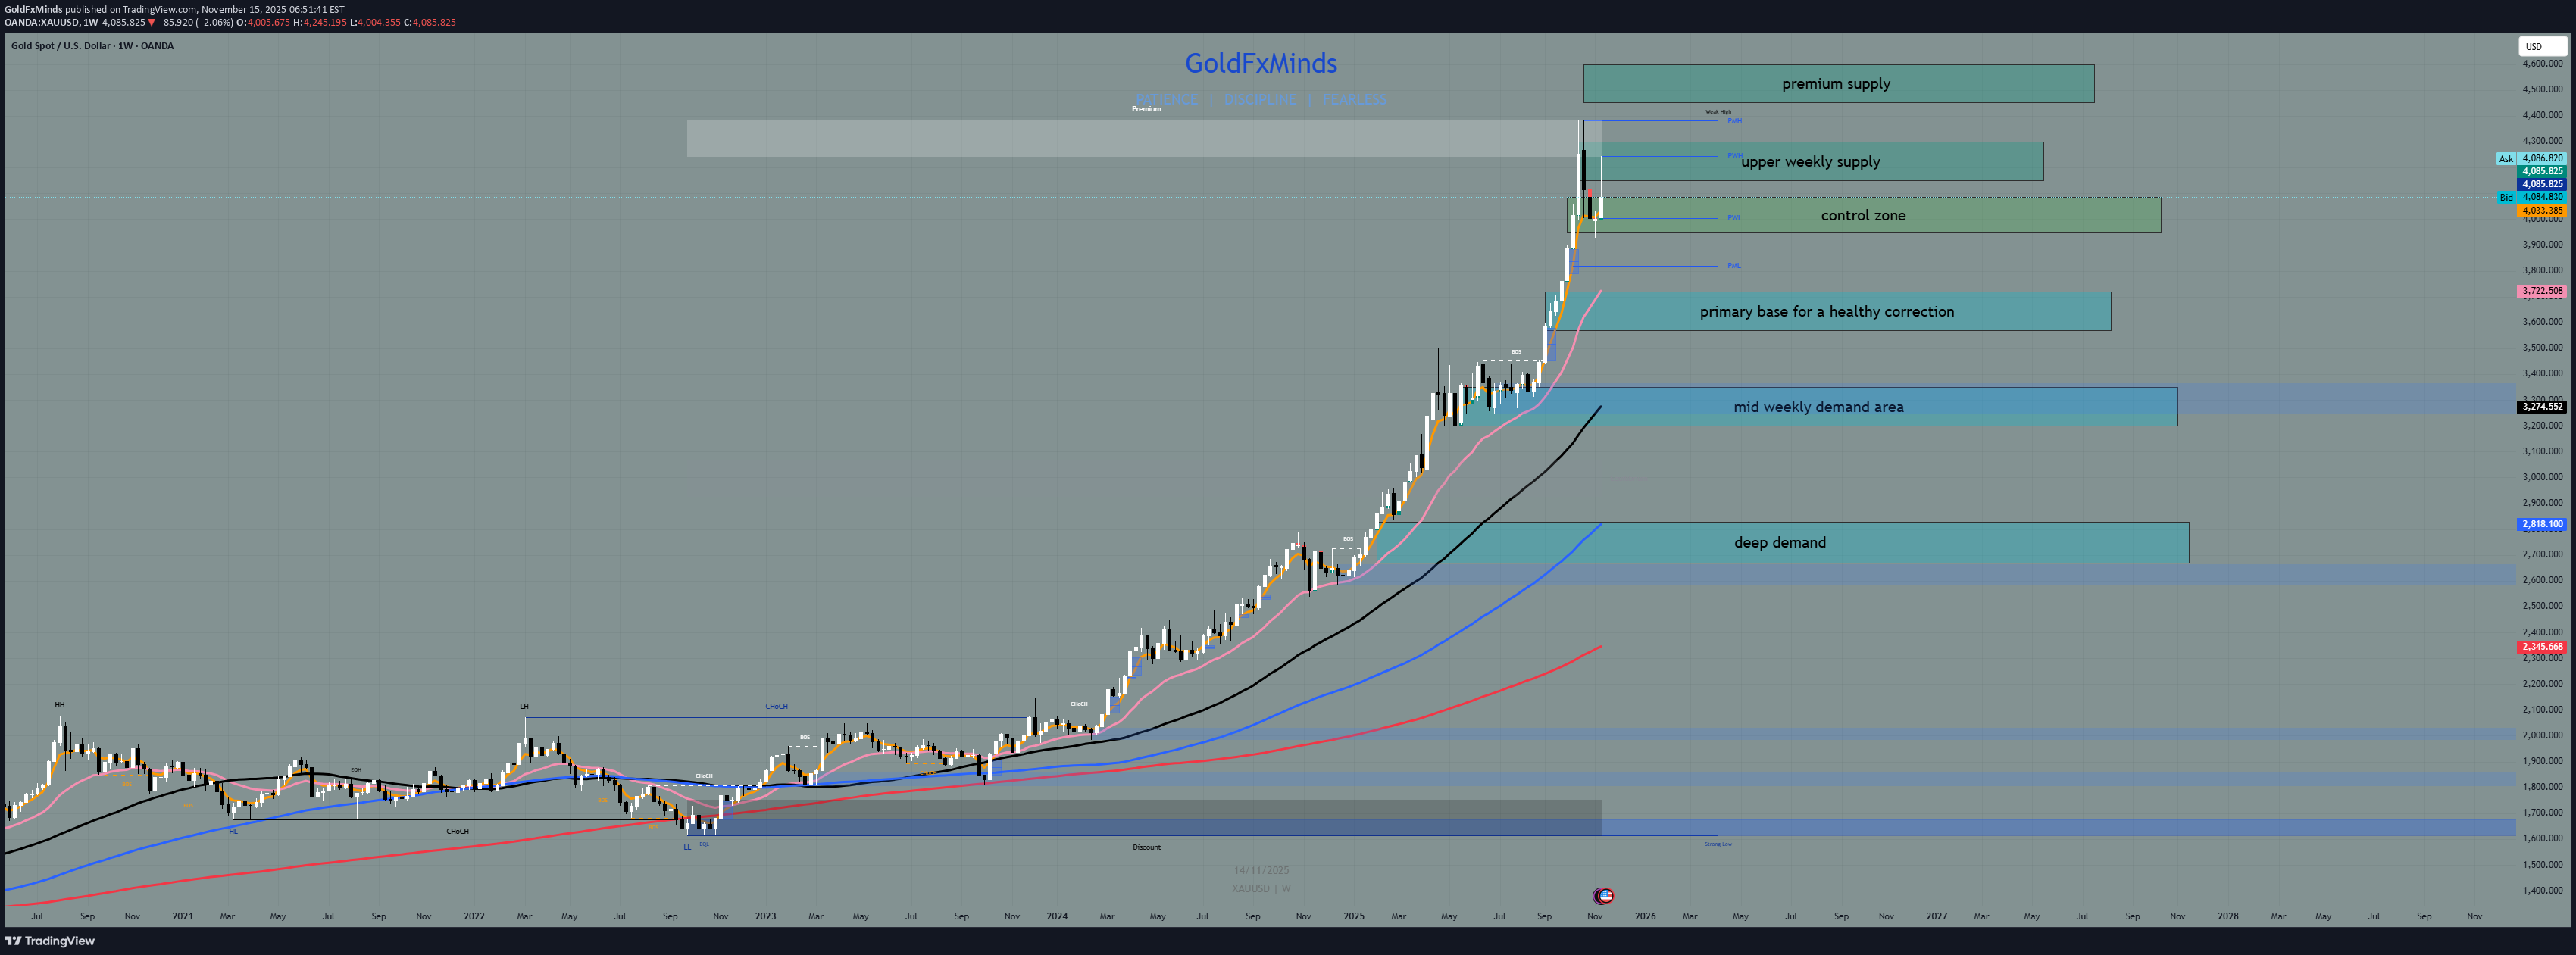
Hello traders, Gold enters the new week holding its ground at the very top of a monumental rally. Last week printed a sharp rejection wick from premium territory, signaling absorption and the first sign of exhaustion after weeks of vertical expansion. The weekly structure now stands at a crucial decision point where the next candle could define momentum for the rest of the month. Macro And News Narrative A dense USD-driven calendar is lining up. FOMC Minutes may shift expectations around policy easing. Labor and PMI data can influence short-term dollar demand. Geopolitical tension remains an underlying driver that often fuels volatility in gold during uncertain weeks. From a weekly perspective, this environment is ideal for decisive movement in either direction, making structural levels even more important. Bias From Weekly Structure The dominant trend remains bullish, yet the weekly chart shows a clear signal of deceleration. Gold rejected a major premium supply, left a wide SCFI imbalance beneath price and is now hovering just above a key decision zone. The market is still bullish in the big picture, but conditions support the possibility of a controlled retracement into discount. Weekly Structural Map 🟥 Upper Weekly Supply 4300 to 4150 The origin of last week’s rejection. This is the immediate premium distribution zone that halted the advance. Logic 4150 becomes the first upside target because it marks the beginning of distribution. 4300 becomes the second because it completes the delivery of the entire supply block. 🟥 Mid-Premium Supply Block 4600 to 4450 The next premium layer above the current rejection area. Logic 4450 becomes the continuation target once 4300 is cleared, as it marks the next premium imbalance boundary. 🟥 Extreme Premium Supply 4900 to 4750 A deeper premium structure visible in the extended swing. It activates only if gold resumes the trend with strength. Logic 4750 is the next untouched premium layer and a natural continuation target. 🟦 First Weekly Demand 3720 to 3570 The last valid weekly order block before the major bullish break of structure. It aligns with an older imbalance that has not been fully delivered. Logic 3720 becomes the first downside target if the decision zone breaks. 3570 completes the full delivery of the demand block. 🟦 Mid-Weekly Demand 3350 to 3200 The correct intermediate demand zone from your W1 chart. This is the consolidation base that formed before the major continuation leg. It is not a wick but a structured corrective pause, supported by a small imbalance below it. Logic If 3570 fails, this zone becomes the next structural destination because it represents the next intact weekly discount area before long-term accumulation. 🟦 Deep Weekly Demand 2820 to 2670 A long-term accumulation block far below current price. Not in immediate play but important in the weekly architecture. ⚪ Weekly Decision Zone 4085 to 3950 This zone contains the upper section of a wide SCFI imbalance and sits directly beneath current price. A weekly decision here will determine whether gold returns to premium or shifts into a multi-layered retracement. Bullish Scenario If buyers defend the decision zone and respond inside the SCFI imbalance, gold can drive back into premium. A move above 4085 shows regained interest. A break through 4150 completes the first premium delivery and opens the path to 4300. If buyers sustain this momentum, price can extend toward the Mid-Premium Supply Block at 4450 and, if the trend accelerates, into the Extreme Premium Supply around 4750. These targets follow the natural progression of supply block boundaries and premium inefficiencies. Bearish Scenario If the decision zone fails and weekly price closes below 3950, the structure invites a deeper retracement. The first destination becomes the Upper Weekly Demand at 3720 to 3570. If sellers break beneath this zone, gold naturally gravitates toward the Mid-Weekly Demand at 3350 to 3200, which is the next structural discount layer. Only a strong weekly close below that area would expose the path toward the Deep Weekly Demand at 2820 to 2670. This progression follows the clean weekly staircase of discount levels. Conclusion Gold begins the week at a critical turning point. A premium rejection, a wide SCFI imbalance, a multi-layered demand map and a decision zone directly beneath price create a clear structural narrative. Whether gold reclaims premium supply or slides into deeper discount will depend on how price behaves within the decision zone. What do you think about this weekly map? Share your thoughts below, hit like and follow GoldFxMinds for more precision outlooks. 🚀✨
GoldFxMinds
فروپاشی اعتماد؛ طلایی که بدون پسلرزه به اوج رسید!
Where fake calm hides real panic. The world is on fire — and gold just told the truth. While Gaza burns and Israel vows escalation, Washington floods the media with noise about “containment” and “stability.” But behind the screens, liquidity is vanishing, treasuries are bleeding, and capital is running — fast — into metal. On Monday, banks were closed. No volume. No liquidity. And yet gold exploded over 1000 pips — a vertical rally built on thin air. No structure, no pullback, no reason… unless you look beyond the chart. This move wasn’t strength — it was fear in motion, a geopolitical panic wrapped in a technical illusion. Every tick higher was an insurance premium against a collapsing global narrative. When truth is censored, gold becomes confession. When trust erodes, metal becomes currency. 🧭 HTF Structural Context (D1–H4) D1: Pushed into premium territory, just under ATH 4117, with zero reaction from supply. H4: Flow remains bullish but stretched to its limits — liquidity now resting underneath the leg. Institutional demand footprints lie around 4050 and 3980 — the only structural floors left below the extension. ⚙️ Intraday Structure (H1–M15) The H1 impulse (4005 → 4117) is a pure liquidity event — three expansions, no retracement, imbalance everywhere. Now the structure breathes heavy — exhaustion at the top, vacuum through the mid-range, and clean bases below. 🟦 Demand Zone — 4035–4052 The origin of truth. Last clean base after sweeping 4030 — untouched, structured, and the only zone where buyers acted with intent. If gold retraces naturally, this is where real money waits. ⚪ Decision Zone — 4070–4088 The control shelf — equilibrium between panic and patience. Hold above = buyers maintain command. Slip below = gravity takes over toward 4050. 🟥 Supply Zone — 4105–4125 (ATH Sweep Area) Premium extension, equal highs, exhaustion trap. This isn’t supply — it’s liquidity dressed as glory. Fake breakouts above 4117 could trigger the reversal everyone forgot to expect. 🎯 Tactical Scenarios Bullish: Hold above 4070, retest 4105–4125, and we could see one more liquidity sweep before a major breath out. Bearish: Reject 4105–4125 and the dominoes line up — 4080 → 4050 → 4035 — where structure finally meets logic. 🧠 Macro Context This isn’t a chart anymore — it’s a mirror. A reflection of fear, misinformation, and the quiet collapse of trust. While nations weaponize narratives and markets chase illusions, gold stands alone — not as a trade, but as testimony. It doesn’t shout, it simply moves — and when it does, the world listens. Follow, like and comment — GoldFxMinds 💎 Precision over prediction. Context before confirmation.
GoldFxMinds
طلا: نبرد نهایی در چه قیمتی رقم میخورد؟ تحلیل ساختاری کلیدی امروز
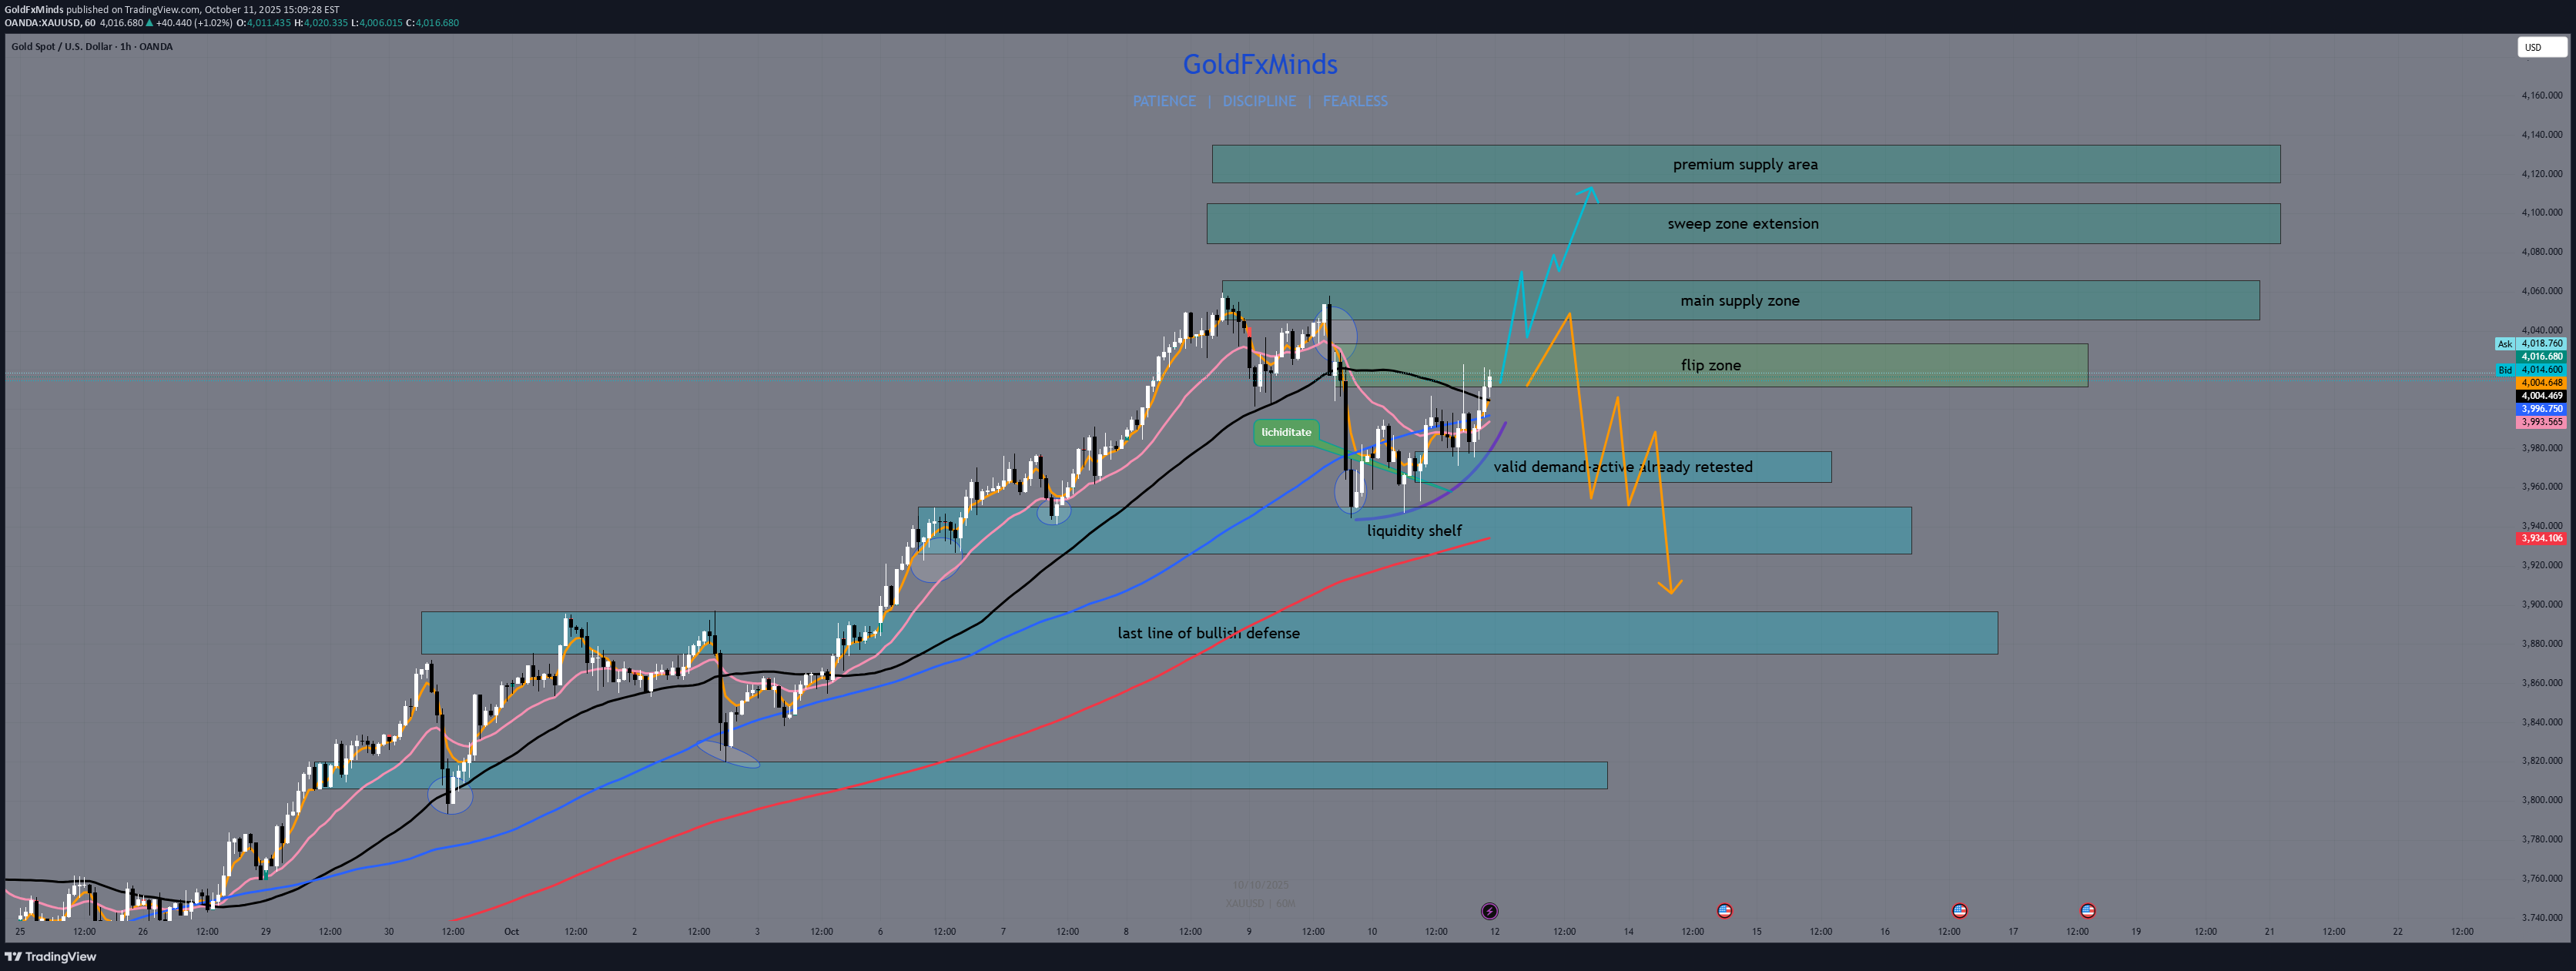
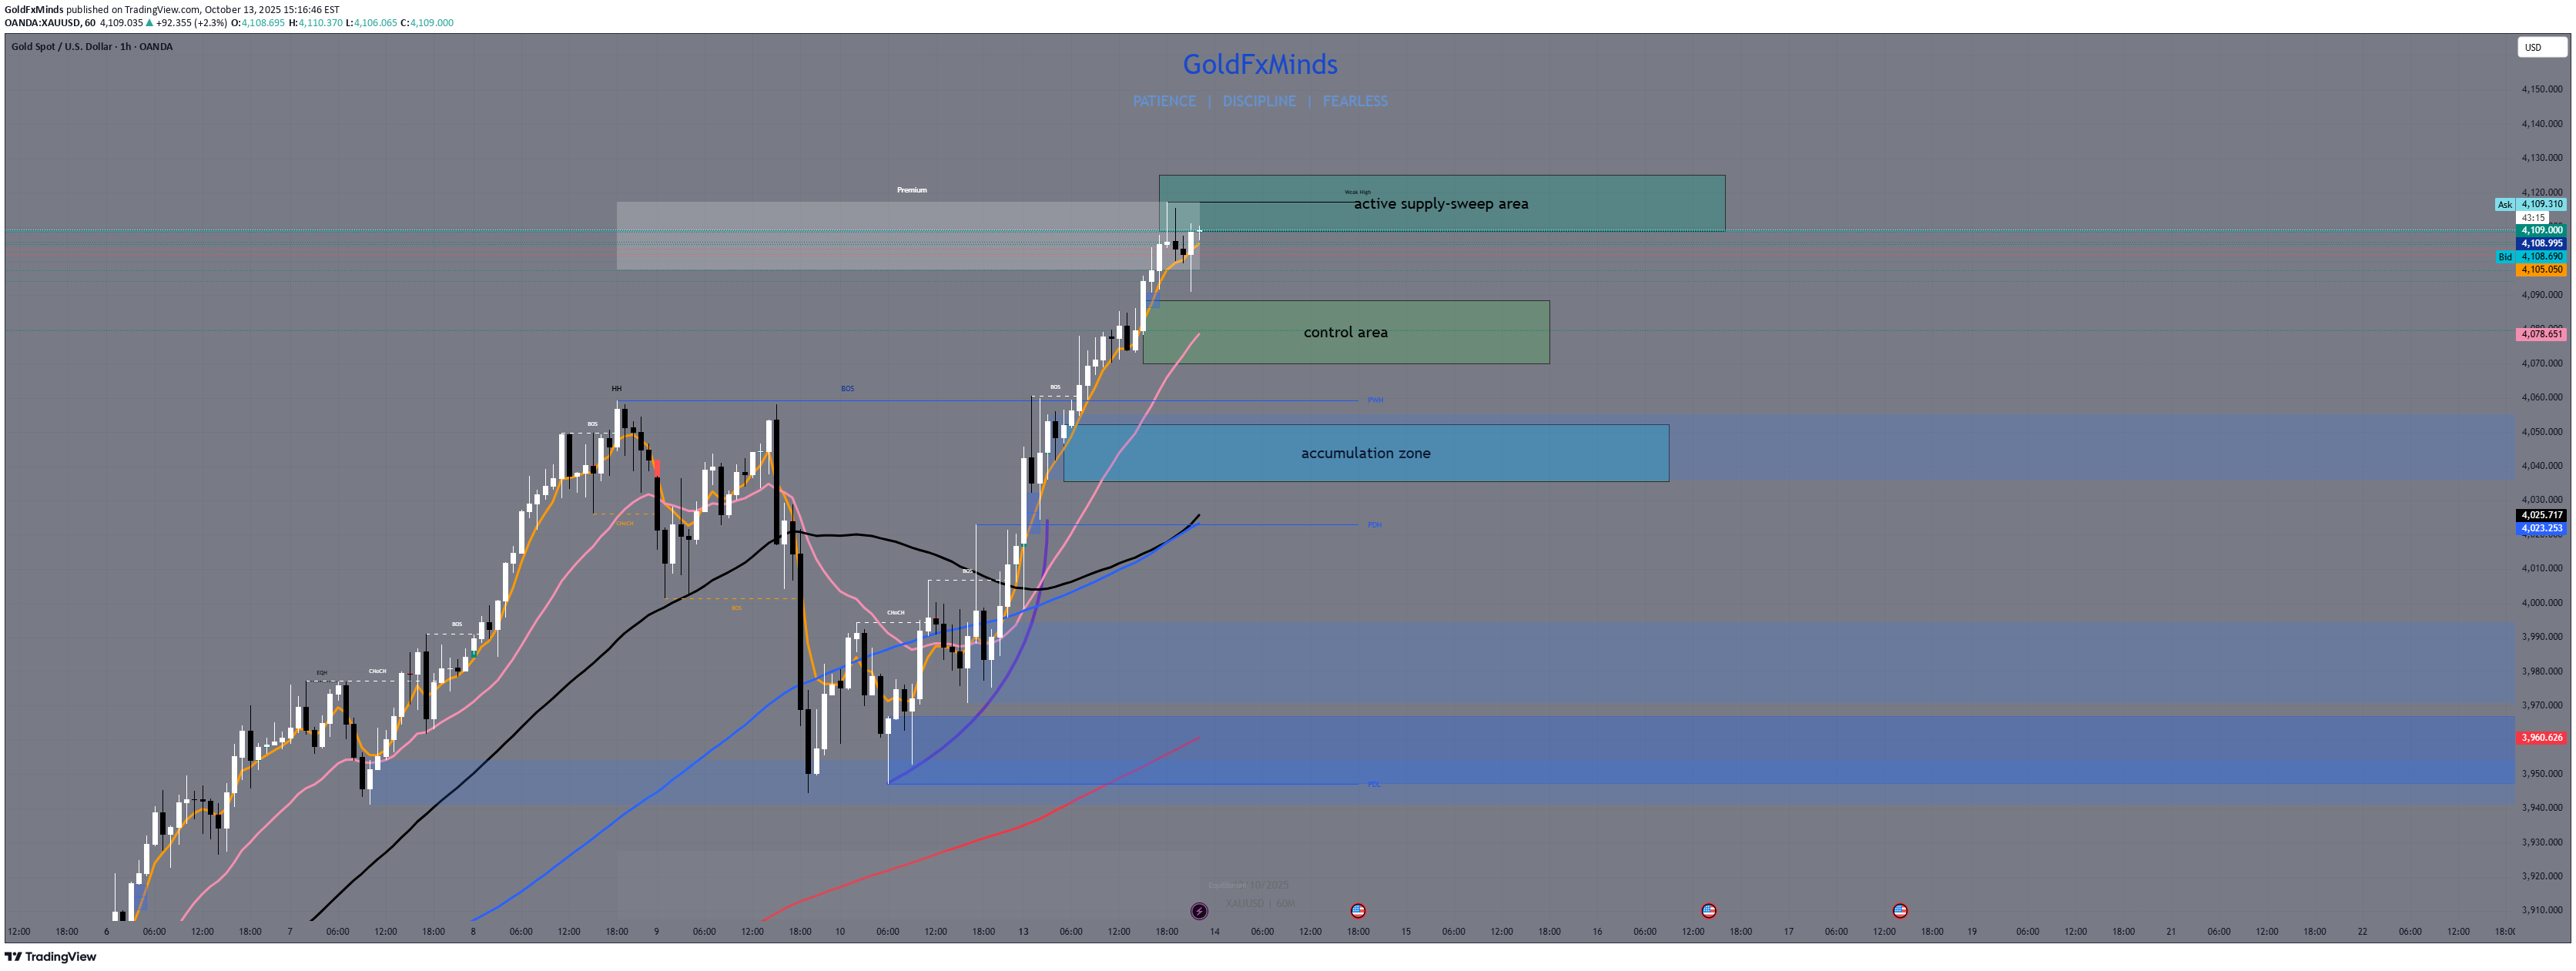
Gold remains inside a tactical correction after the impulsive leg from 3,875 → 4,060. The flow is now caught between redistribution and potential reaccumulation — controlled, deliberate, and layered. Bias stays fragile-bullish, but trapped inside a battlefield of clean supply and stacked demand. 🧱 STRUCTURAL MAP 🔺 Main Supply (4,045–4,065) The origin of the last sell-side impulse — this is the true distribution block that pushed price down to 3,945. Currently acting as the active ceiling for intraday sellers. 🔺 Sweep Extension (4,085–4,105) Upper liquidity projection — any sweep above 4,065 followed by rejection here would reconfirm short-term weakness. ⚪ Flip Zone (4,015–4,030) The true battlefield between bulls and bears. A clean reclaim above 4,030 signals reaccumulation; another rejection confirms redistribution lower. 🟦 Valid Demand OB (3,965–3,975) Fresh bullish Order Block formed after the bounce from 3,945. As long as H1 closes above this range, intraday control remains with buyers. 💧 Liquidity Shelf (3,945–3,925) Cluster of equal lows — a liquidity pocket ready to be swept before real reaccumulation starts. If taken cleanly, expect reaction from the deeper demand below. 🟦 Defense Demand (3,875–3,895) The structural discount base — anchored on the H1/EMA200 zone. This is the “final defense line” for buyers and the potential origin for a fresh impulsive leg. ⚔️ Tactical Scenarios Bullish Path: If 4,030 is reclaimed with conviction → expect continuation toward 4,045–4,065. A breakout beyond this main supply can extend to 4,085–4,105, but beware of engineered sweeps above 4,060. Bearish Path: If 4,015–4,045 rejects again → price likely revisits 3,975, then 3,945. A clean break below 3,945 exposes liquidity toward 3,875–3,895. 💬 Summary H1 flow is clear and ready for decision — either a reaccumulation reclaim above 4,030, or a controlled correction toward the lower defense block. Liquidity sits both ways, but precision lies in patience: the next impulsive move will reveal the real hand behind Gold’s flow. ✨ Patience defines mastery. Let the chart speak — then act. Follow GoldFxMinds for daily precision maps — Like, Comment & Stay Tactical. 👑
Disclaimer
Any content and materials included in Sahmeto's website and official communication channels are a compilation of personal opinions and analyses and are not binding. They do not constitute any recommendation for buying, selling, entering or exiting the stock market and cryptocurrency market. Also, all news and analyses included in the website and channels are merely republished information from official and unofficial domestic and foreign sources, and it is obvious that users of the said content are responsible for following up and ensuring the authenticity and accuracy of the materials. Therefore, while disclaiming responsibility, it is declared that the responsibility for any decision-making, action, and potential profit and loss in the capital market and cryptocurrency market lies with the trader.