Technical analysis by GoldFxMinds about Symbol PAXG on 12/14/2025

GoldFxMinds
Gold H1 — Buyers Reload Below, Sellers Lurk Above
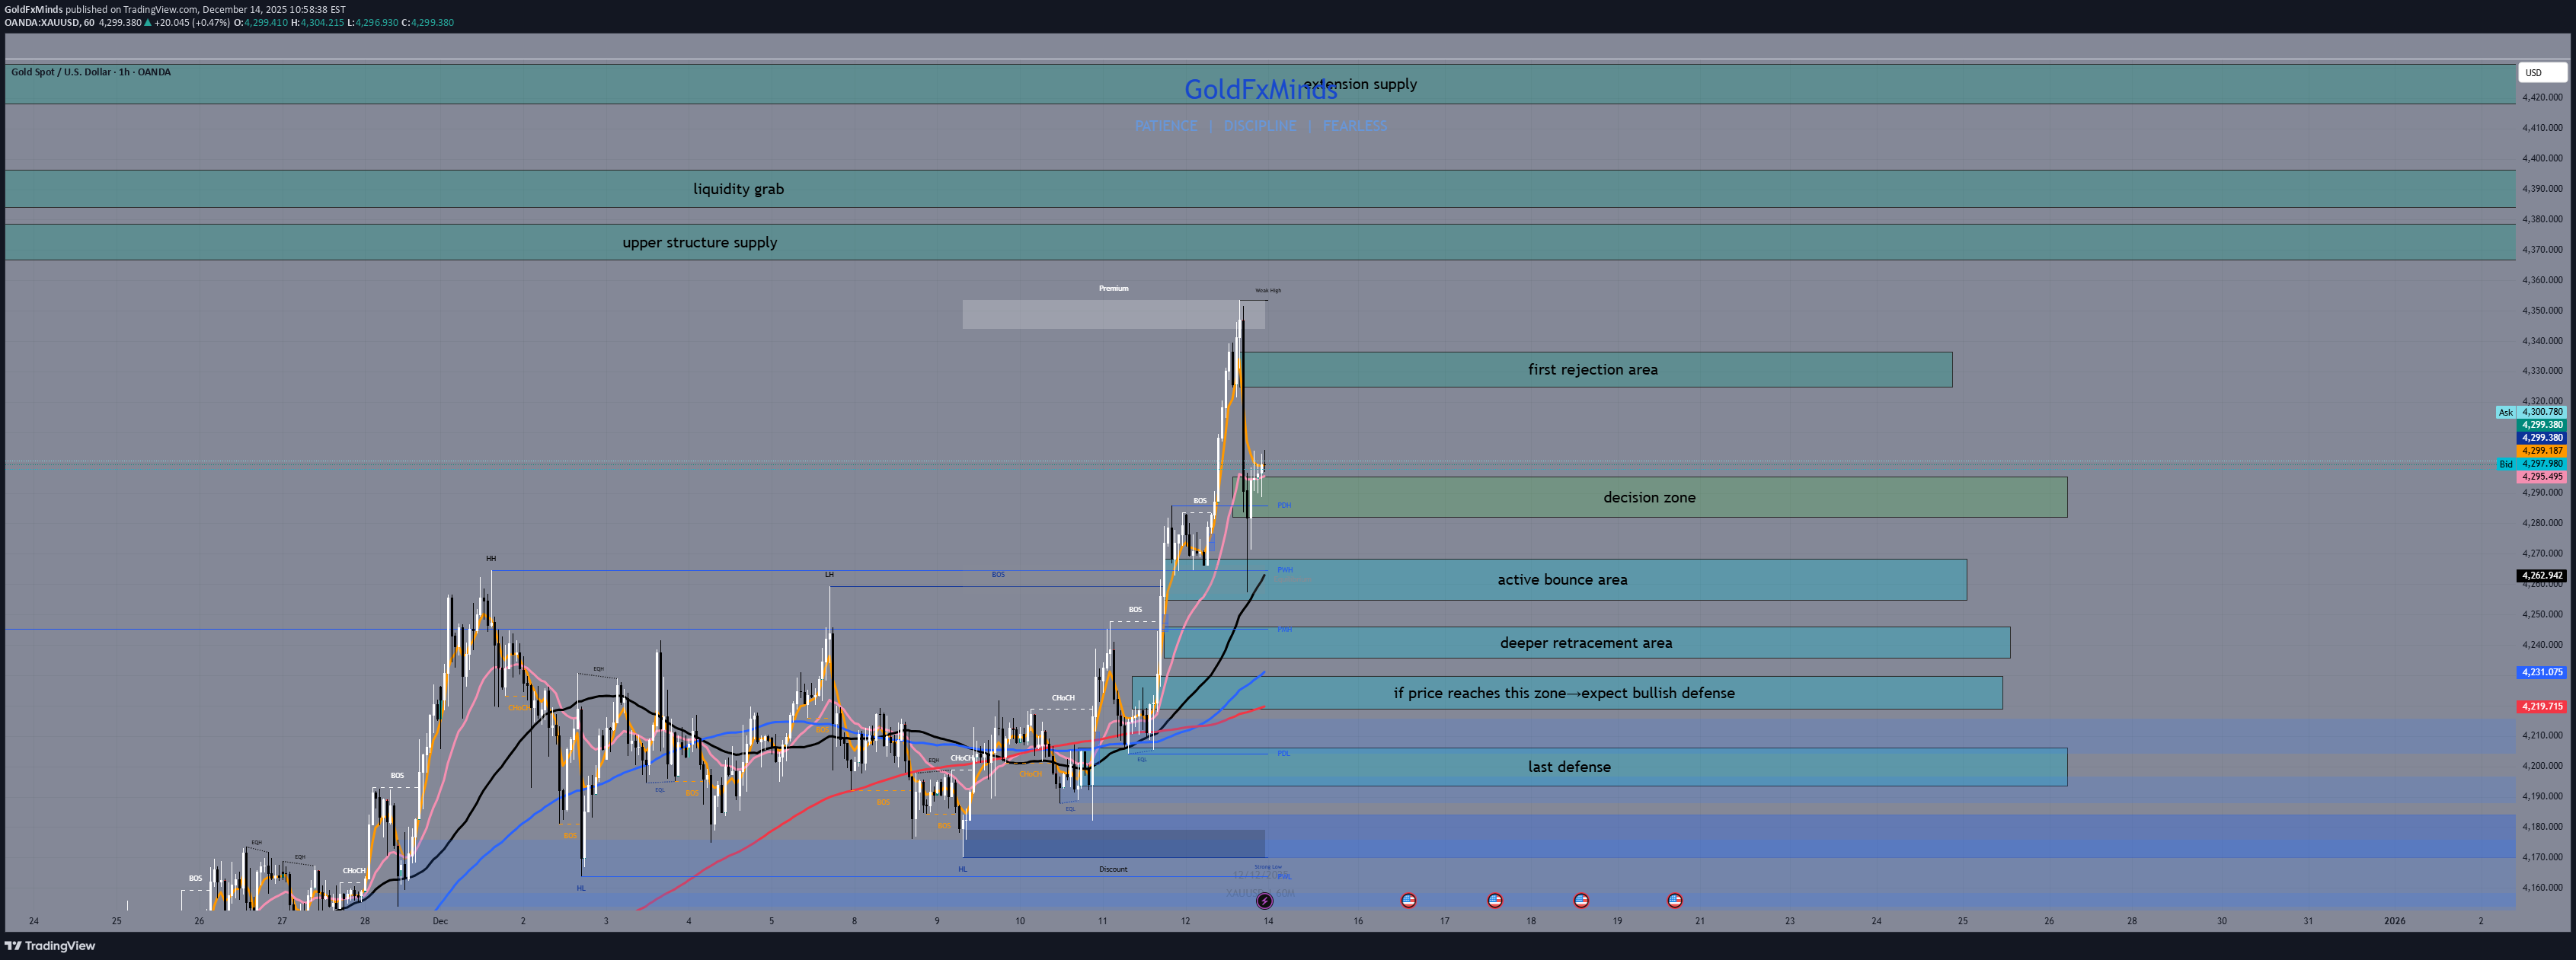
Hey traders, On the H1 chart, gold is still holding a bullish structure, but the market is clearly transitioning from impulse into reaction. The strong move from the lows already happened, and price is now sensitive to intraday supply while still respecting value below. This is no longer a market for chasing breakouts. It’s a market where levels matter more than speed. H1 Context After the last bullish impulse, price moved well above the short-term EMAs. That confirms strength, but also tells us that upside progress will likely come in steps, not in straight lines. Fibonacci retracement aligns with the EMAs below, defining clear buy zones, while structure and inefficiencies above define where selling pressure can appear. ⚪ H1 Decision Zone 4285 – 4295 This is the real decision area on H1. Here, price has slowed down and overlapped. This is where the market pauses and decides whether it has enough strength to continue higher or whether it needs to rotate lower first. Inside this zone, patience is key. A clean move away from it defines the next intraday leg. 🟦 H1 Buy Zones 4254 – 4268 | Bounce buy zone This zone already delivered a clean reaction. It aligns with the equilibrium of the last move and with the rising EMAs. If the structure remains bullish, buyers should be willing to defend this area again. 4234 – 4246 | Pullback buy zone A deeper retracement where the correction becomes clearer but still constructive. This zone often acts as a reload area before another attempt higher. 4218 – 4230 | Main pullback buy zone This is the core value area on H1. If price reaches this zone, the market is properly rebalancing the move. Buyers need to step in here to keep the intraday structure intact. 4194 – 4206 | Deep pullback buy zone This is the last buy area on H1. Below this zone, the bullish intraday structure starts to weaken. 🟥 H1 Sell Zones 4325 – 4335 | First rejection area This is the first intraday supply above price. Here, buying pressure can start to fade and the market may show its first signs of weakness. Best used for first rejection, not aggressive selling. 4366 – 4378 | Upper structure supply This zone is still part of the H1 structure. Price can stall or reject here without being overextended. Good area to watch for loss of momentum and failed continuation. 4384 – 4396 | Liquidity grab zone Above structure highs, stops are exposed. Spikes into this area are often fast and emotional, with higher rejection risk. Bullish Scenario If price holds above the 4285 – 4295 decision zone, the bullish scenario remains active. In that case: first upside test is 4325 – 4335 acceptance above that opens the door toward 4366 – 4378 further extension can reach 4384 – 4396, but momentum quality matters Bearish Scenario If price fails to hold the 4285 – 4295 decision zone, the market shifts into pullback mode. In that case: first reaction is expected at 4254 – 4268 deeper pullback can reach 4234 – 4246 stronger correction targets 4218 – 4230, with 4194 – 4206 as the last intraday defense As long as price holds above the deep buy zone, this remains a correction within a bullish structure. Final Thought On H1, gold is about progression, not prediction. Buy when price returns to value. Sell as price steps into layered supply. And when price sits in the decision zone, wait. Which supply do you think gets the reaction first: first rejection or upper structure? Drop your thoughts below and follow GoldFxMinds for clean intraday maps and disciplined execution.