Technical analysis by GoldFxMinds about Symbol PAXG on 11/15/2025

GoldFxMinds
طلا در نقطه عطف تاکتیکی: نبرد کلیدی برای تعیین مسیر آینده
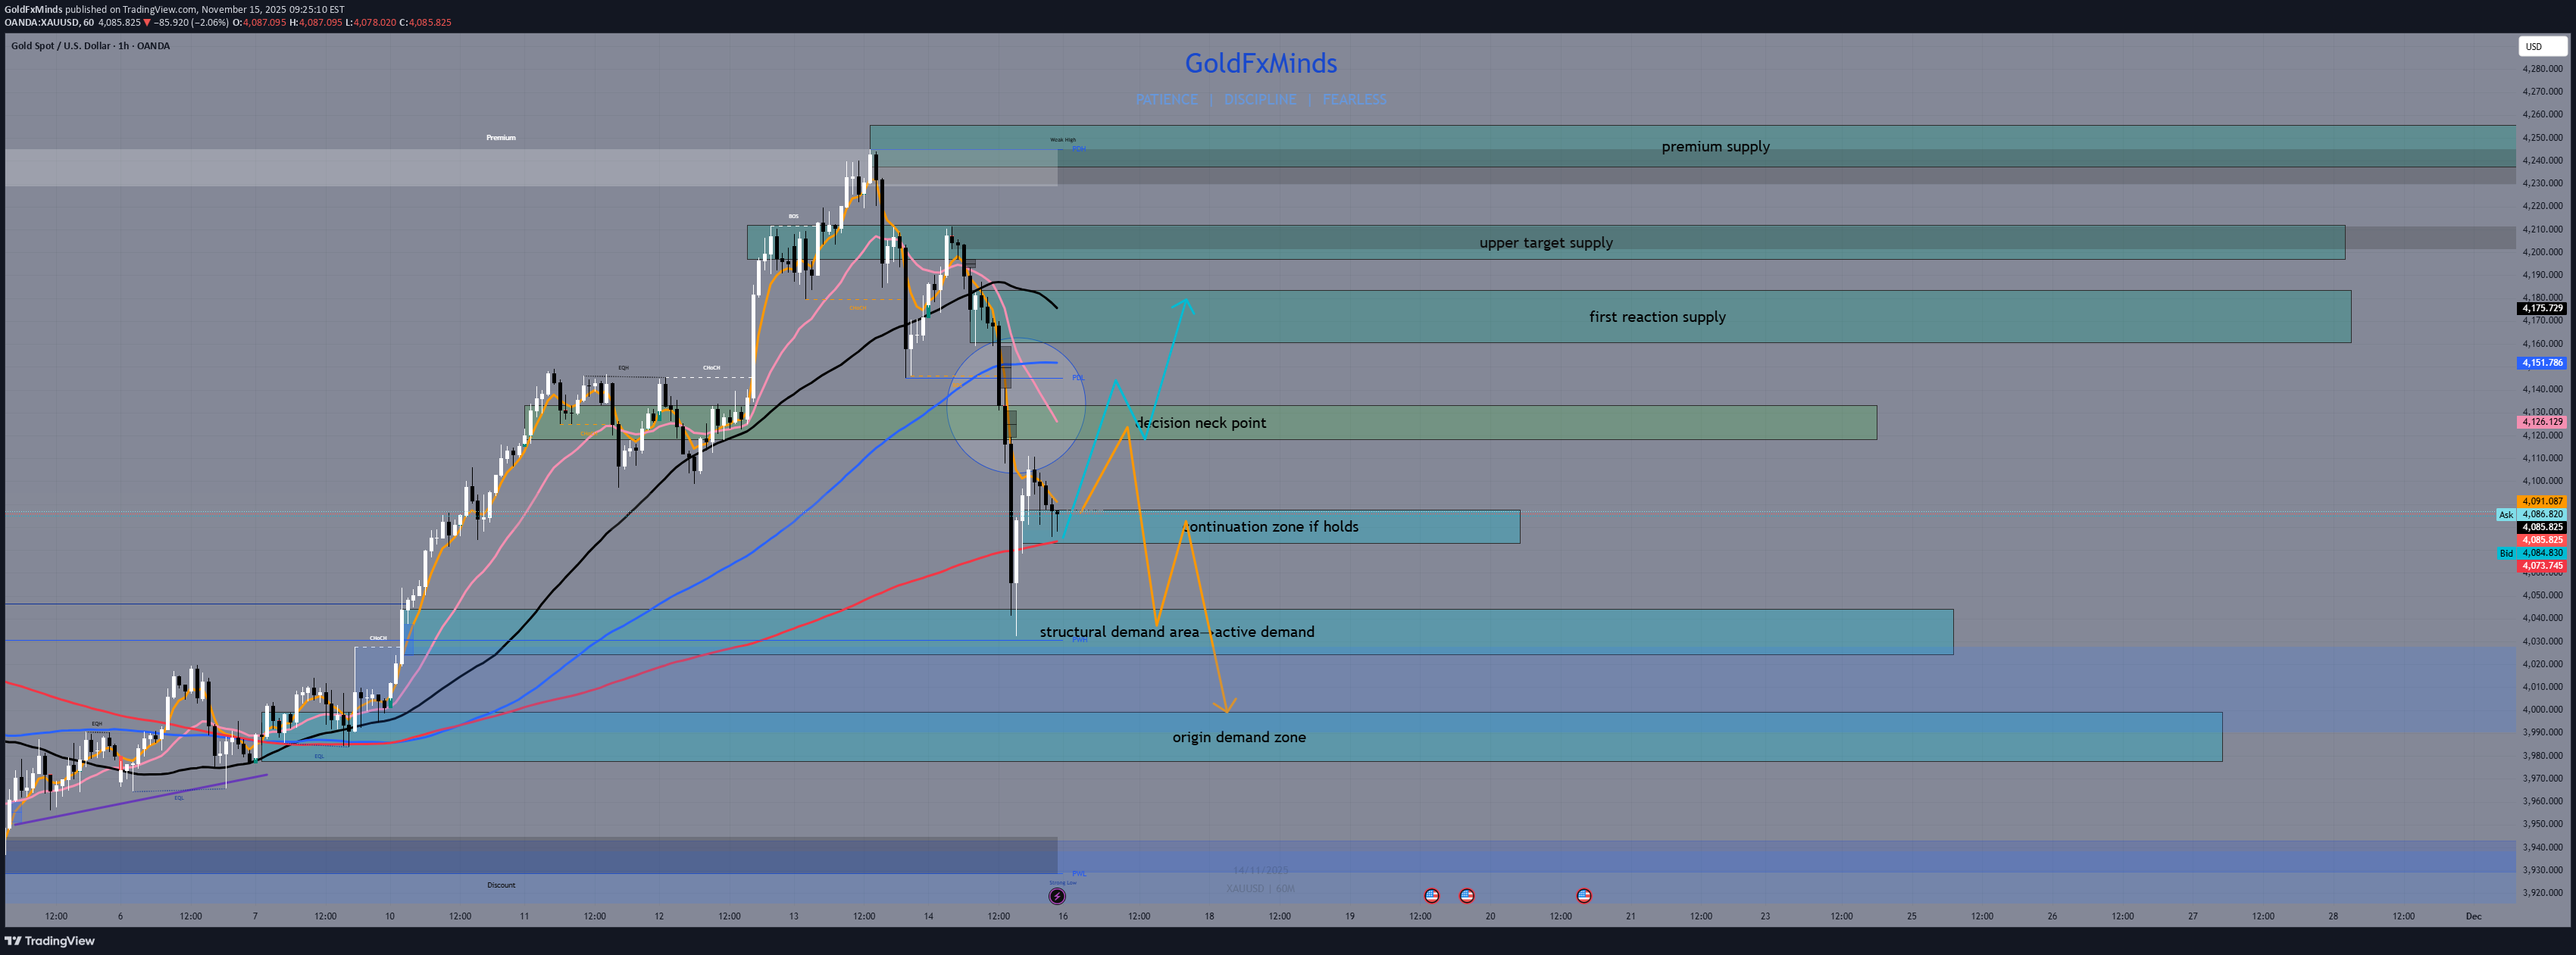
Hello traders, Gold enters the new week positioned right between reactive supply above and layered demand below, after completing a clean corrective leg from 4245 into 4085. The market is preparing for the next directional phase. 📰 Macro Pulse The week opens with markets waiting for fresh USD inputs — CPI impact continues to fade, while the dollar stabilizes ahead of mid-week catalysts. Gold stays supported by the broader HTF bullish macro trend, but the H1 chart is still navigating a corrective structure. This sets the stage for a tactical battlefield: buyers defending local demand, sellers guarding intraday supply. 🟥 H1 Supply Zones Above Price 1. First Reactive Supply 4 160 – 4 175 Where the impulsive selloff originated. A clean bearish OB with BOS confirmation — the first real ceiling intraday. 2. Upper Continuation Supply 4 197 – 4 211 The zone that extended bearish displacement. Strong continuation footprint. 3. Premium Extension Supply 4 240 – 4 255 Premium-level resistance. If gold reaches here, buyers are likely already overextended. 🟦 H1 Demand Zones Below Price 1. Continuation Demand Base 4 073 – 4 087 The demand currently holding price. Not a reversal zone, but an active continuation base. 2. Structural Demand Layer 4 027 – 4 044 The first deep structural support, matching the core of the bullish leg from early November. 3. Origin Demand Zone 3 986 – 4 000 The true origin of the full impulse 3980 → 4245. Ultimate downside limit before momentum structurally shifts. ⚪ Decision Zone H1 Mid-Range Imbalance 4 118 – 4 132 A clean Fair Value Gap that sits right at the mid-range of current structure. This zone will decide whether gold sets a deeper retrace or rotates upward. 🎯 Battlefield Map Gold opens Monday inside a compression between Continuation Demand Base and the mid-range imbalance, meaning H1 will choose direction early in the session. Acceptance above 4 118–4 132 shifts momentum back toward supply. Rejection keeps the correction alive and exposes deeper demand. 📌 Bullish Scenario Buyers defend 4 073–4 087, reclaim the imbalance at 4 118–4 132, and push toward: ➡️ First Reactive Supply (4 160 – 4 175) Above that, extension targets open toward ➡️ Upper Continuation Supply (4 197 – 4 211) 📌 Bearish Scenario Failure to reclaim the imbalance sends price back into deeper levels: ➡️ Structural Demand Layer (4 027 – 4 044) Loss of that zone exposes ➡️ Origin Demand Zone (3 986 – 4 000) which is the last structural defense of the bullish November leg. 🧭 Conclusion H1 is still in a corrective phase inside a bullish HTF macro environment. The 4 118–4 132 imbalance is the key battleground that will decide whether buyers regain control or sellers extend the correction. What do you think about this H1 map? Drop your thoughts below, leave a like, and follow for more premium precision outlooks. 🚀✨