
FalconLineTrading
@t_FalconLineTrading

What symbols does the trader recommend buying?
Purchase History
پیام های تریدر
Filter
FalconLineTrading
MKR
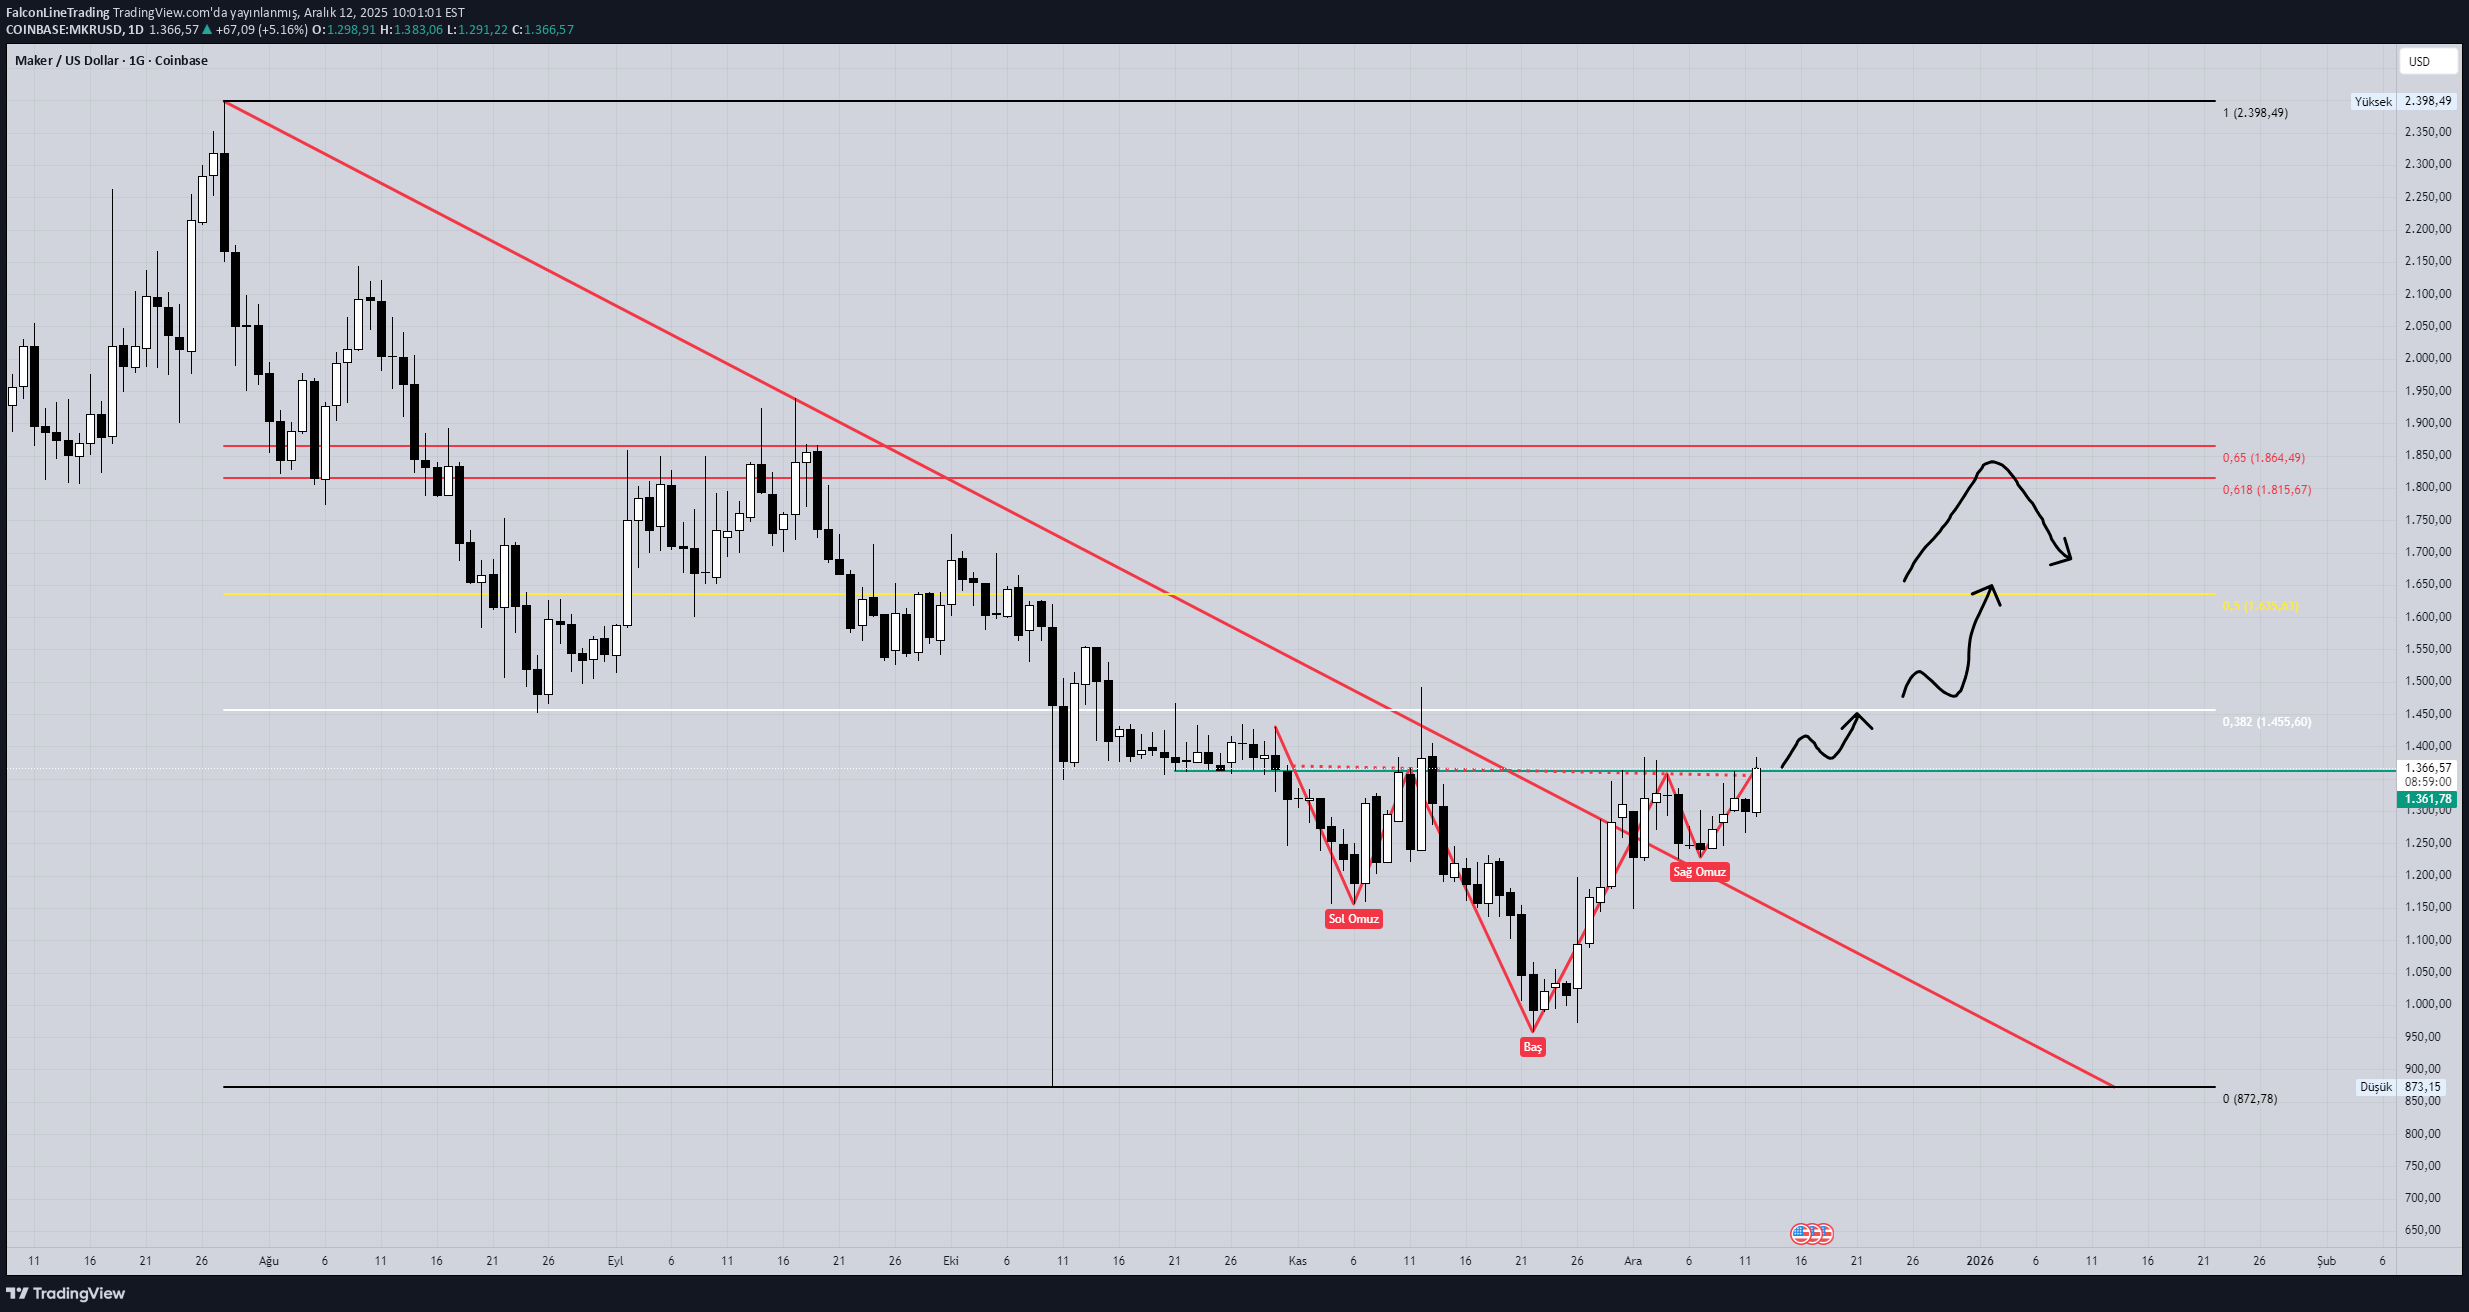
MKR It broke the falling trend that lasted for 5 months. TOBO formation occurred on the daily chart. I drew on the chart the price movements that I predicted would follow as the resistance levels were broken.
FalconLineTrading
الگوی هارمونیک اتریوم: آیا قیمت به هدف مورد انتظار میرسد؟
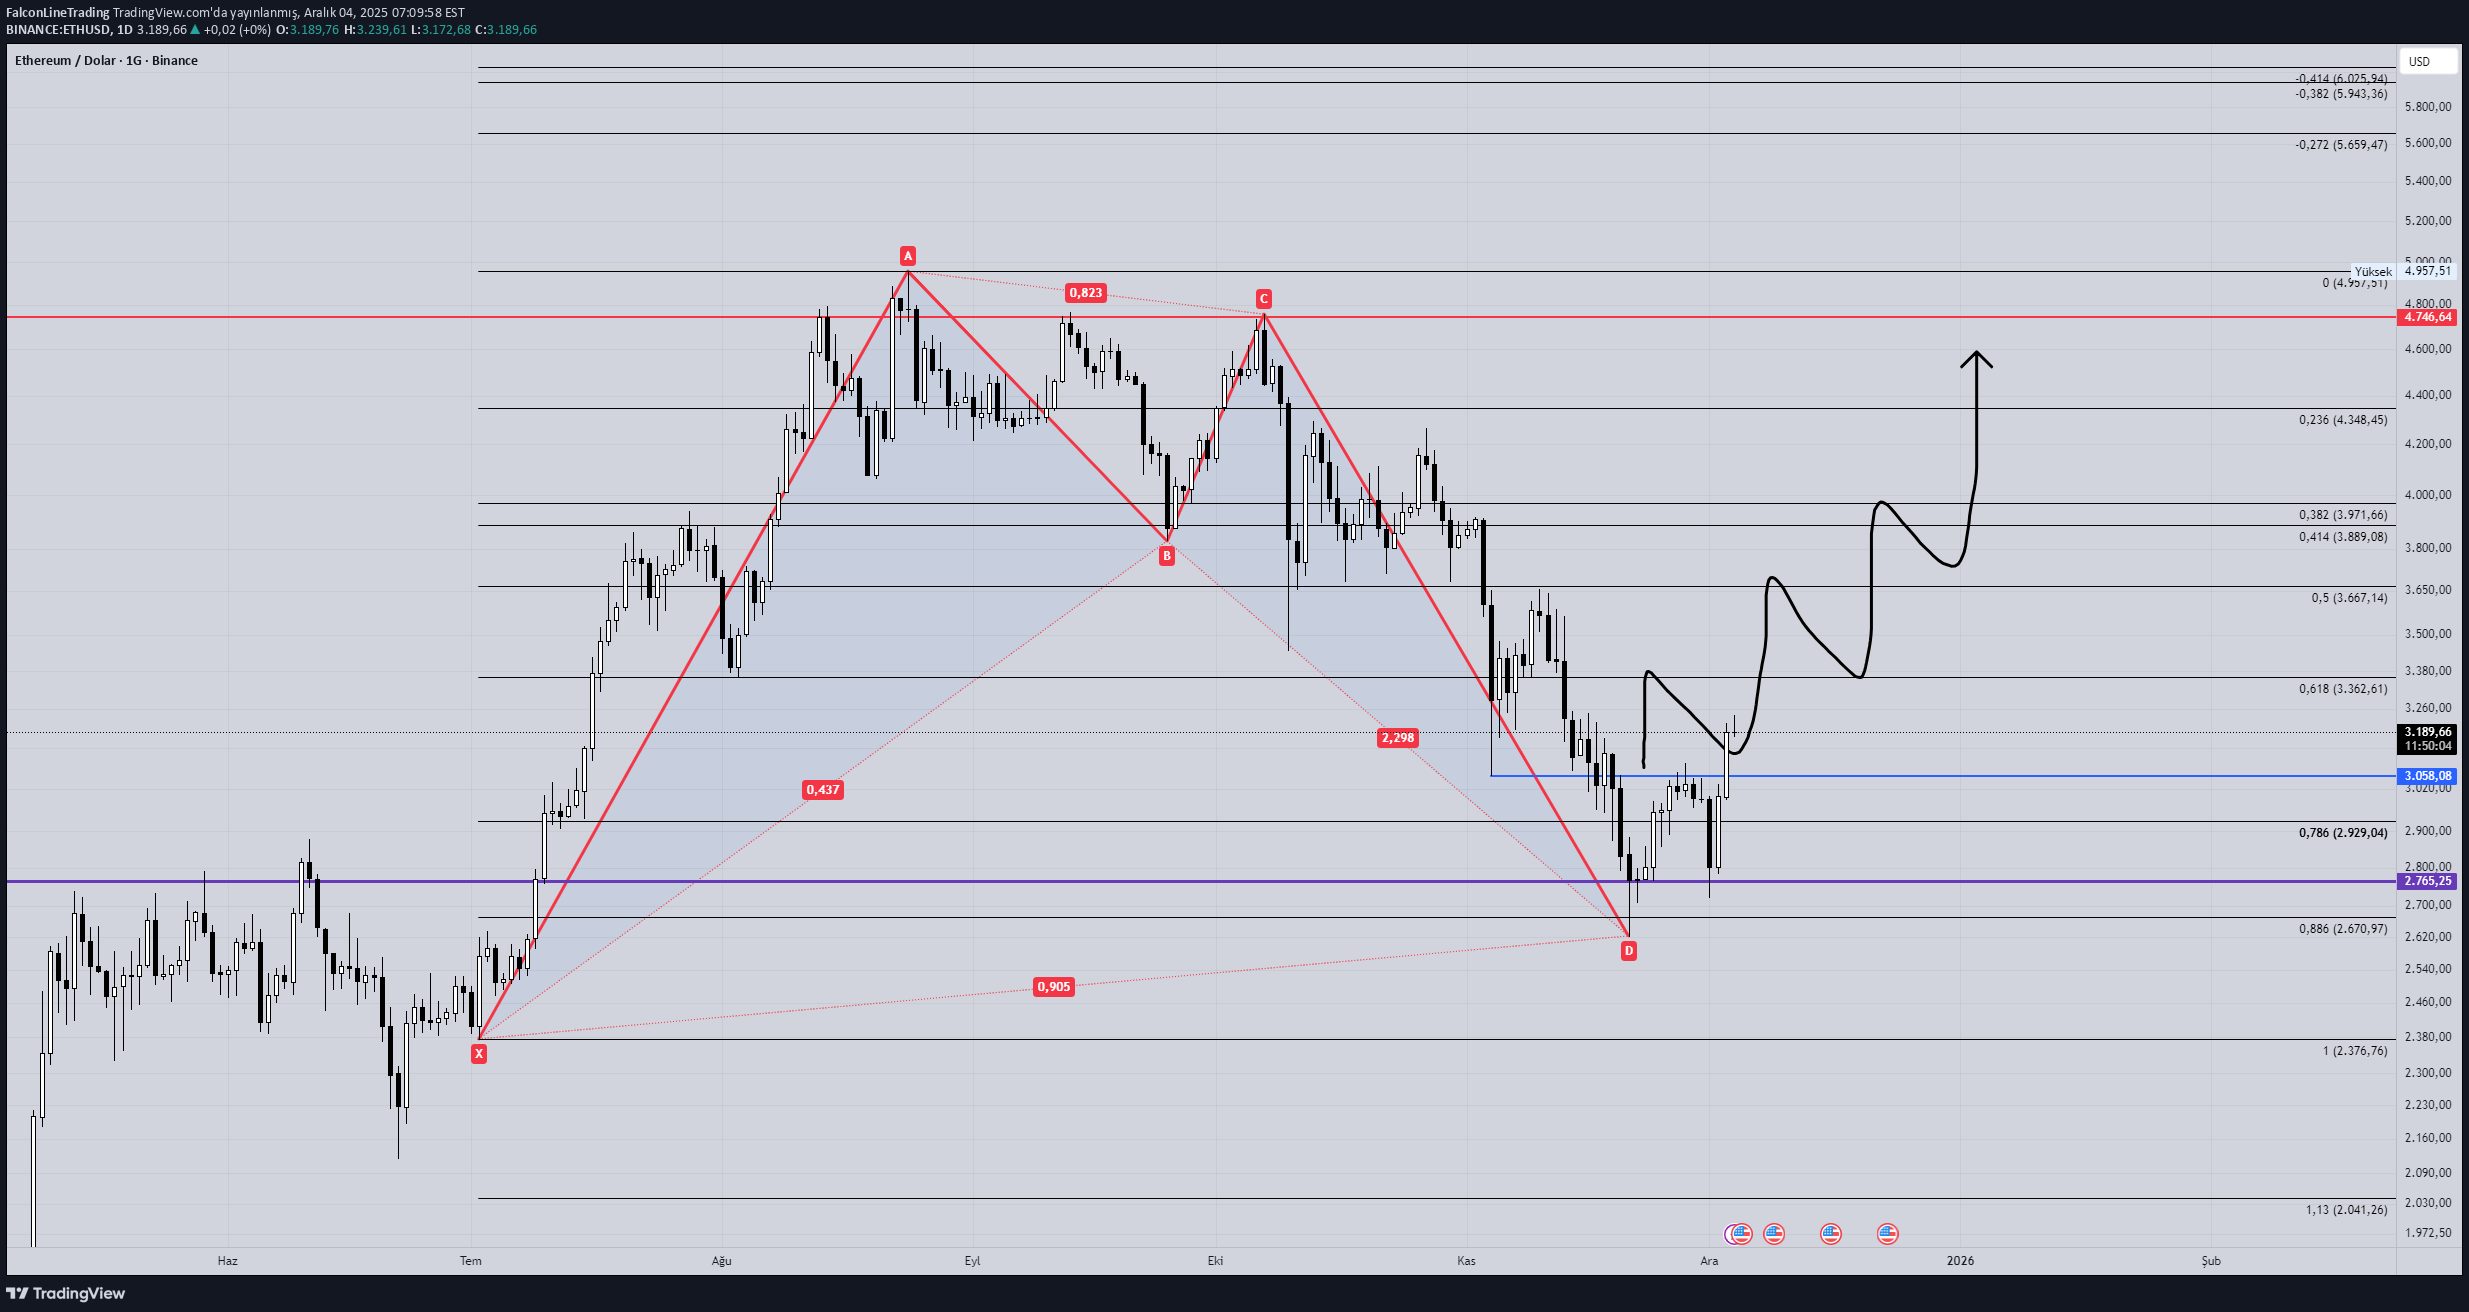
Ethereum Harmonic pattern has occurred on the daily chart, the risk of disruption of the structure is very low for now. Let's see if it will reach the goal I expect.
FalconLineTrading
Ontology (ONT): آیا این کوین به کف قیمتی رسیده؟ استراتژی خرید پلهای برای سود ۳۰۰٪!
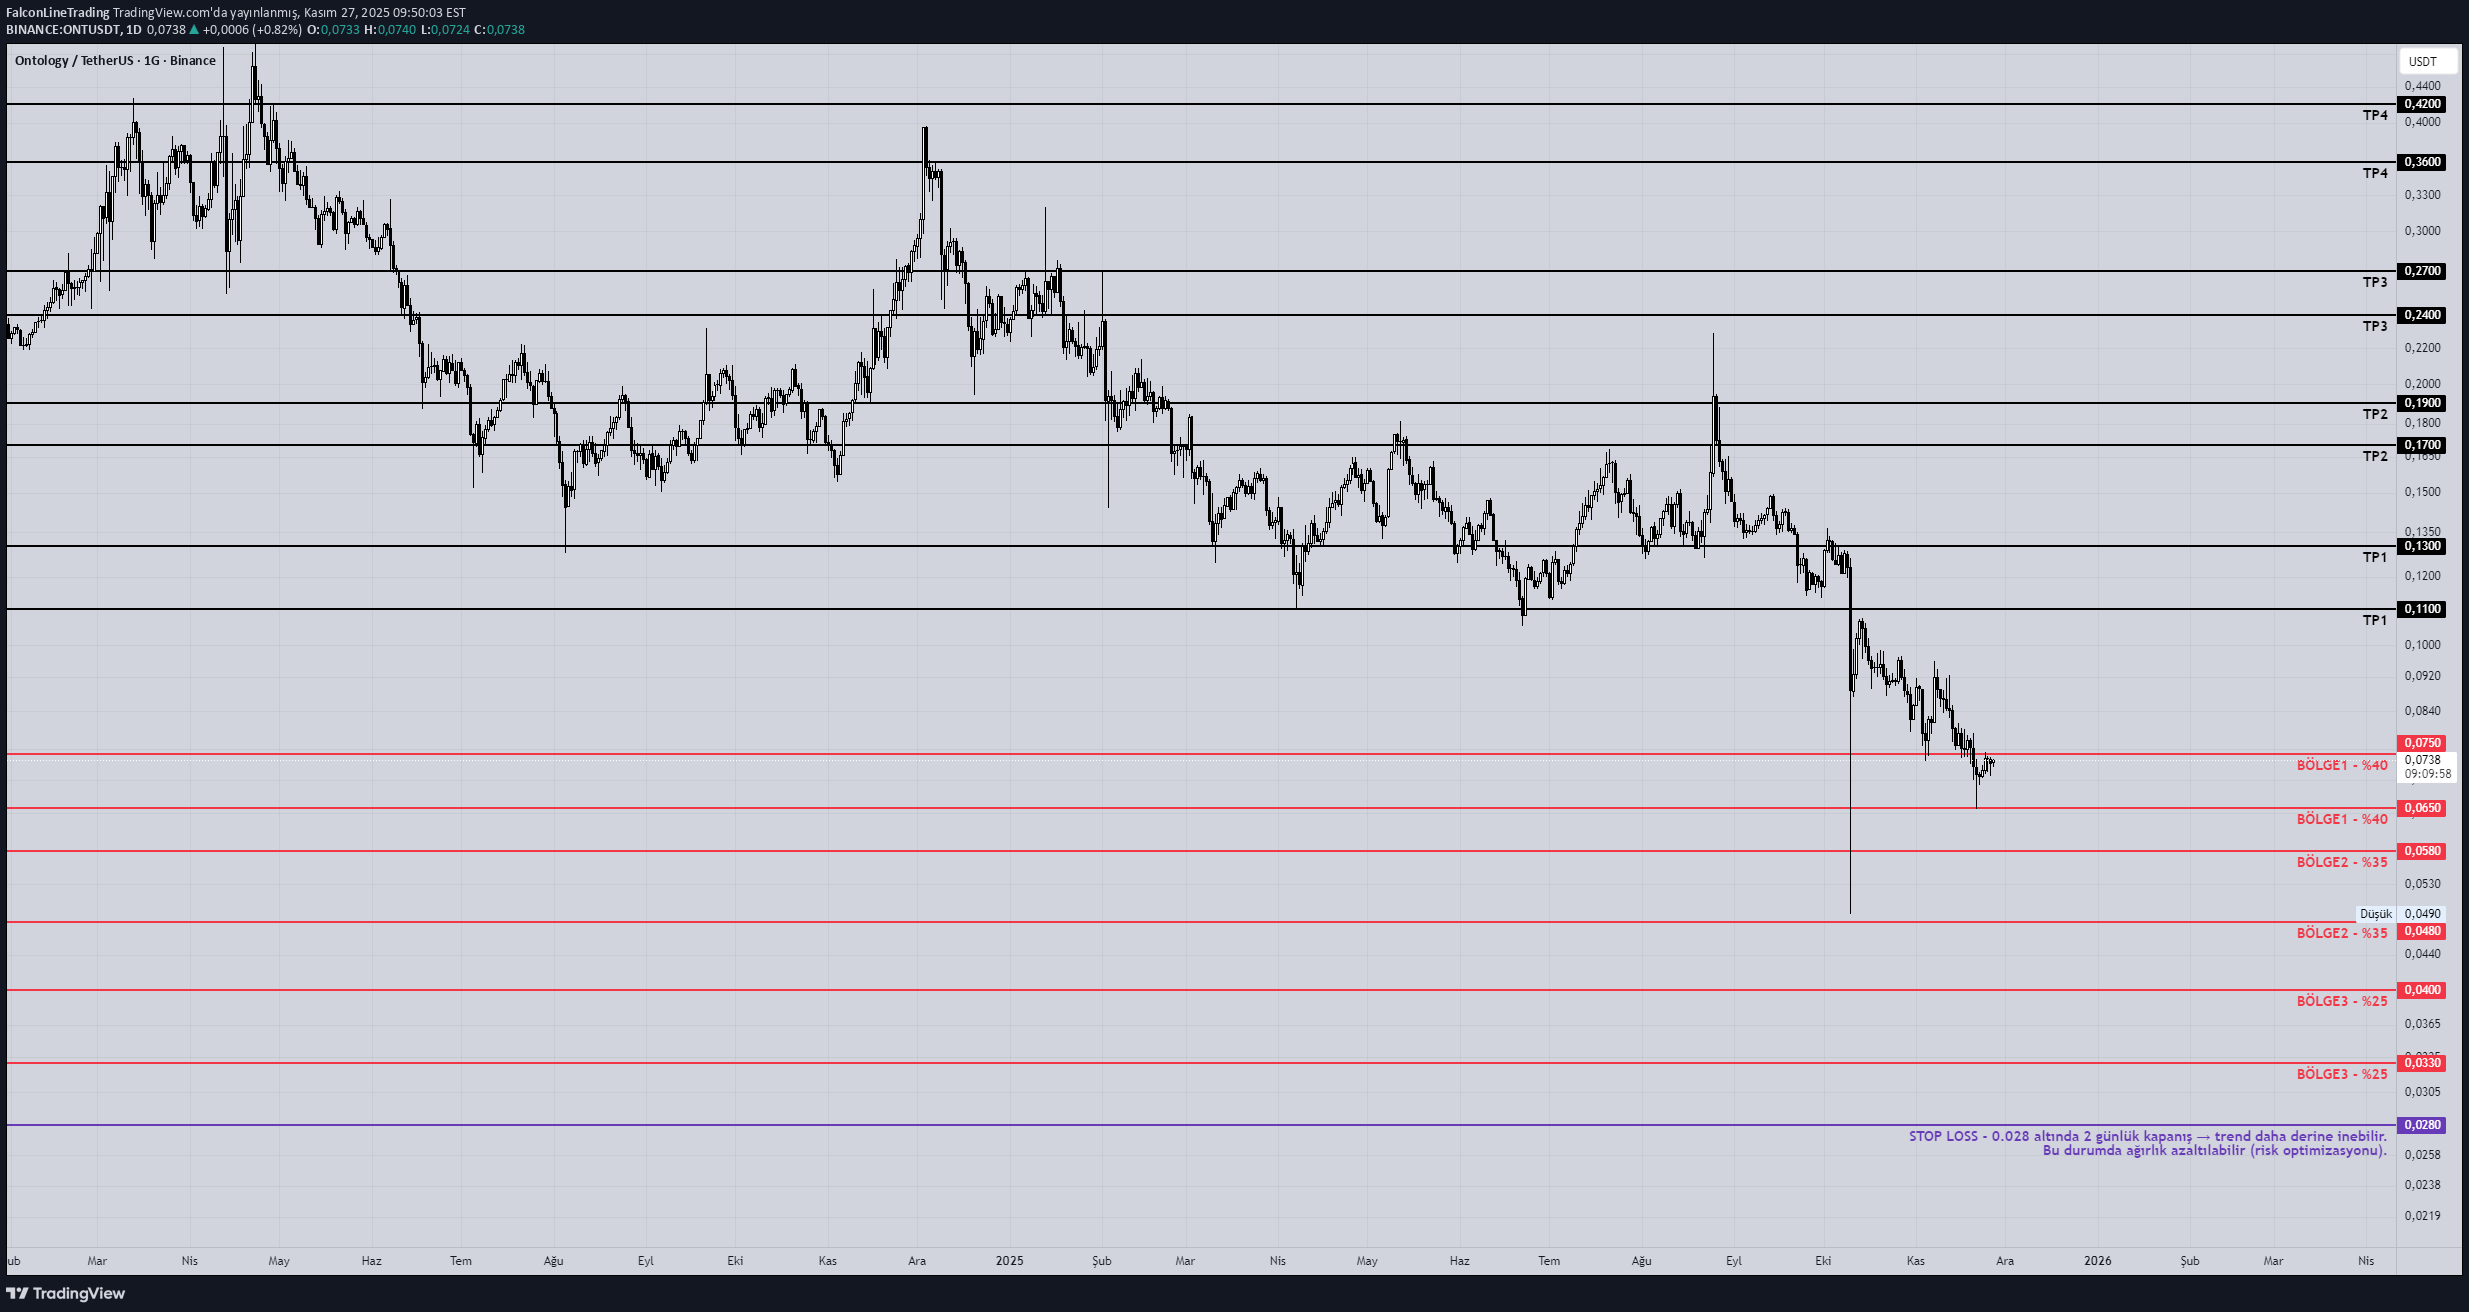
Ontology (ONT) — December 1, 2025 MainNet V3.0.0 Confidence: 100% Impact Analysis •New tokenomics + locked liquidity •This type of updates reduces supply pressure → positive Market Impact •Minor rise before the event •Not large cap → Pump/dump risk is high ----------------------------------------------- ONT – Multi-Term Trend Diagnosis 1M (Monthly) – Macro Trend It has been in a persistent downtrend since 2018. All highs are lower → all lows are lower. Monthly candles have long shadows and weak bodies → aggressive seller pressure. Volatility has decreased in recent months → bearish fatigue + signal of an upcoming bottom. Monthly outlook: Strong bear trend but approaching the bottom zone. 1W (Weekly) – HTF Yapı There has been a descending channel and a stable downward flow in the weekly for the last 2 years. There was a liquidity “flush” in two places: 0.06 region 0.05–0.045 region These wicking areas are typical fundraising bottoms. Weekly → bottom range: 0.045 – 0.065 1D (Daily) – Midterm Trend Every lower high broken on the daily → seller strength prevails. RSI, vol and market structure tell the same story: The trend is down but the momentum is weakening. 0.07–0.08 region is minor resistance. celebrity view: Reactions come, but the trend has not returned. 4H (Operation Time) – LTF Entry Fields In 4H, the range between 0.06 and 0.065 has been defended over and over again. LTF bullish market structure but there is no continuation. The rising trend does not start → this region is in the “accumulation under distribution” class. 4H: The best entry area is only in the bottom areas. ONT – Spot Strategy (Gradual, Professional) Classic retail mistake: “Will he return from here?” To buy from the middle. StrategyM: Low risk + multi-time confirmation + event aware dip buying. PURCHASE ZONES (Spot Accumulation) 1) Zone A – 0.065 – 0.075 Uptake: 40% 4H demand area Where daily bounces begin First liquidity return happens here 2) Zone B – 0.048 – 0.058 Uptake: 35% Weekly bottom pool Corporate long-term collection Strongest historical support 3) Zone C – 0.033 – 0.040 Purchase: 25% Monthly liquidity clearing Capitulation zone If it returns from here, it gives a cycle reversal with 300–500% potential. STOP-LOSS Logic (For Spot) I do not recommend hard SL in spot strategy, but: 2-day close below 0.028 → trend may go deeper. In this case, the weight can be reduced (risk optimization). TP Levels (Professional Exit Plan) TP1 – 0.11 – 0.13 4H+1D main distribution line First realization zone TP2 – 0.17 – 0.19 2024–2025 horizontal resistance zone TP3 – 0.24 – 0.27 Midterm range top In-cycle mini hills TP4 – 0.36 – 0.42 Main bullish scenario major wick filling area after 2021 Critical Note (Event Aware Strategy) Bro, this ONT strategy I gave you was optimized to be compatible with the event grids you sent: Risk-on event: Buying from Zone A is made aggressive. Risk-off event: It makes sense to wait in Zones B and C and target deeper bottoms. High-volatility macro trigger: HTF points to the bottom regions (0.048–0.055). Summary: ONT What Does It Say? In macro bear trend, Close to the bottom area, Trend reversal has not started yet, But it has become the area of interest of large funds. Coins from this structure generally have cycle returns between +200% and +600%. The main thing is to take it gradually and be patient.
FalconLineTrading
QTUM زیر ذرهبین: هالوینگ مهم، تحلیل عمیق تکنیکال و استراتژی خرید 3 مرحلهای تا 5.40 دلار!
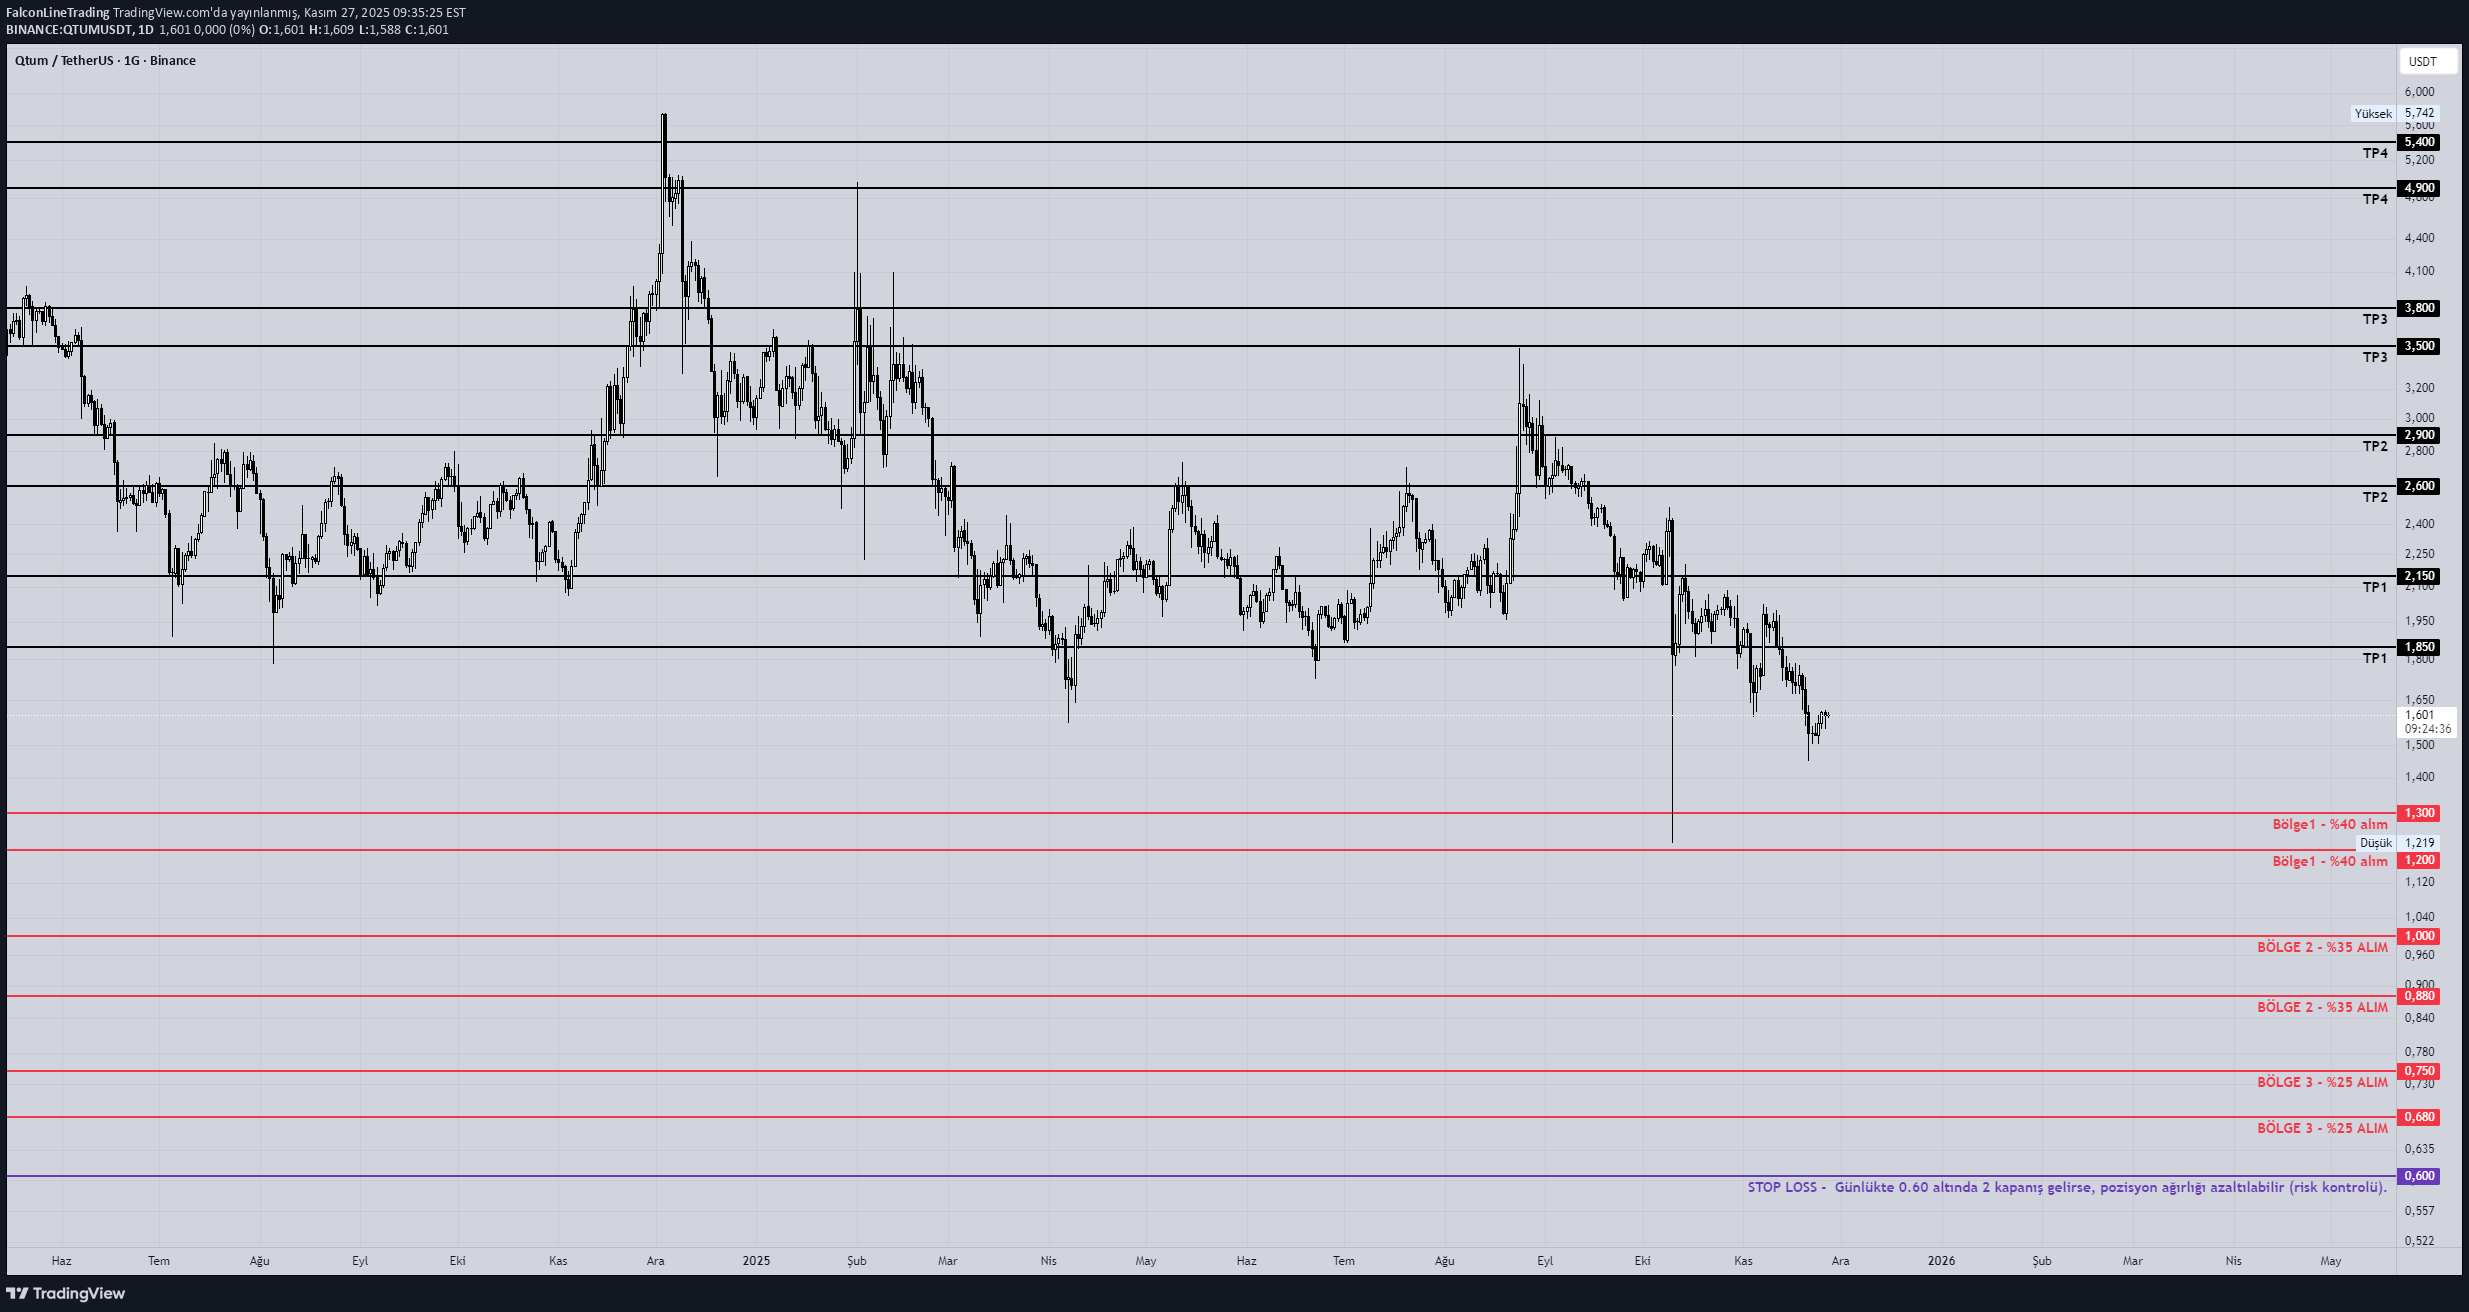
QTUM — November 30, 2025 Halving Confidence: 94% Impact Analysis •Block reward 0.5 → 0.25 •Supply shock is high → In old coins, the halving effect usually comes late but hard. Market Impact •Pre-halving: speculative rise •Post-halving: 7–30 days horizontal → then potential trend. critical Since its long-term volume is low, the rate of manipulative action is high. ________________________________________ 6) QTUM — January 12, 2026 Hard Fork Category: Network update Impact Analysis •Bitcoin + Ethereum upgrade combination → technical update is good. •The price impact is moderate. Market Impact •Fork news supports the price for 1–2 weeks after the halving. ---------------------------------------------- QTUM – Multitimeframe Analysis (1M / 1W / 1D / 4H) 1M (Monthly) – Macro Trend The main trend on the monthly chart since 2018 is down. All increases ended as lower high → macro trend down. Even the last 12 months of movement is like a “mini distribution” → buyers are weak. Macro demand appears to be only in the 0.70 – 1.00 USDT band. The monthly outlook is neutral-negative. 1W (Weekly) – Structural Condition There is a falling channel on the weekly, but there is no breakout yet. HTF does not recover structure, it is just a horizontal-collapse (grind) formation. His latest rise is liquidity cleansing → there is no continuation. The funds are not aggressive in this chart, it is purely a “collect cheap” mode. The weekly tells us that the bottom mark has not yet formed. 1D (Daily) – Midterm Trend There is no obvious market structure shift in the diary. The bottoms are breaking, the tops are not breaking → trend down. However: There is a reactive purchase of 1.20 – 1.35 per day, so the demand is not completely dead. Daily outlook: short-term bounce potential but trend has not reversed. 4H (Operation Time) – Entry Triggers 4H shows the clearest part: The 1.20 – 1.30 region is a constantly defended demand area. There is no LTF uptrend → just a bounce. Volatility is low, which could mean “buying behind closed doors.” Only bottom zones make sense for 4H entry. QTUM – Spot Strategy (Level Based, Risk Controlled) Bro, I am creating a 3-stage accumulation plan with a completely professional risk management logic. BUYING ZONES (Spot) 1) Zone A – 1.20 – 1.30 Uptake: 40% Reason: 4H+1D claim defense The area where the first reactions came from Ideal for scalp/short-term bounce 2) Zone B – 0.88 – 1.00 Uptake: 35% Reason: 2019–2020 macro HL region HTF demand pool Collection area of large funds 3) Zone C – 0.68 – 0.75 Purchase: 25% Reason: Monthly low The strongest support in the macro structure Same area as “Capitulation wick” levels Coins purchased from here generally carry cycle reversal. STOP-LOSS Logic We do not use hard SL in spot trading. However: If there are 2 closes below 0.60 on the daily, the position weight can be reduced (risk control). TAKE PROFIT (TP) Zones TP1 (Short Term): 1.85 – 2.15 4H macro resistor. TP2 (Medium Term): 2.60 – 2.90 2023 is the critical turning point. TP 3 (Main Target): 3.50 – 3.80 Main distribution area – strongest target in the cycle. TP4 (Long Term): 4.90 – 5.40 Liquidity cleared spike zone → possibility of fill the wick. QTUM SUMMARY Macro = weak Midterm = neutral-negative In the short term = just bounce Real buying opportunity = in alt bands A strong upward movement only begins with a weekly close above 3.00.
FalconLineTrading
تحلیل تخصصی TAO: استراتژی خرید و فروش پیش از هاوینگ دسامبر ۲۰۲۵
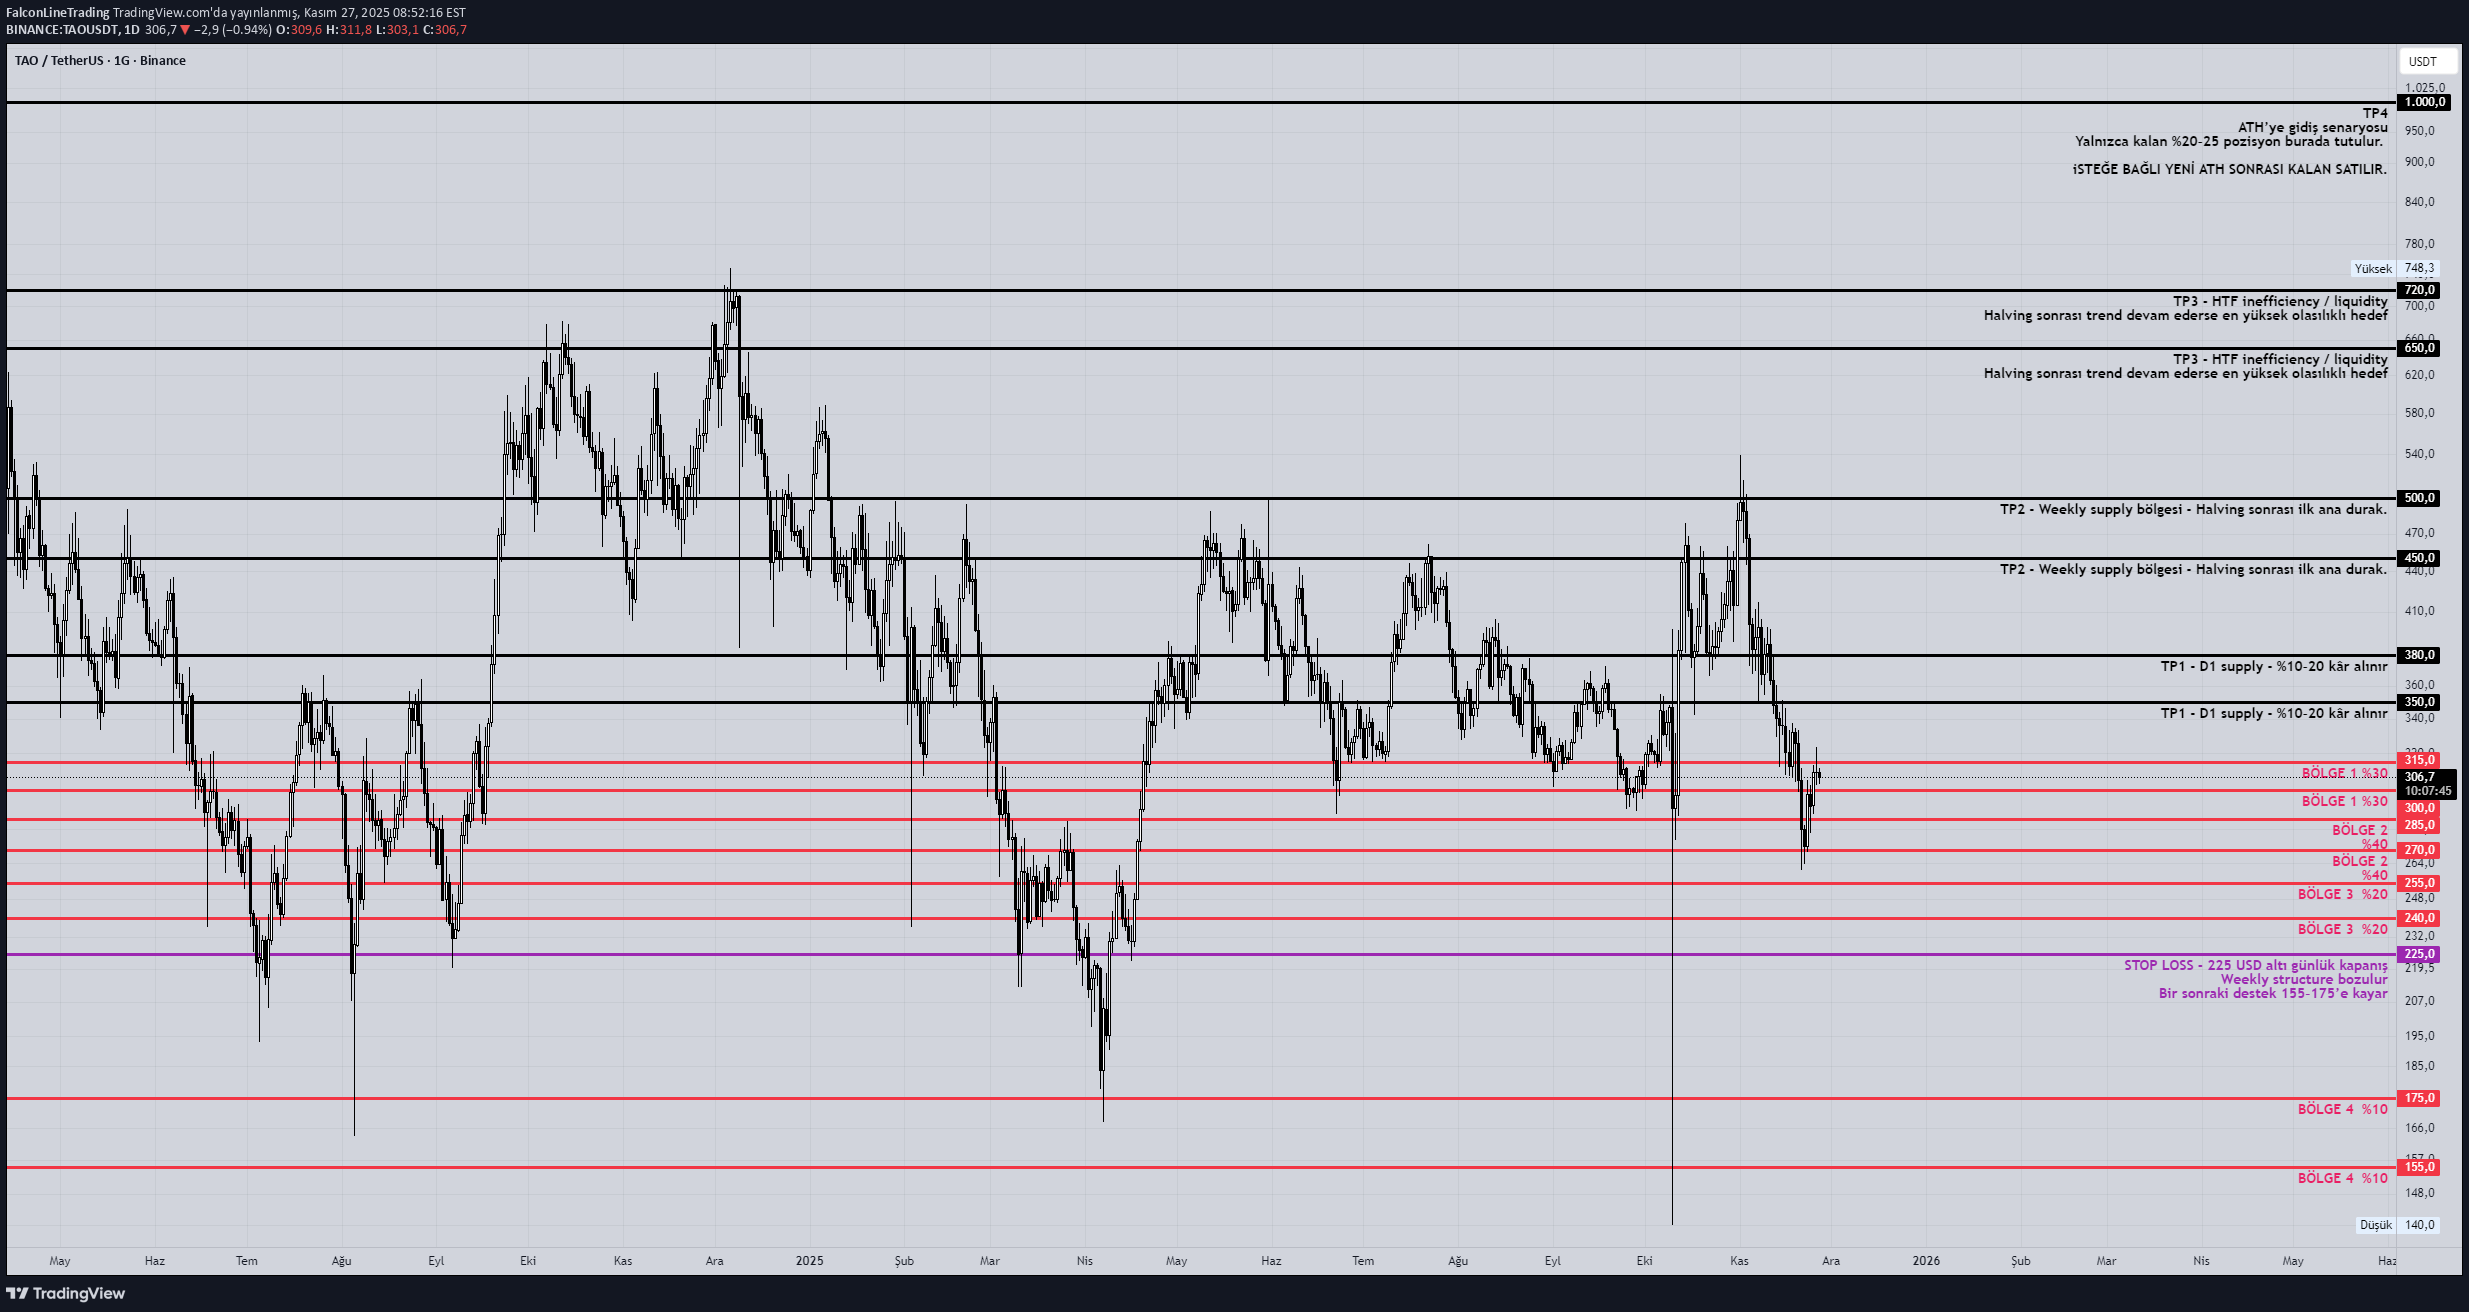
Bittensor (TAO) — December 10, 2025 Halving Confidence: 92% Impact Analysis •Halving = production decreases → supply shock → very strong bullish catalyst if combined with AI hype. •TAO It is already a hype-driven coin, if it works after the halving, it may even go parabolic. Market Impact •Pre-event reaction: strong pump •After: Similar to BTC halving pattern → horizontal for 5–10 days → continuing trend possible. Risk Hype If it overheats, it may “buy the rumor, sell the news”. ________________________________________ 1) TAO – Monthly (1M) Macro Analysis What I see from the chart: TAO It is still a very young asset and the macro trend cannot be read properly. However, there is an all-time wick of 1557 USD extreme liquidity point. Currently, the price is stuck in the 300–330 USD band. Structure of the last 4–5 months: large wicks (liquidity hunt) HL–LL mixed “expanding range” 1M Result: TAO has a “trendless but explosive” macro structure. Halving → may break this structure upwards with a long-term supply shock. 2) TAO – Weekly (1W) Critical areas on the weekly chart: 410–450 USD → weekly major supply 260–280 USD → weekly demand 215–230 USD → weekly liquidity flush zone 155 USD → max capitulation level Price currently: 300–330 USD → full weekly midrange. 1W Result: It has an incredibly clean "pre-halving accumulation range" structure. This is similar to BTC's 2019–2020 pre-halving range. 3) TAO – Daily (1D) Clear zones in the log: 350–380: daily supply 300–315: daily flip zone 270–280: D1 demand 240–255: clean imbalance + sweep region 155: extreme capitulation wick 1D Result: Even though the daily structure shows a downward bias, every bottom can be taken aggressively as the halving approaches. 4) TAO – 4H Operational The 4H chart gives us timing: It cannot stay above 320–330 → this is the “short-term rejection zone” 295–305 → micro support 270–280 → ideal swing long zone 240–250 → liquidation trap zone 155 → abnormal wick 4H Result: The purpose of the first arm is to verify that the price is still range-bound. Now the main part: TAO HALVING (December 10, 2025) Spot Strategy Event strength for TAO is too high (9.5/10). That's why I combine the strategy with the “BTC pre-post halving pattern”: First the bottom, then the event pump Short consolidation continues after the event This pattern seems to fit perfectly in TAO. 1) Spot Purchase Regions I divide the budget by assuming 100: District 1 — Conservative Entry (Start) 300 – 315 USD 30% D1 flip zone The first starting point of the breakout before halving Zone 2 — Primary Accumulation Zone 270 – 285 USD 40% 1W demand 4H OB compliance The healthiest login area for TAO Zone 3 — Deep Buy / Liquidity Sweep Zone 240 – 255 USD 20% → Perfect level for big players to clear stops and hit higher before the halving Zone 4 — Tail Risk Opportunity (In Case of Excessive Dump) 155 – 175 USD 10% → Rare events → A similar needle may repeat itself as the halving approaches Projected Ascension Phases for TAO (TP Plan) TP1 — 350–380 USD D1 supply 10–20% profit taken TP2 — 450–500 USD Weekly supply zone First main stop after halving TP3 — 650–720 USD HTF inefficiency / liquidity The highest probability target if the trend continues after halving TP4 — 1000+ USD Scenario of going to ATH Only the remaining 20–25% of the position is held here Stop-Loss (Risk Management for Spot) Hard SL is not required in spot, but structural invalidation is like this: Six-day close of 225 USD → Weekly structure is broken → Next support slides to 155–175 Event Time Management 10–20 Days Before: The bottom is collected 270–285 most critical region The period when Makers collect liquidity Event Week: 10–30% pump TP1 comes easy 1–4 Weeks After Event: consolidation TP2 and TP3 are targeted If the trend continues, 650+ will come TAO General Conclusion TAO's price structure gives a classic "explosive post-halving" setup with the combination of accumulation range + big event. Every dip is a buying opportunity, every uptick is a liquidity clearing.
FalconLineTrading
ارتقاء بزرگ اتریوم (Fusaka) در دسامبر 2025: استراتژی خرید و اهداف قیمتی شگفتانگیز!
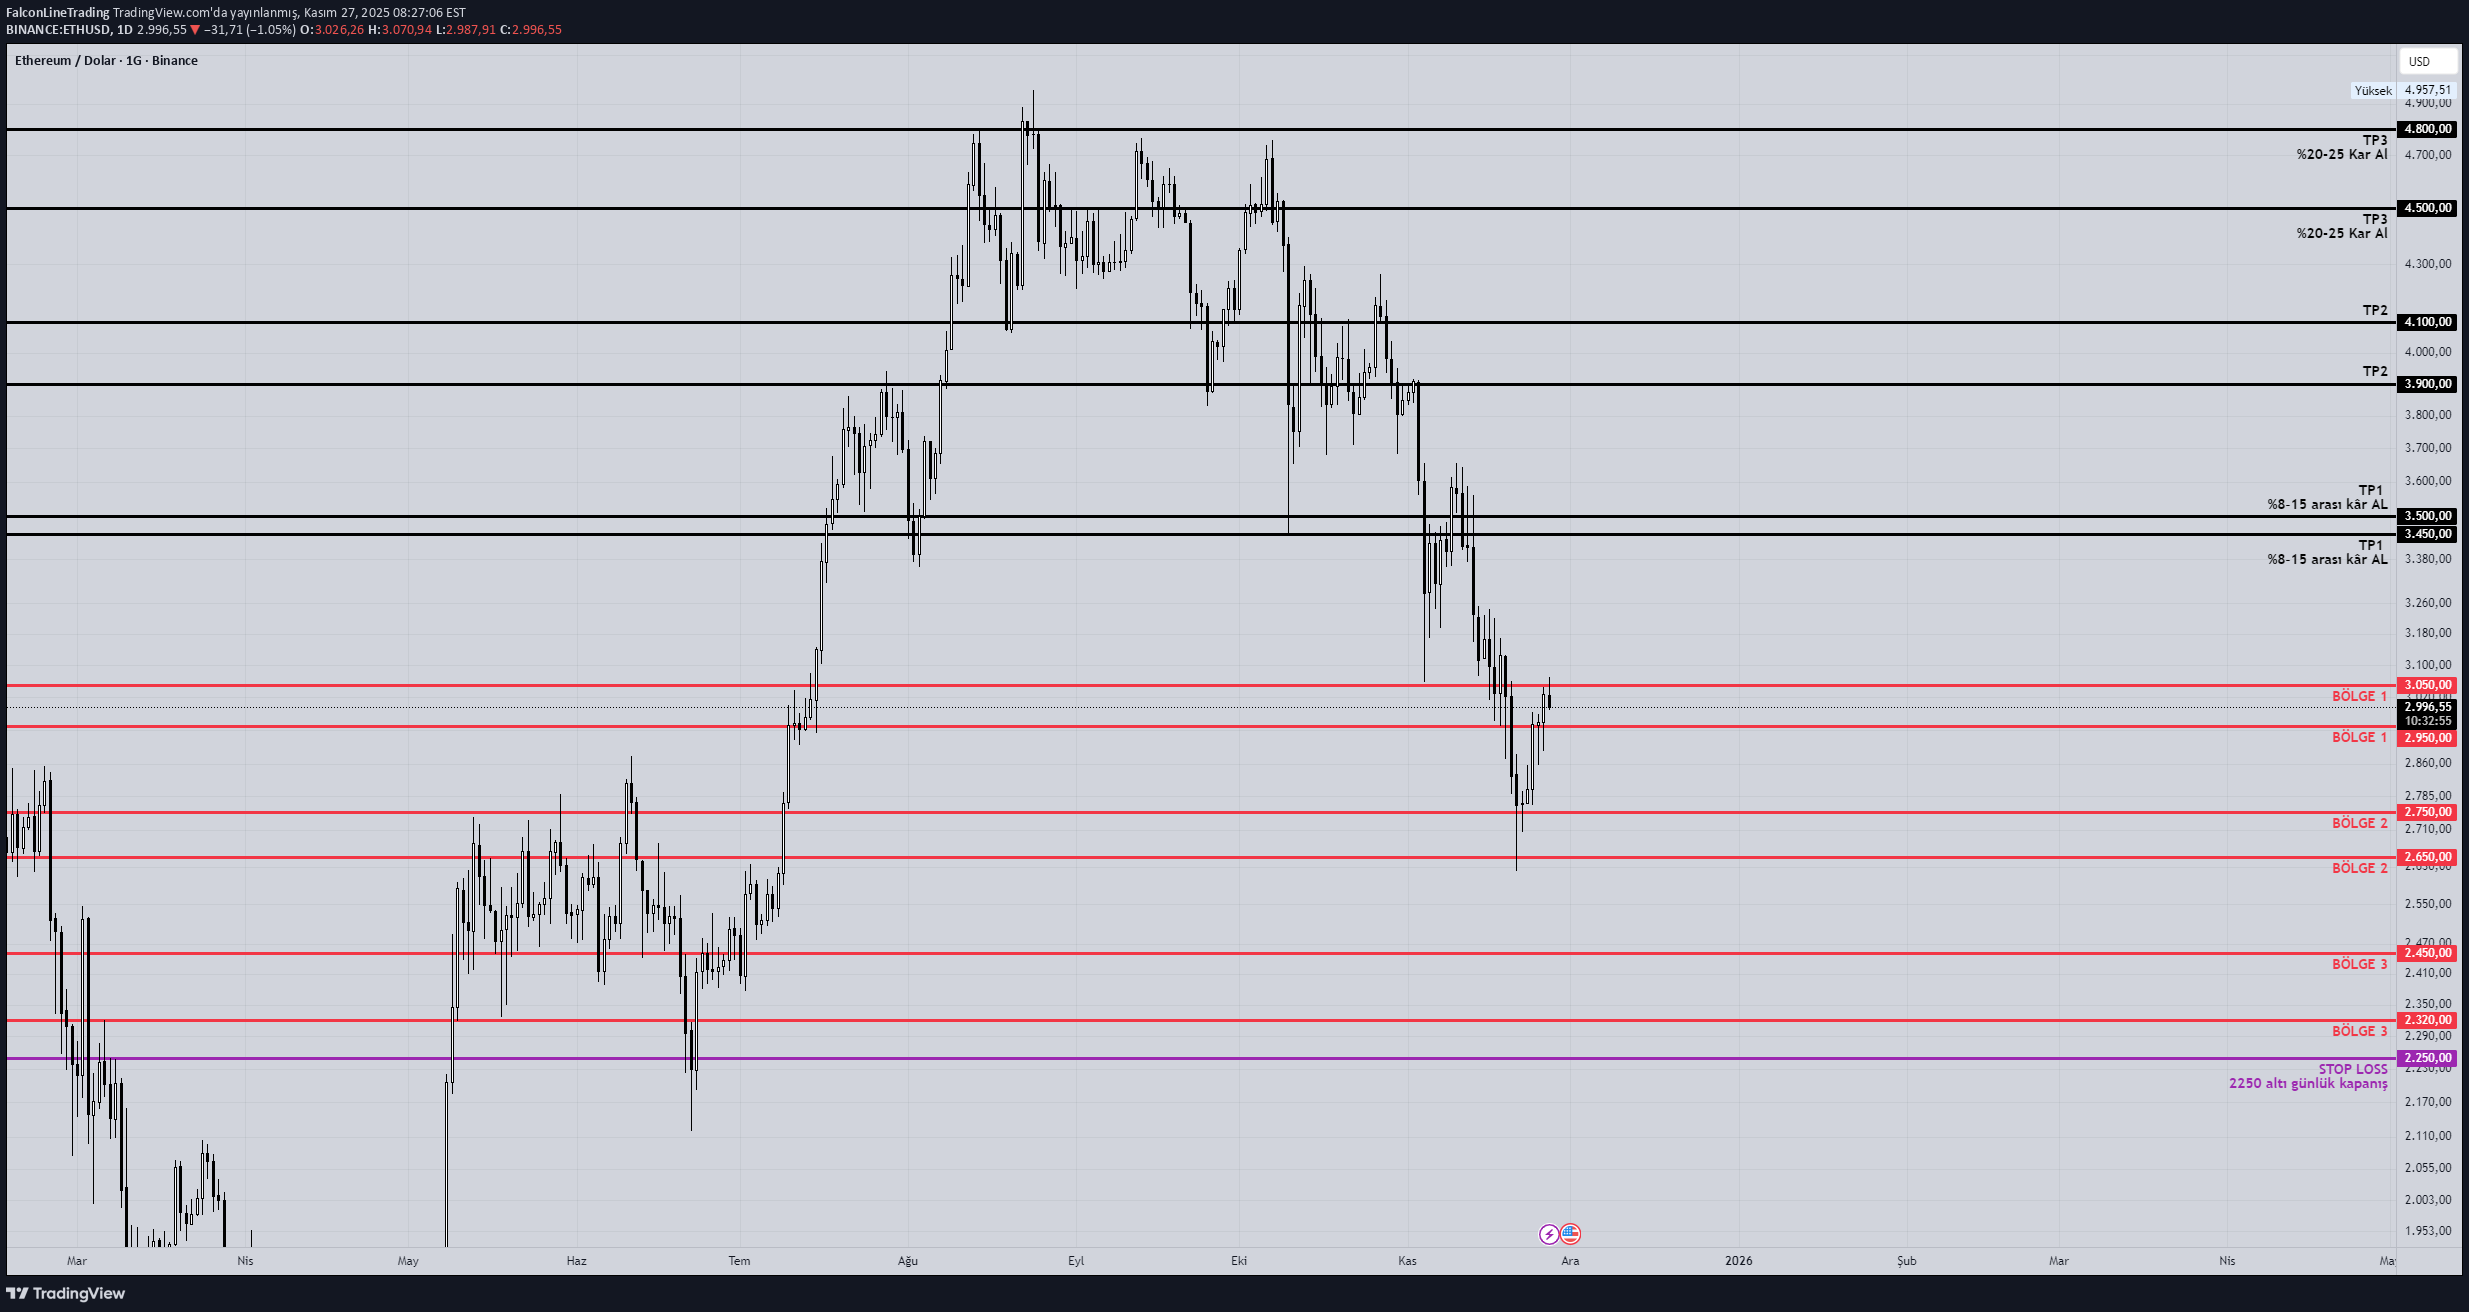
Ethereum – December 3, 2025 ‘Fusaka’ Upgrade Confidence: 84% Impact Analysis •Major category upgrade for Scalability + Security + UX → Ethereum. •ETH upgrades generally produce more sustainable trends. Market Impact •Positive pricing for 1–2 weeks before upgrade. •Volatility is high on the event day, but “sell the news” is generally low (depending on BTC macro). Critical Point ETH's upgrades also create liquidity spillovers in altcoins. Dominance may fall → Altcoin season preliminary signal. ----------------------------------------------- 1) ETH – Monthly (1M) Macro Trend Analysis Clearly in the image: There is a prolonged macro recovery following the decline from the 2021 ATH. ETH in the 2023–2025 period after the 2022 bottom: → Higher lows → Moved into a horizontal-positive expansion area 3000–3500 USD band large timeframe liquidity threshold 4000–4800 USD band “macro inefficiency + distribution region” 1M Result: ETH still maintains its bullish nature in the big time frame but: Entering Fusaka Upgrade major not above resistance → signal: high volatility + opportunity. 2) ETH – Weekly (1W) Trend Analysis Critical points on the weekly chart: 2900–3050 USD → weekly liquidity pool 3500–3700 USD → weekly supply zone 2600–2700 → a clean, strong demand zone Structure: Sideways-range and then an expanding structure through 2024. 1W Result: ETH is currently in the middle-upper region of the range. This marks the preparation area of the pump before the event. 3) ETH – Daily (1D) Trend Analysis On the daily chart: 3300–3500 region: strongest daily resistance 2950–3050 region: daily equilibrium 2650–2750 region: daily ideal long zone 2320–2450: “panic flush” zone → long-term accumulation opportunity 1D Result: ETH has been moving within the narrowing horizontal band for a while. As the Fusaka upgrade approaches, it's likely: → go down first (get liquid) → then push upward towards event 4) ETH – 4H Operational Setup Areas The 4H chart gives us the entry timing. Visible critical areas: 3140–3180: microsupply 3000–3050: flip zone 2850–2950 → 4H bullish OB clusters 2650–2750 → ideal entry zone (HTF + 4H compatible) 4H Result: There is a possible bottom formation in ETH before Fusaka and a rally pattern from there towards the event. NOW COMING TO THE MAIN PART ETH – SPOT PURCHASE STRATEGY According to Fusaka Upgrade (1M–1W–1D–4H analyzes + event effect blended) 1) Gradual Purchase Zones I proceed by accepting the total budget as 100% as an example. Zone 1 – Initial Purchase (Low Risk) 2950–3050 USD 35% → Both daily balance and weekly liquidity area. Zone 2 – Main Accumulation (Medium Risk, Most Productive Zone) 2650–2750 USD 45% → 1W demand zone → 4H bullish OB clusters → If there is a "liquidity sweep" before the event, the best buy is from here. Zone 3 – Deep Flush (High Risk, Maximum Opportunity) 2320–2450 USD 20% → Panic wick area → If there is an extreme liquidity hunt before Fusaka, ETH can pin it here. 2) Target Prices (TP) TP1 – Conservative 3450–3500 USD → 4H + 1D supply zone → 8–15% profit TP2 – Mid-term 3900–4100 USD → 1W major resistance → Most likely stop after the event TP3 – Aggressive 4500–4800 USD ATH region → Macro rally possibility still open for ETH → Sell here for only 20–25% profit 3) Stop-Loss (SL) Scenario In the spot, SL is more flexible, but the critical threshold is: Daily close below 250 → Macro trend weakens → The bottom of that region means “higher timeframe structure breakdown”. 4) Operational Plan for Event Calendar Upgrade Date: December 3, 2025 Before (10–15 days) There is a high probability of getting a down wick 45% of the budget (Region 2) is critical Event Week Pump + instant volatility TP1 has a high probability of explosion 1–4 Weeks After Event The probability of trend continuation is higher than altcoins TP2 and TP3 are targeted in this window 5) Overall Conclusion for ETH ETH macro is bullish, medium term squeeze + event catalyst + strong HTF structure → It is very suitable for spot strategy.
FalconLineTrading
تحلیل DGB: نقاط عطف و حرکت قیمتی پس از شکست مقاومت!
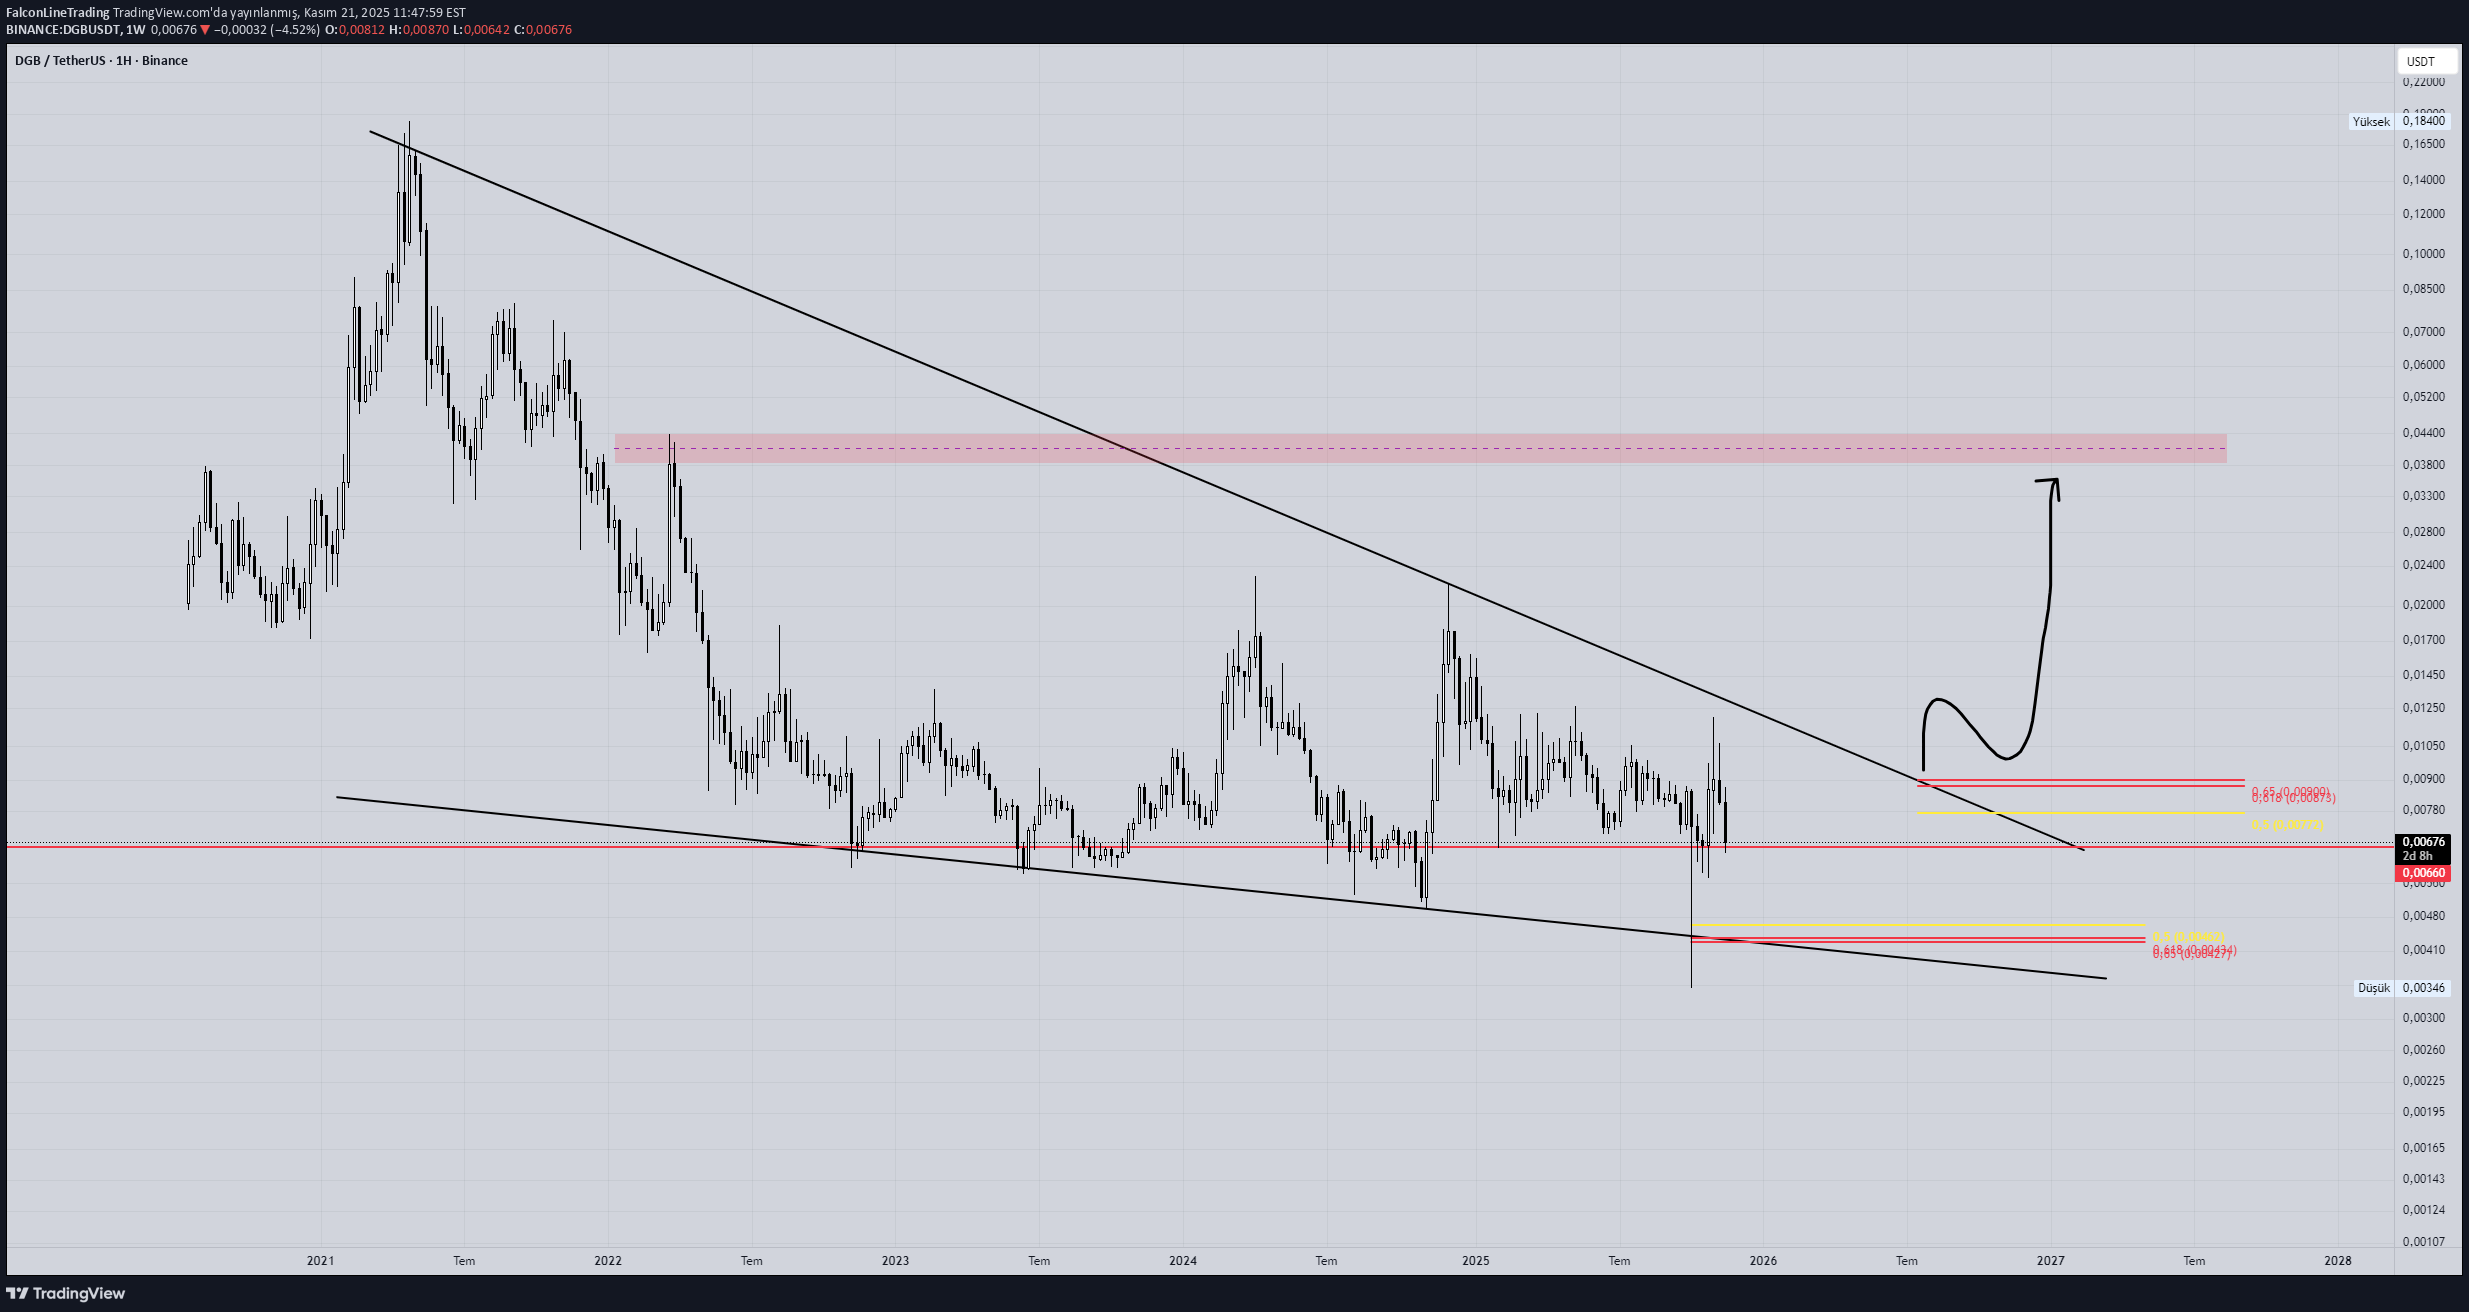
Fib. I drew the resistance zone and the price movement that will follow if the falling trend is broken on the chart.
FalconLineTrading
تحلیل قیمت FIL: سیگنال صعودی پس از شکست روند هفتگی!
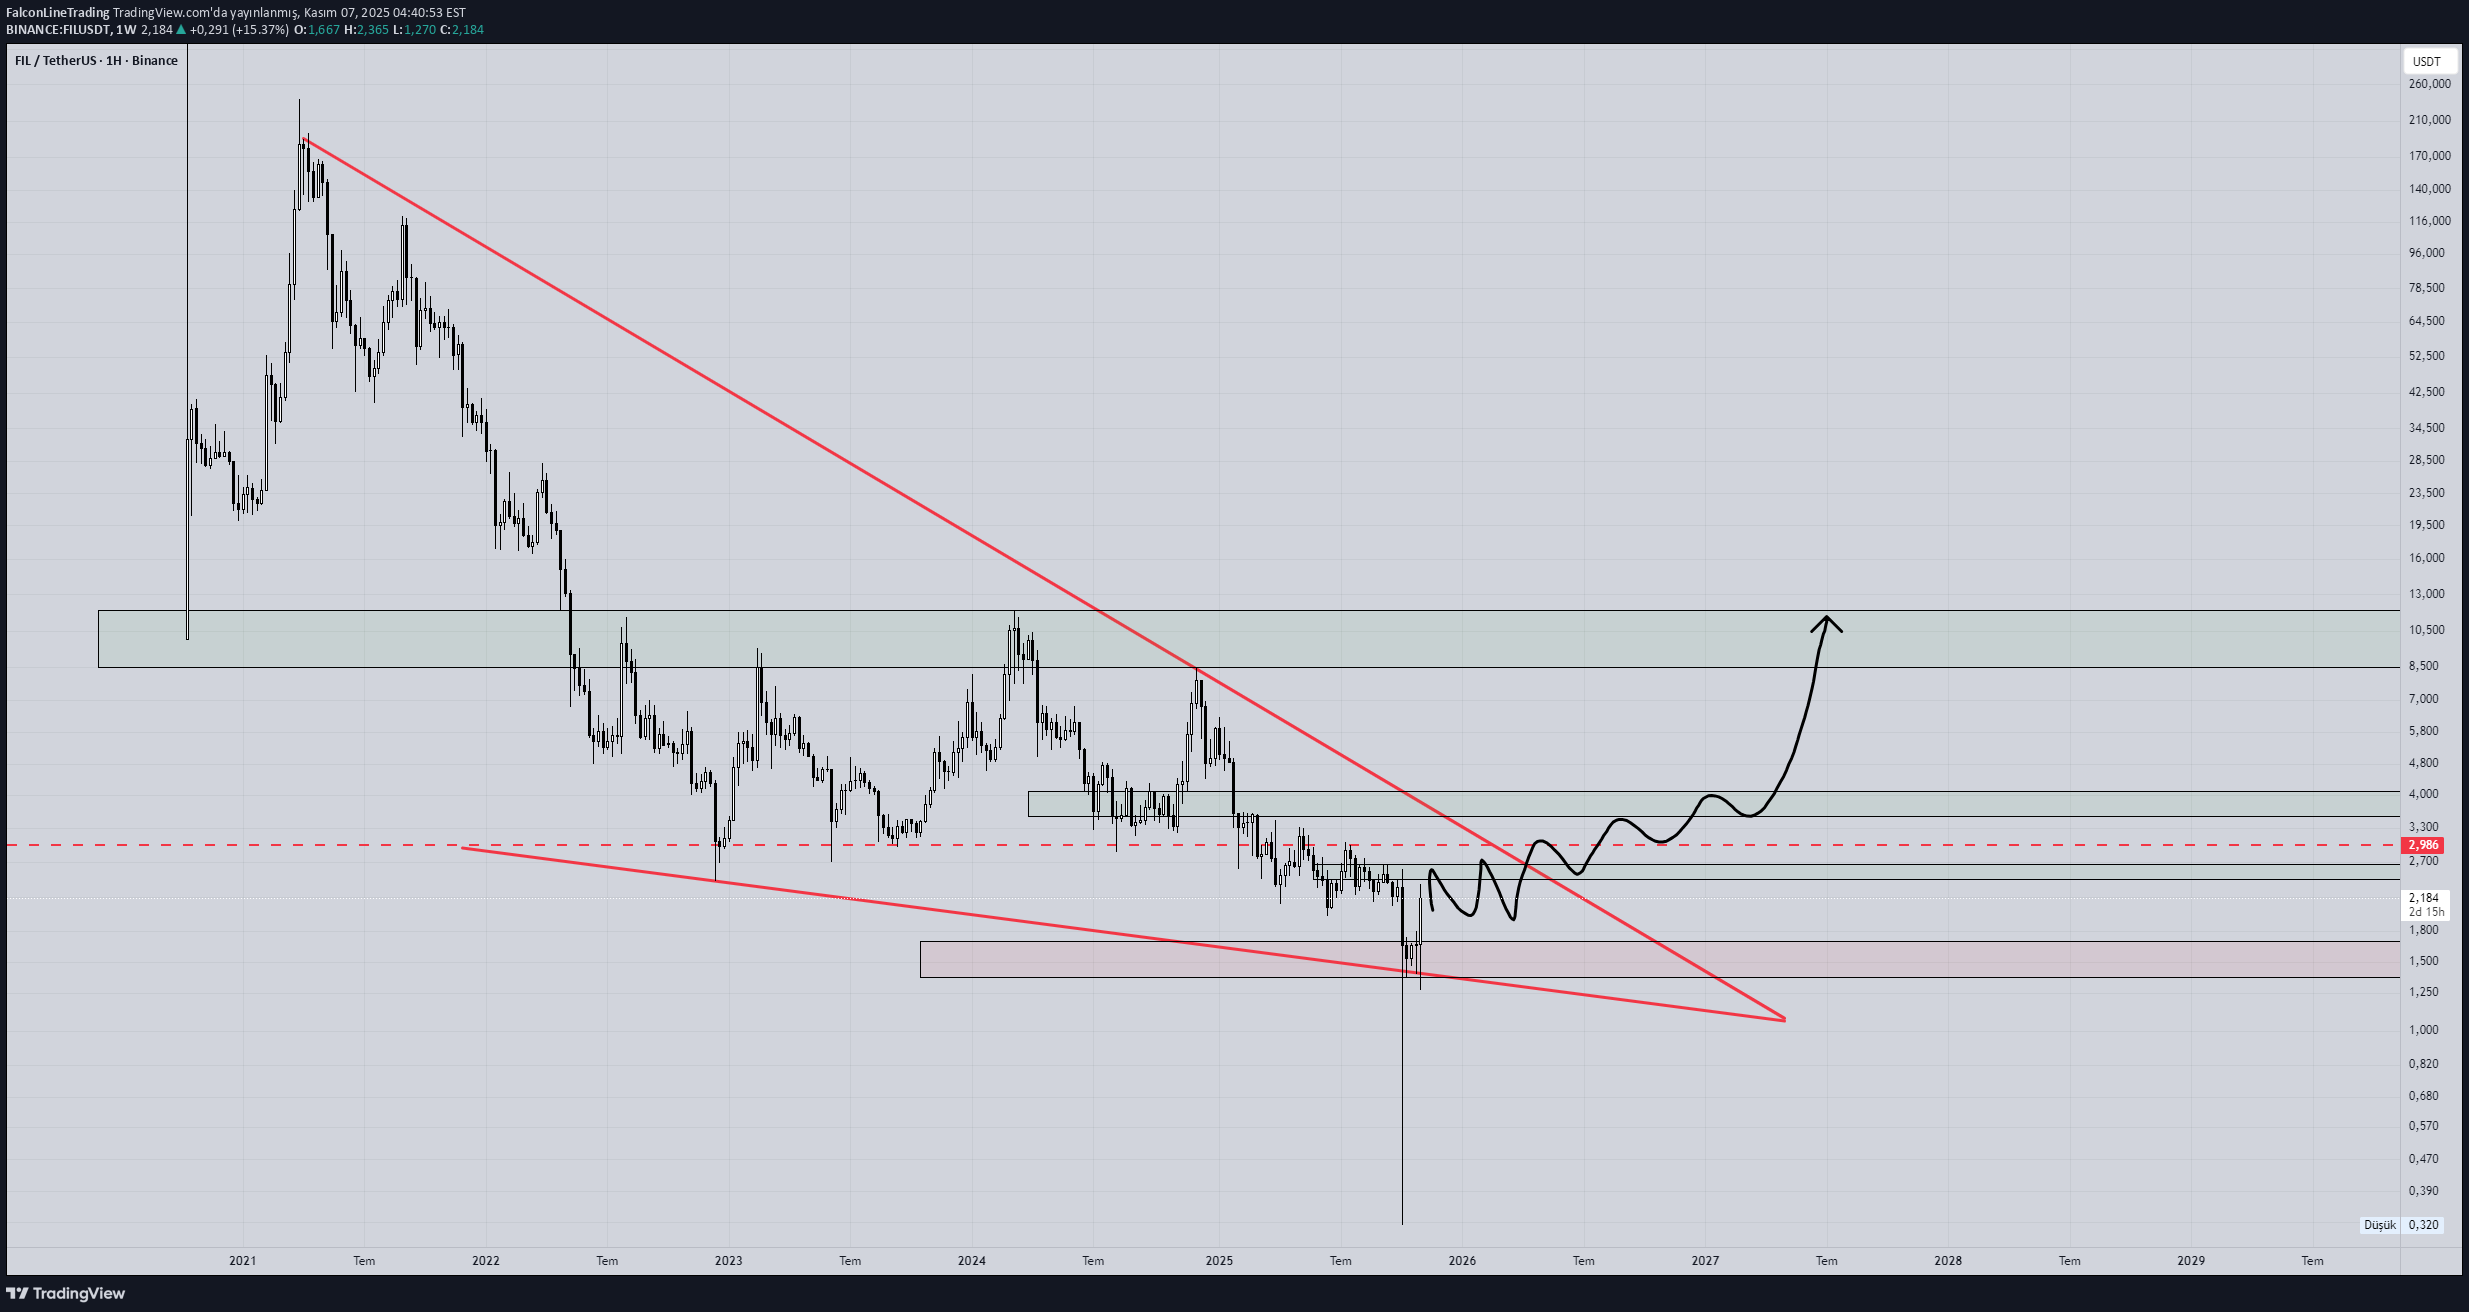
FIL I determined the price movements after the trend break on the weekly chart.
FalconLineTrading
پیشبینی قیمت اتریوم (ETH): آیا زمان جهش بزرگ فرا رسیده است؟
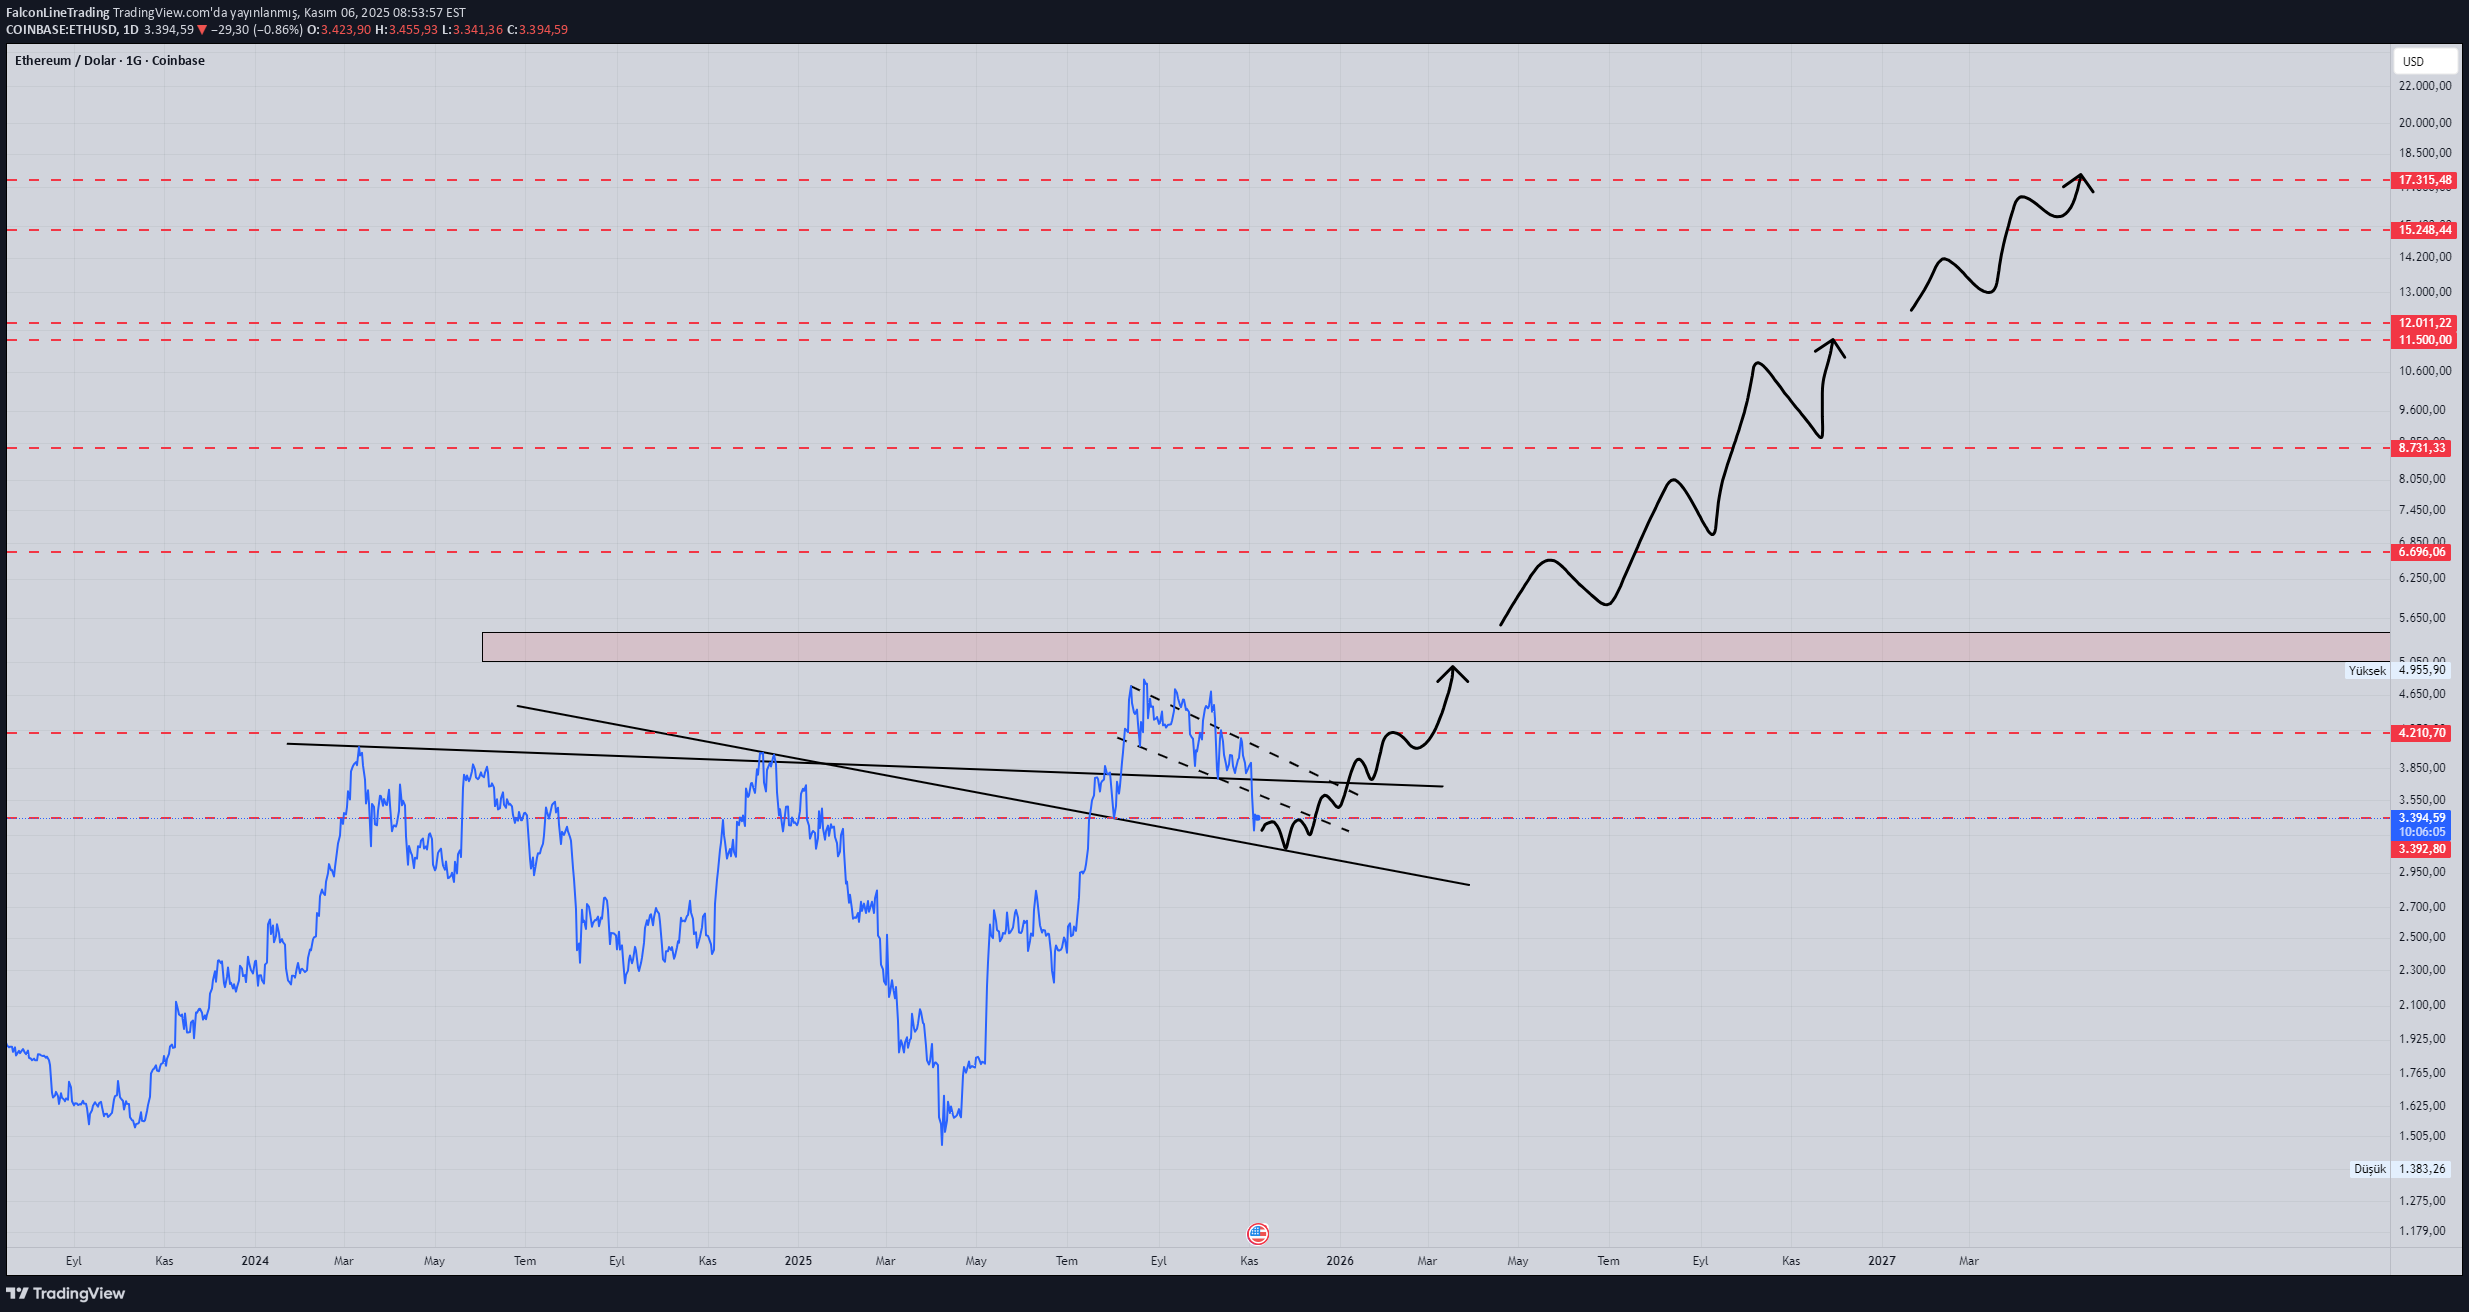
Let's see if ETH can make the price movements I expect...
FalconLineTrading
نقشه راه سقوط بیت کوین: تحلیل نمودار وایکاف در تایم روزانه
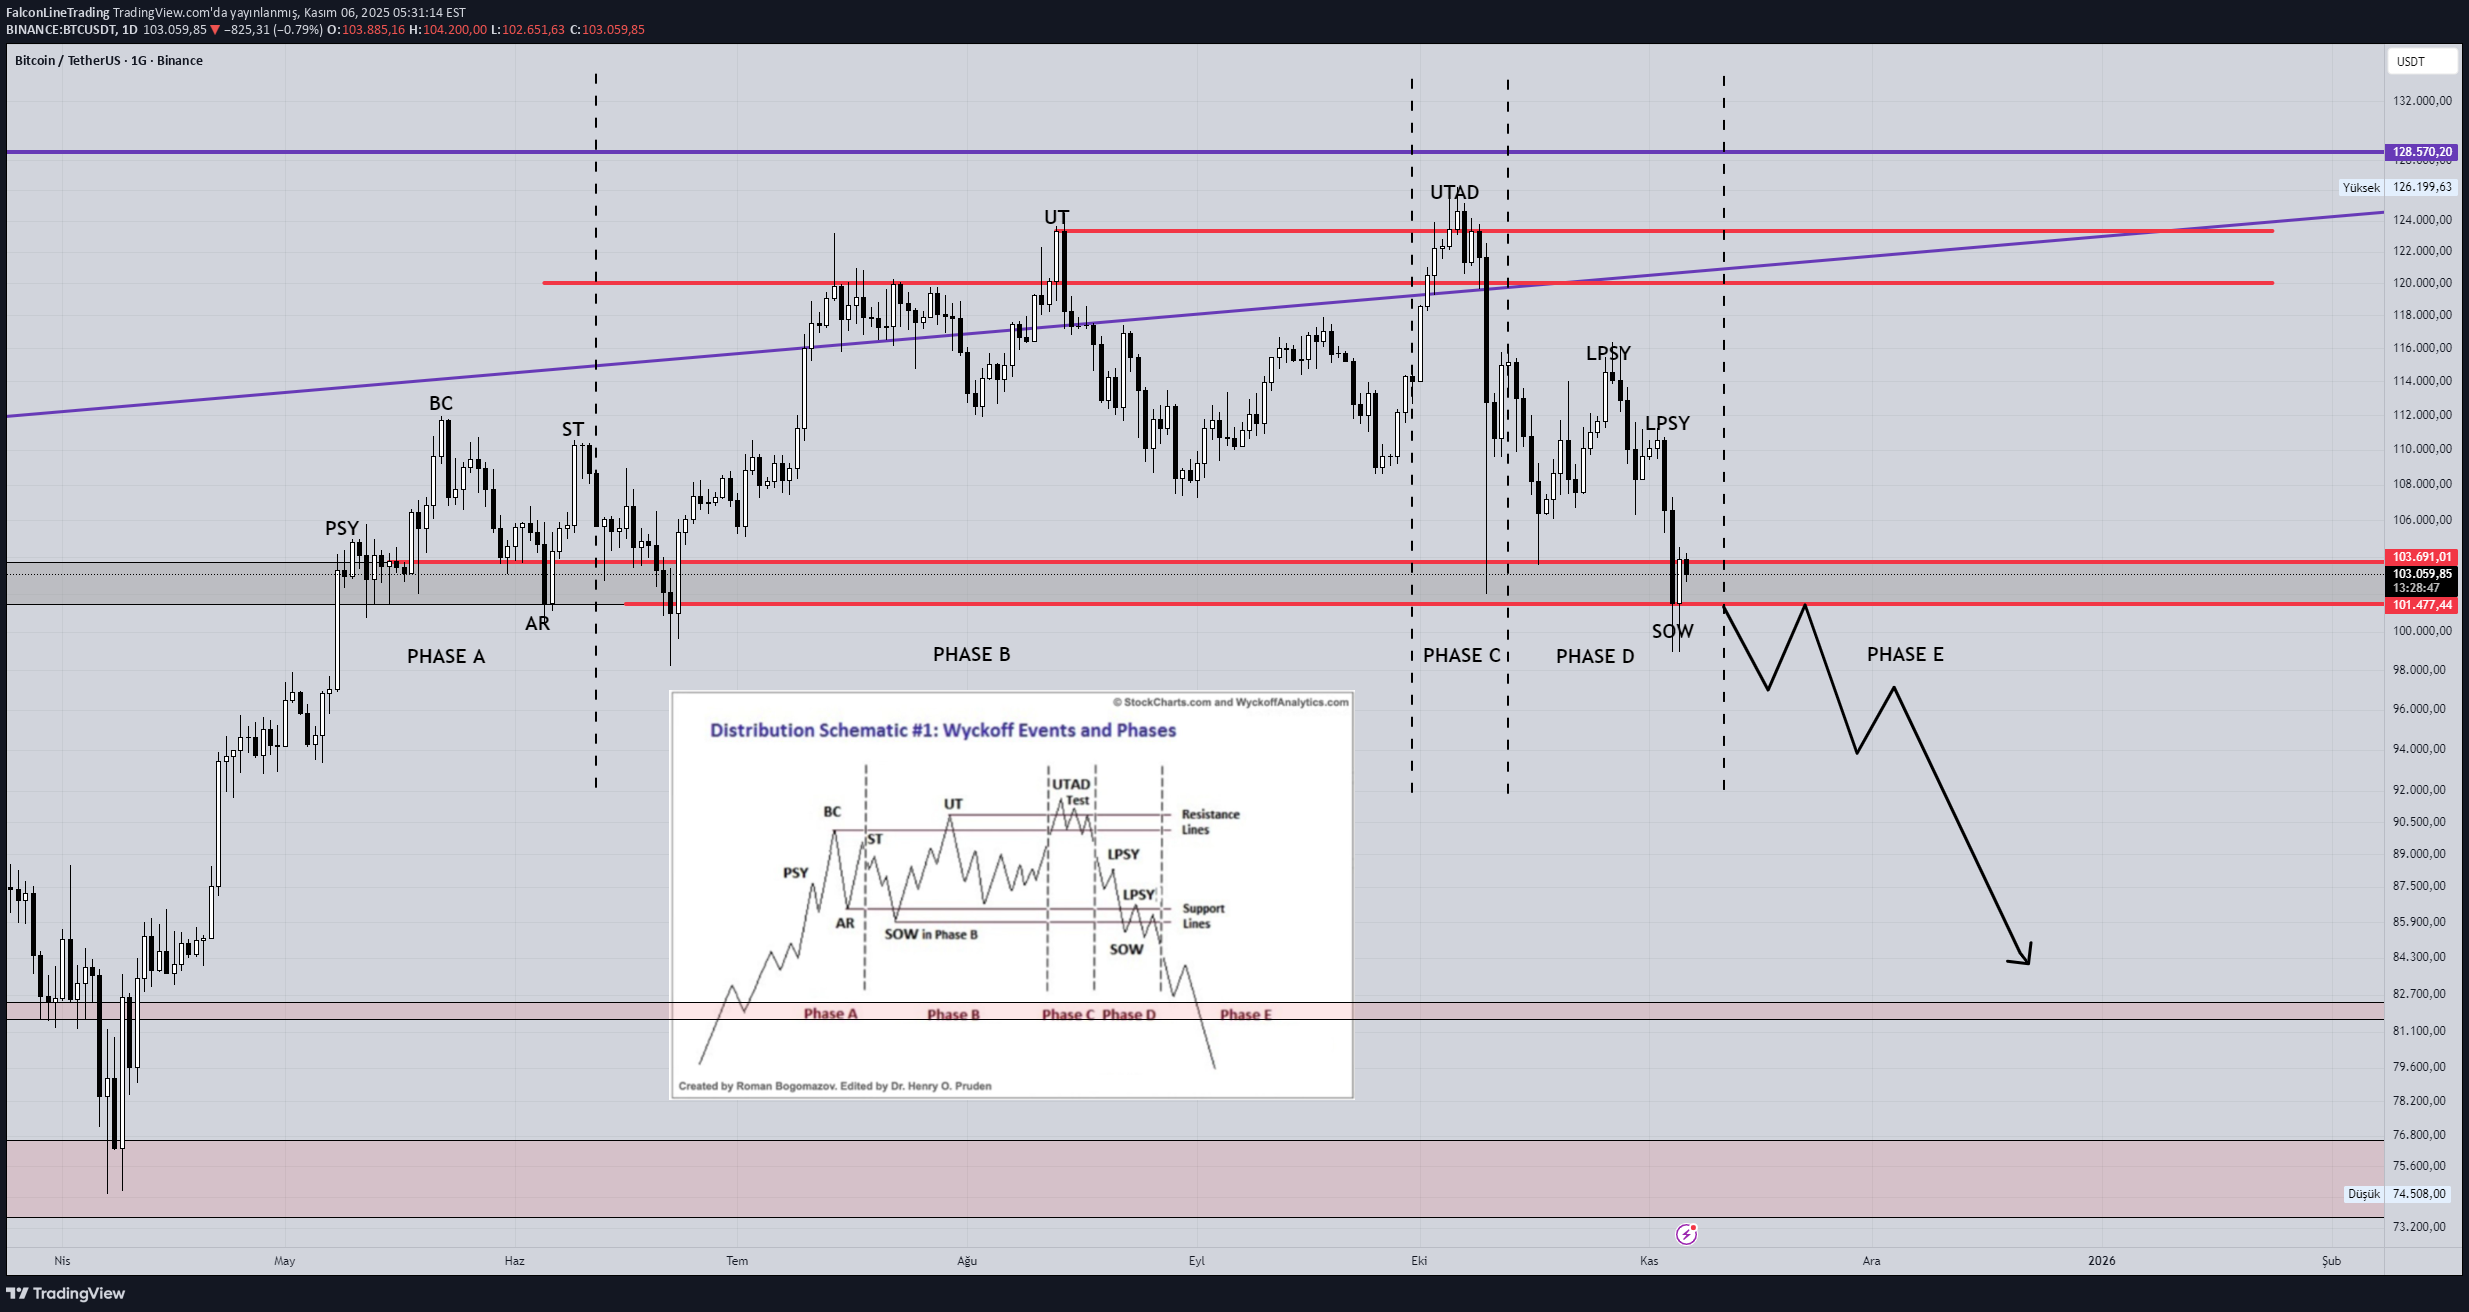
After yesterday's price movements, a Wyckoff distribution chart occurred on the BTC daily chart. If the 101477K support level is broken and turns into resistance and we see a weekly close, the possibility of the decline scenario in the chart increases.
Disclaimer
Any content and materials included in Sahmeto's website and official communication channels are a compilation of personal opinions and analyses and are not binding. They do not constitute any recommendation for buying, selling, entering or exiting the stock market and cryptocurrency market. Also, all news and analyses included in the website and channels are merely republished information from official and unofficial domestic and foreign sources, and it is obvious that users of the said content are responsible for following up and ensuring the authenticity and accuracy of the materials. Therefore, while disclaiming responsibility, it is declared that the responsibility for any decision-making, action, and potential profit and loss in the capital market and cryptocurrency market lies with the trader.