Technical analysis by FalconLineTrading about Symbol ONT: Buy recommendation (11/27/2025)

FalconLineTrading
Ontology (ONT): آیا این کوین به کف قیمتی رسیده؟ استراتژی خرید پلهای برای سود ۳۰۰٪!
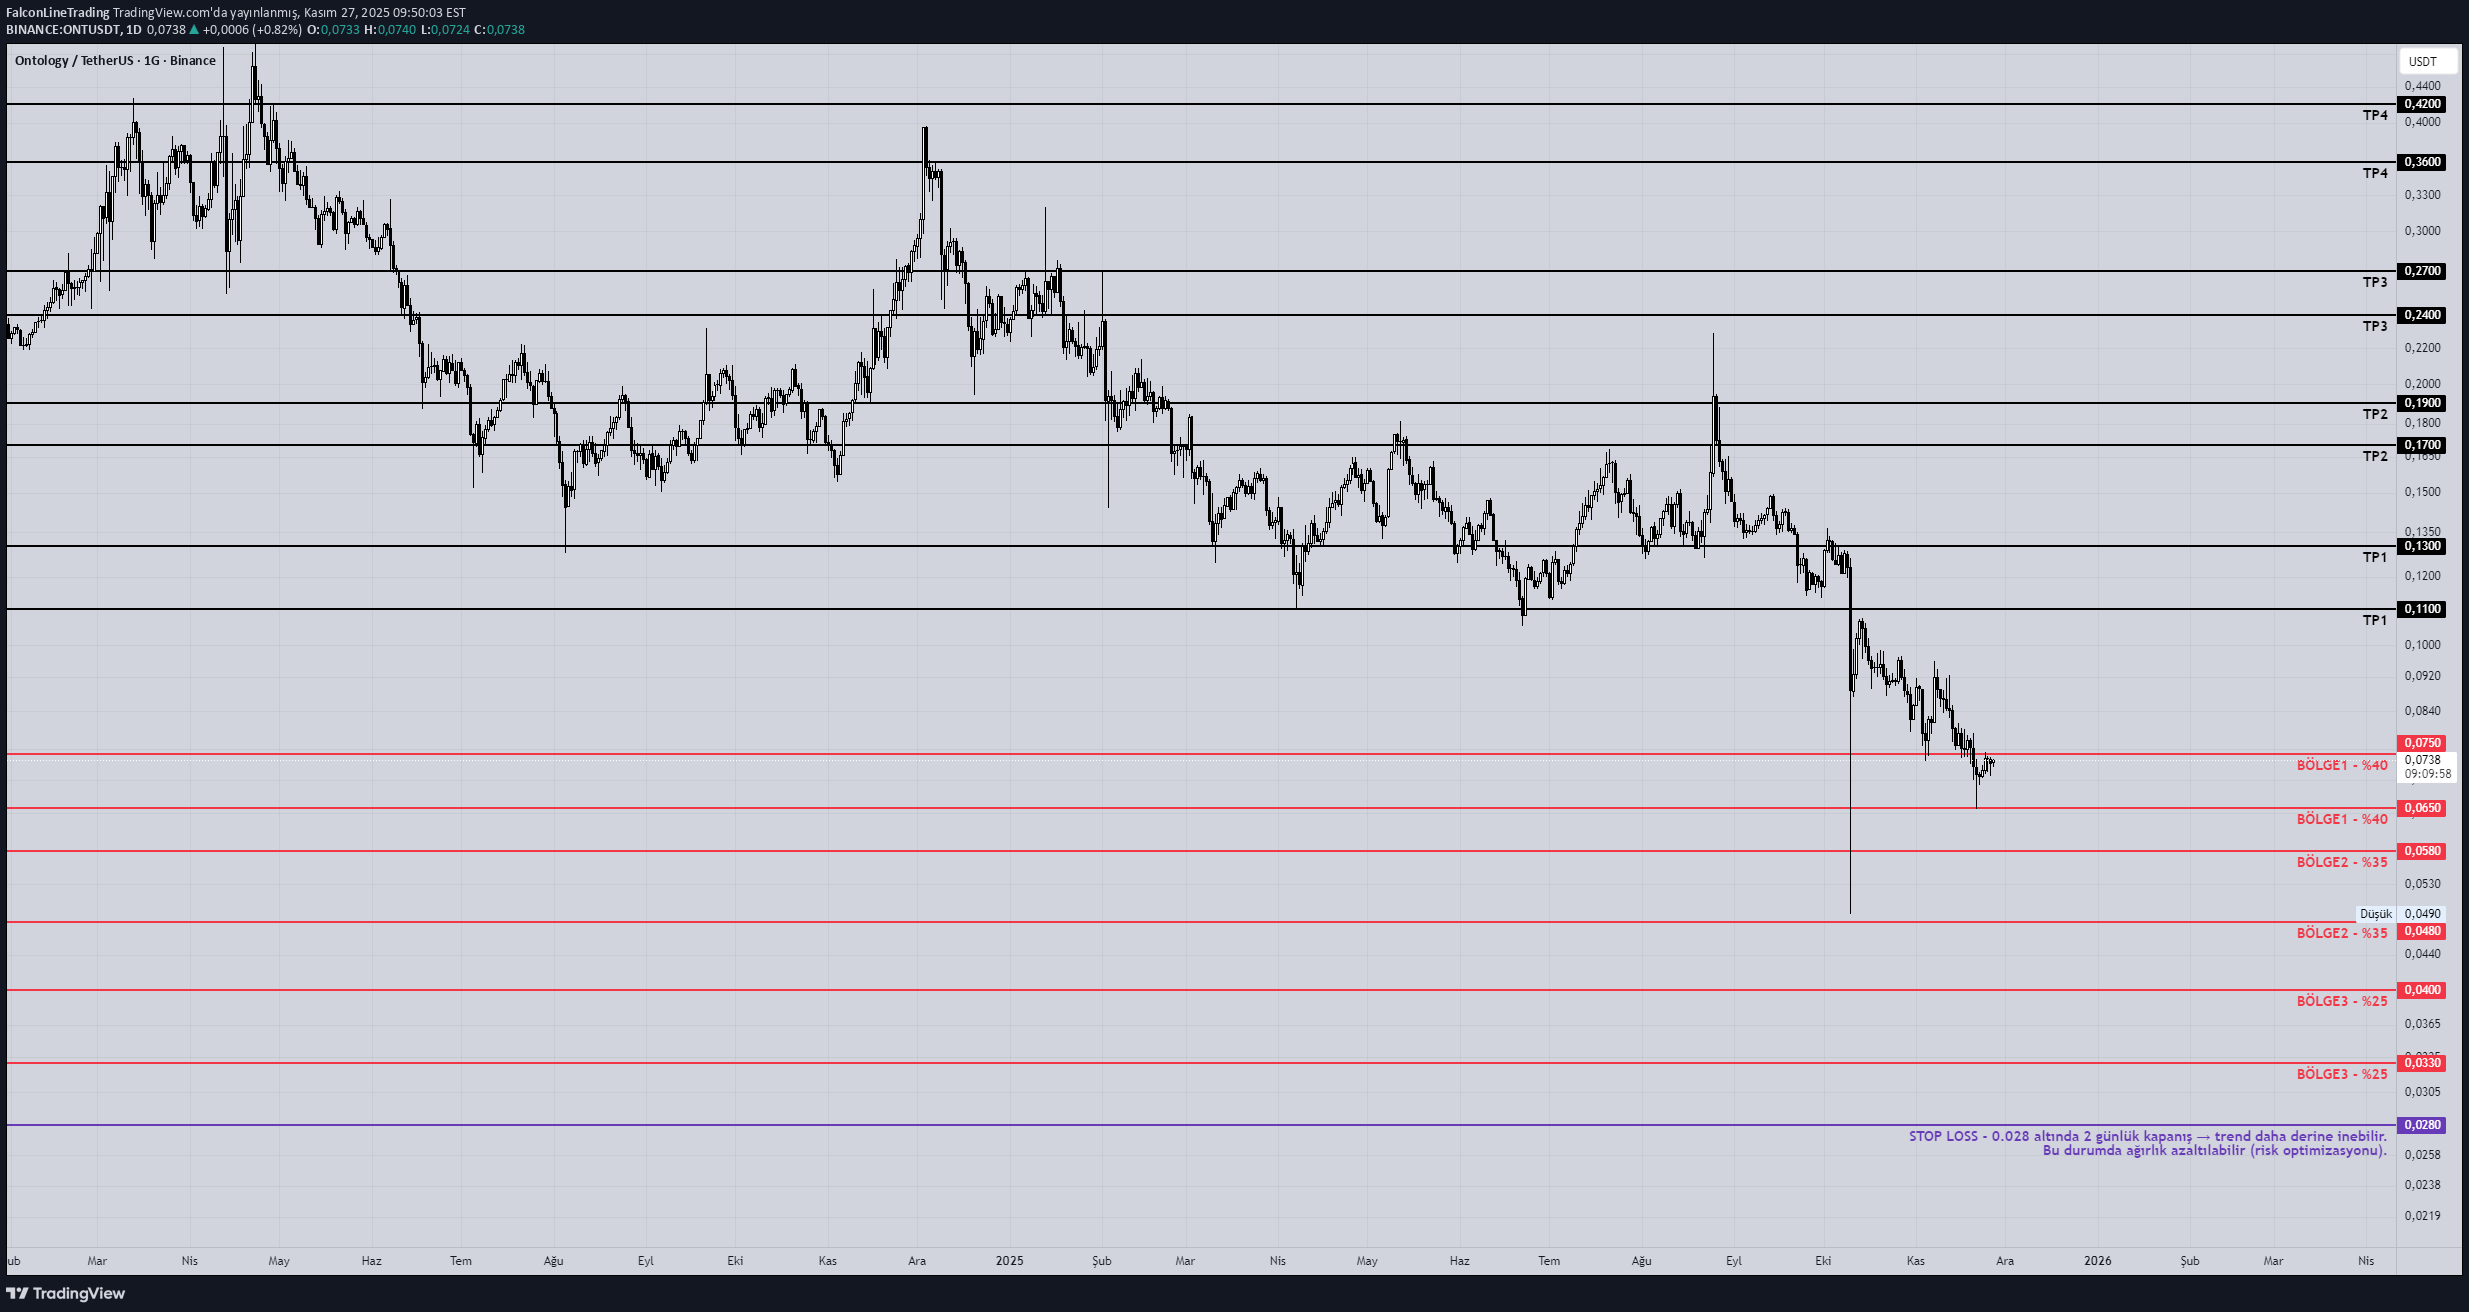
Ontology (ONT) — December 1, 2025 MainNet V3.0.0 Confidence: 100% Impact Analysis •New tokenomics + locked liquidity •This type of updates reduces supply pressure → positive Market Impact •Minor rise before the event •Not large cap → Pump/dump risk is high ----------------------------------------------- ONT – Multi-Term Trend Diagnosis 1M (Monthly) – Macro Trend It has been in a persistent downtrend since 2018. All highs are lower → all lows are lower. Monthly candles have long shadows and weak bodies → aggressive seller pressure. Volatility has decreased in recent months → bearish fatigue + signal of an upcoming bottom. Monthly outlook: Strong bear trend but approaching the bottom zone. 1W (Weekly) – HTF Yapı There has been a descending channel and a stable downward flow in the weekly for the last 2 years. There was a liquidity “flush” in two places: 0.06 region 0.05–0.045 region These wicking areas are typical fundraising bottoms. Weekly → bottom range: 0.045 – 0.065 1D (Daily) – Midterm Trend Every lower high broken on the daily → seller strength prevails. RSI, vol and market structure tell the same story: The trend is down but the momentum is weakening. 0.07–0.08 region is minor resistance. celebrity view: Reactions come, but the trend has not returned. 4H (Operation Time) – LTF Entry Fields In 4H, the range between 0.06 and 0.065 has been defended over and over again. LTF bullish market structure but there is no continuation. The rising trend does not start → this region is in the “accumulation under distribution” class. 4H: The best entry area is only in the bottom areas. ONT – Spot Strategy (Gradual, Professional) Classic retail mistake: “Will he return from here?” To buy from the middle. StrategyM: Low risk + multi-time confirmation + event aware dip buying. PURCHASE ZONES (Spot Accumulation) 1) Zone A – 0.065 – 0.075 Uptake: 40% 4H demand area Where daily bounces begin First liquidity return happens here 2) Zone B – 0.048 – 0.058 Uptake: 35% Weekly bottom pool Corporate long-term collection Strongest historical support 3) Zone C – 0.033 – 0.040 Purchase: 25% Monthly liquidity clearing Capitulation zone If it returns from here, it gives a cycle reversal with 300–500% potential. STOP-LOSS Logic (For Spot) I do not recommend hard SL in spot strategy, but: 2-day close below 0.028 → trend may go deeper. In this case, the weight can be reduced (risk optimization). TP Levels (Professional Exit Plan) TP1 – 0.11 – 0.13 4H+1D main distribution line First realization zone TP2 – 0.17 – 0.19 2024–2025 horizontal resistance zone TP3 – 0.24 – 0.27 Midterm range top In-cycle mini hills TP4 – 0.36 – 0.42 Main bullish scenario major wick filling area after 2021 Critical Note (Event Aware Strategy) Bro, this ONT strategy I gave you was optimized to be compatible with the event grids you sent: Risk-on event: Buying from Zone A is made aggressive. Risk-off event: It makes sense to wait in Zones B and C and target deeper bottoms. High-volatility macro trigger: HTF points to the bottom regions (0.048–0.055). Summary: ONT What Does It Say? In macro bear trend, Close to the bottom area, Trend reversal has not started yet, But it has become the area of interest of large funds. Coins from this structure generally have cycle returns between +200% and +600%. The main thing is to take it gradually and be patient.