
FXNEWSCLUB
@t_FXNEWSCLUB

What symbols does the trader recommend buying?
Purchase History
پیام های تریدر
Filter
FXNEWSCLUB
پیشبینی بیت کوین ۲۰۲۵-۲۰۲۶: تحلیل تکنیکال، اسمارت مانی و فاندامنتالهای سرنوشتساز
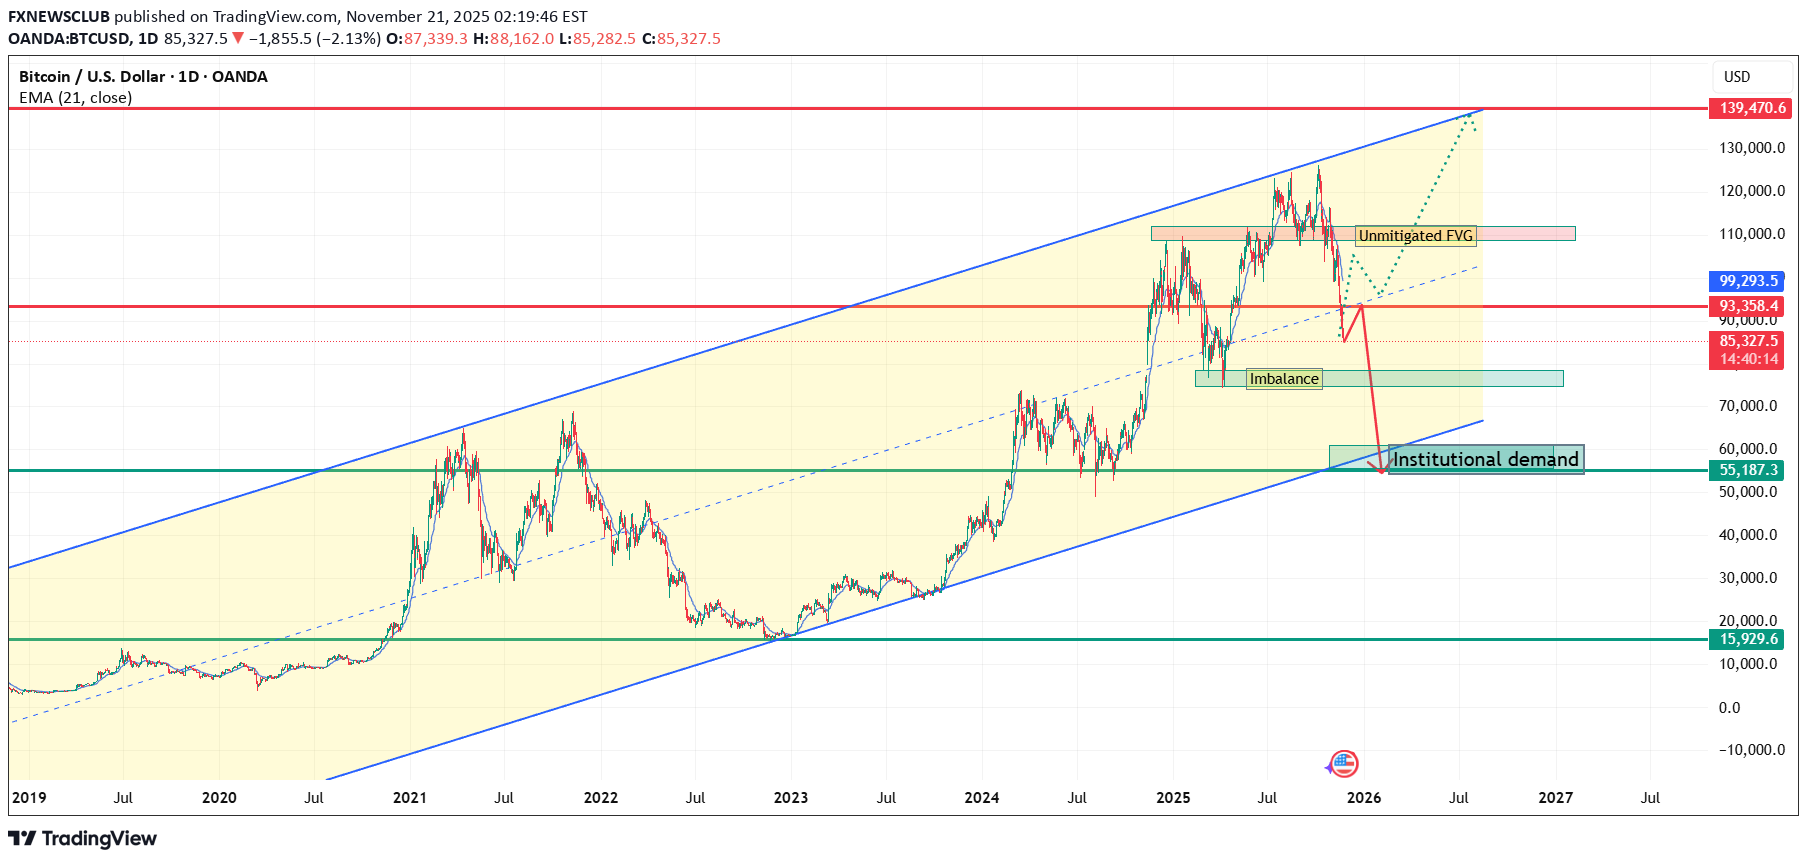
Bitcoin is approaching one of the most critical phases of the current market cycle. With price moving inside a long-term ascending channel since 2018, the next few months will define whether BTC continues its macro bullish trend or enters a deeper discount zone before the next rally. Here’s a clear breakdown using Price Action, Smart Money Concepts, and Macro Fundamentals. 🔹 1. Market Structure BTC continues to respect a multi-year ascending channel with: Upper resistance: ~139,000 Midline dynamic level: ~99,000 Major support: ~55,000 The recent correction from 120k down to the 80k range shows BTC has moved from a premium zone into a balanced structure. 🔹 2. Price Action Insights Rejection occurred at the 93,300 zone, which turned into a key supply level. Price is forming a lower high, signalling potential mid-term weakness. BTC is currently consolidating between 85k support and 93k resistance. This compression phase will decide the next major breakout. 🔹 3. Smart Money Concepts (SMC) View BOS (Break of Structure): A key bearish BOS formed on the daily chart. Upside FVG: 108k–112k remains unfilled. Downside FVG: Around 75k. Premium vs Discount: BTC is entering discount territory, but true institutional demand lies around 55k–60k. Two SMC Scenarios Bearish Path: Liquidity grab → 93k rejection → move to 55k channel support. Bullish Path: Sweep below 80k → reclaim 93k → continuation toward 100k+ → attempt at 139k. 🔹 4. Fundamental Factors Bullish Drivers: Strong ETF inflows Post-halving supply shock Expected global rate cuts Increasing crypto adoption in MENA, Asia & LATAM Bearish Risks: Regulatory pressure in the U.S. Liquidity tightening High leverage across futures markets 🔹 5. Final Outlook BTC is at a decision zone. 📉 Scenario 1: Retest of 93k fails → deeper correction toward 55k demand 📈 Scenario 2: Break above 93k → push to 100k → extension toward 139k channel top Regardless of the short-term direction, the macro structure remains bullish.
FXNEWSCLUB
طلا (XAUUSD) در آستانه سقوط؟ تحلیل کلیدی حمایت 4180 دلار و آینده قیمت
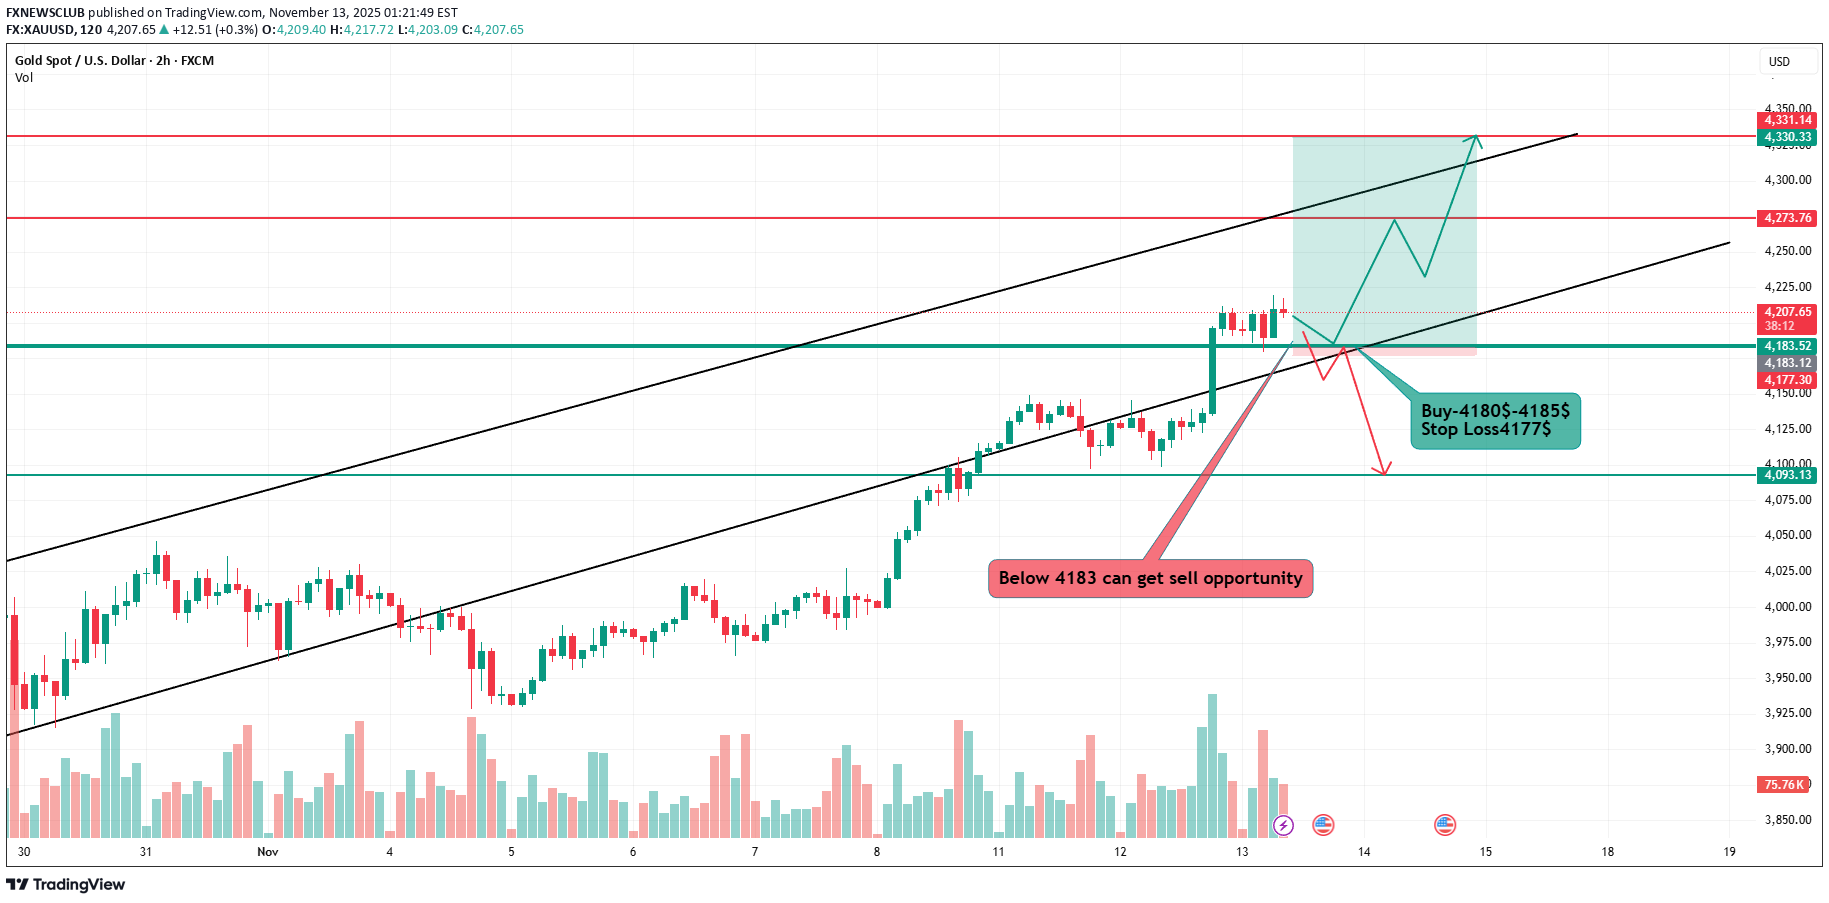
. Technical Overview Timeframe: H2 (2-hour) Current Price: around $4206 Structure: Price is moving within an ascending channel (black trendlines). Key Zones: Buy Zone: $4180–$4185 Stop Loss: $4177 Sell Zone: Below $4183 (confirmation break) Targets: Short-term: $4273 Extended: $4330–$4331 (top of the channel) Interpretation: Price is near a demand zone ($4180–4185) aligning with the channel support — this supports a potential long entry if price holds above that area. However, a clean break below 4183 may signal liquidity sweep and continuation down to around $4093. 📈 2. Price Action Analysis Recent bullish impulse from $4090 → $4210 created new higher highs and higher lows. Minor resistance was formed near $4217–$4220 where sellers reacted. A retest of $4185 could confirm buyers’ strength before continuing up. Liquidity zone: exists just below $4180 — smart money may manipulate below it to grab liquidity before moving higher. 🏦 3. Smart Money Concepts (SMC) View Market Structure: Bullish POI (Point of Interest): $4180–$4185 zone (previous order block + fair value gap area). Liquidity Areas: Sell-side liquidity under $4180 Buy-side liquidity above $4270 Expected SMC Play: Smart money may induce sellers below $4183, sweep liquidity, then push price up to mitigate the previous order block near $4270–$4330. 🌍 4. Fundamental Outlook Gold Drivers This Week: US CPI data: If inflation cools → weaker USD → bullish for Gold. US Treasury yields: Decline in yields supports Gold buying. Geopolitical tension or Fed rate cut expectations → adds bullish pressure. Summary: Fundamentals are slightly bullish for Gold as market sentiment remains risk-averse and traders expect rate cuts in 2026. ⚙️ 5. Trade Plan Summary TypeEntryStop LossTargetConfirmation Buy4180–418541774273 → 4330Bullish candle from POI SellBelow 4183Above 42004093Break + retest below 4180 🎯 Conclusion Bias: Short-term bullish (while above 4180) SMC View: Expect liquidity sweep below 4180 before push to 4270–4330. Invalidation: 4177 break and close below → confirms bearish continuation.
FXNEWSCLUB
پیشبینی سقوط قیمت XRP: آیا رسیدن به کف 1.30 محتمل است؟ (تحلیل 4 ساعته)
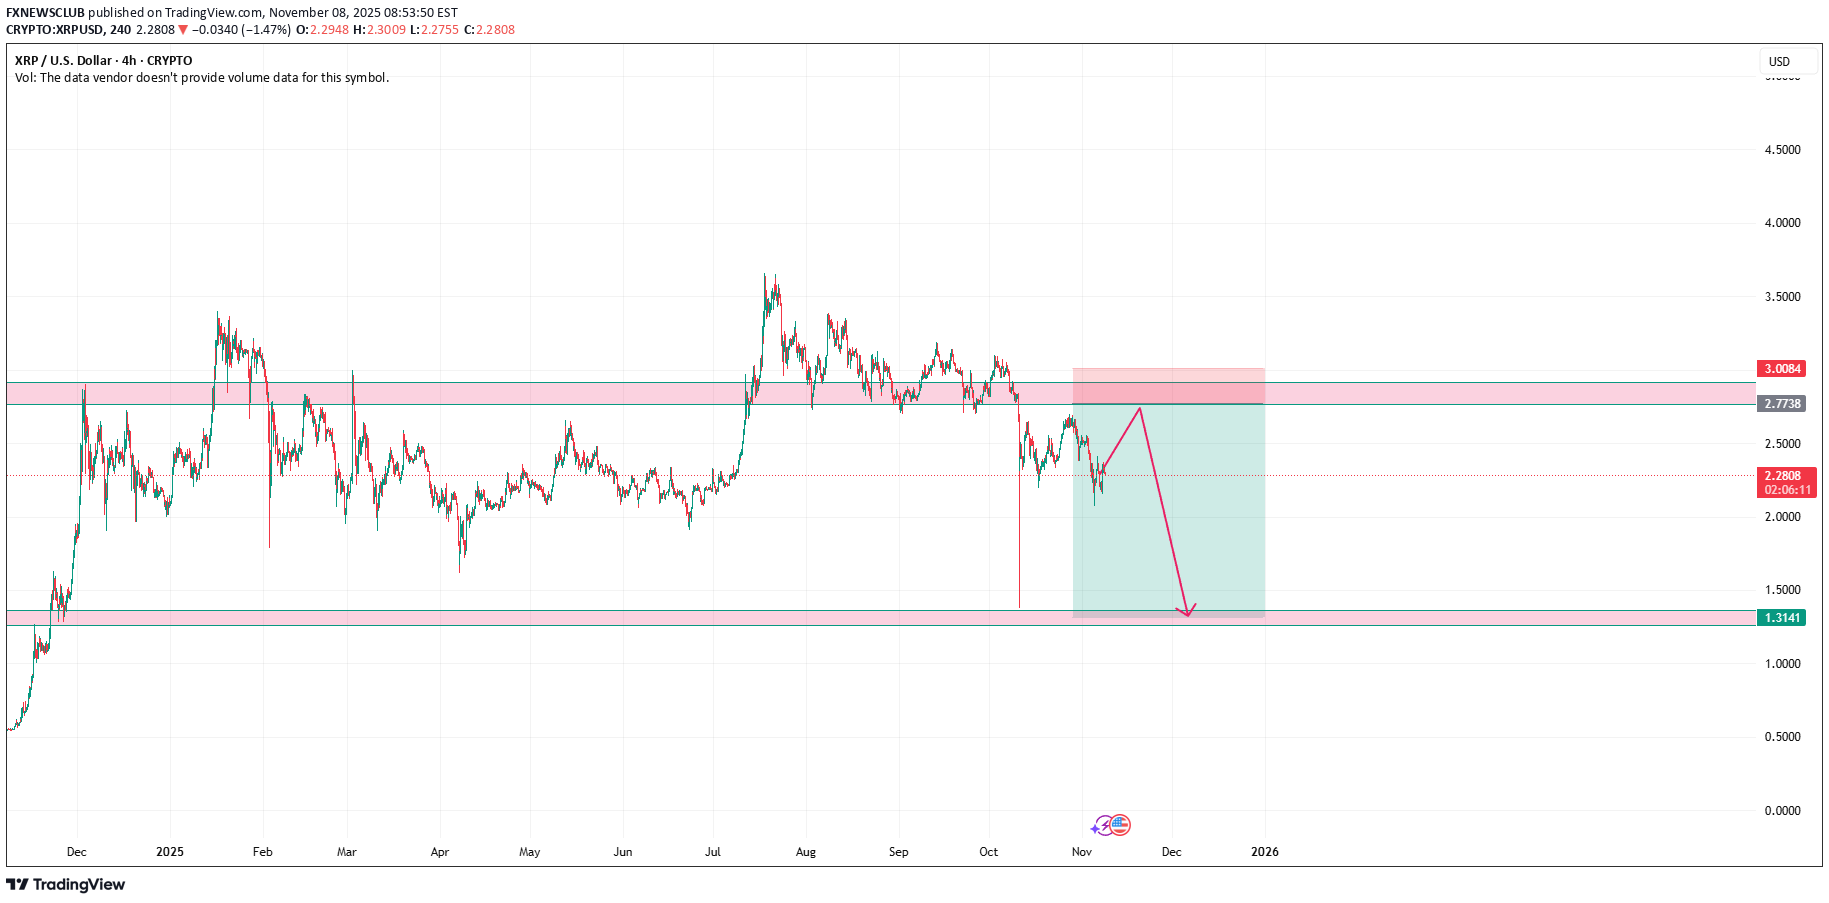
Market Structure: Price has broken below the mid-range support around 2.77 – 2.80 zone, turning it into resistance. The market has formed lower highs and lower lows, confirming a downtrend structure. 📉 Bearish Scenario: The red zone around 2.77 – 3.00 acts as a supply zone / resistance area. Price may retest this area before continuing downward. The projected target (based on your arrow) is around 1.31, which aligns with the previous demand/support zone from earlier in 2025. 🎯 Key Levels: Resistance (Sell Zone): 2.77 – 3.00 Current Price: ~2.28 Target (Support Zone): 1.30 – 1.35 Invalidation (Stop Loss Zone): Above 3.00 ⚙️ Technical Confluence: Break and retest pattern after bearish momentum. Previous structure support now acting as resistance. Potential Fibonacci retracement from last drop aligns near 2.77 zone (~0.618 level). 📊 Bias: ➡️ Bearish bias unless price reclaims and closes above 3.00 on 4H or Daily timeframe.
FXNEWSCLUB
تحلیل تکنیکال سولانا: پایان صعود هیجانی؟ ناحیه حیاتی ۱۷۴ دلار کجاست؟
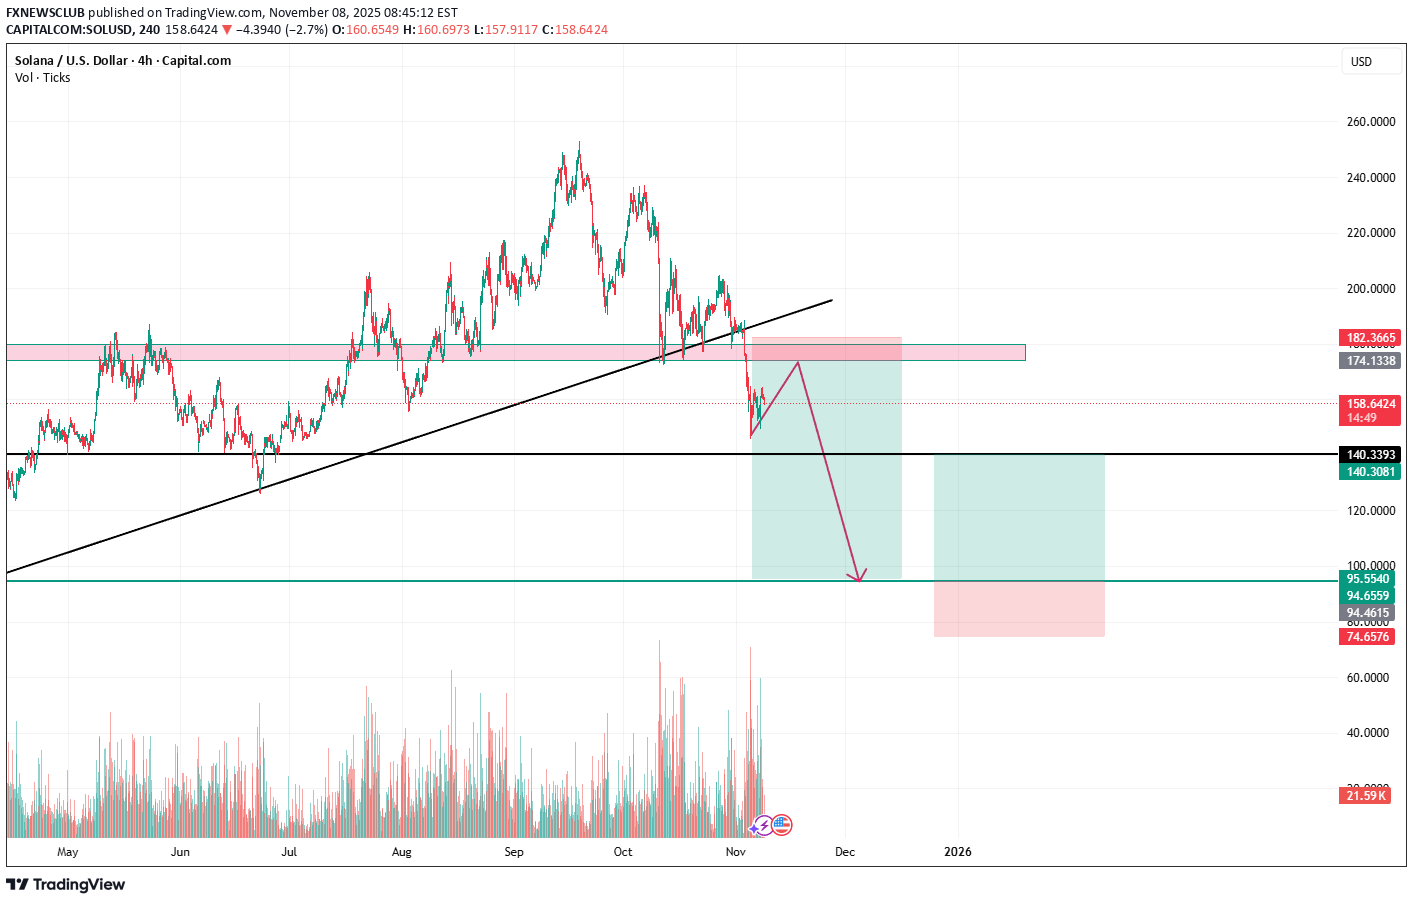
After months of bullish momentum, SOL/USD just broke below the trendline — showing early signs of bearish reversal. 📉 Setup Idea: Price broke trendline support Now retesting the $174–182 resistance zone If rejection confirms, next targets → 🎯 TP1: $140 🎯 TP2: $95–100 ⚠️ Invalidation: If price closes above $182, bearish setup fails. This is a classic break–retest–continuation pattern — watching for confirmation before entry
FXNEWSCLUB
تحلیل طلا (XAUUSD): ادامه مسیر نزولی با ترفندهای پول هوشمند (SMC)
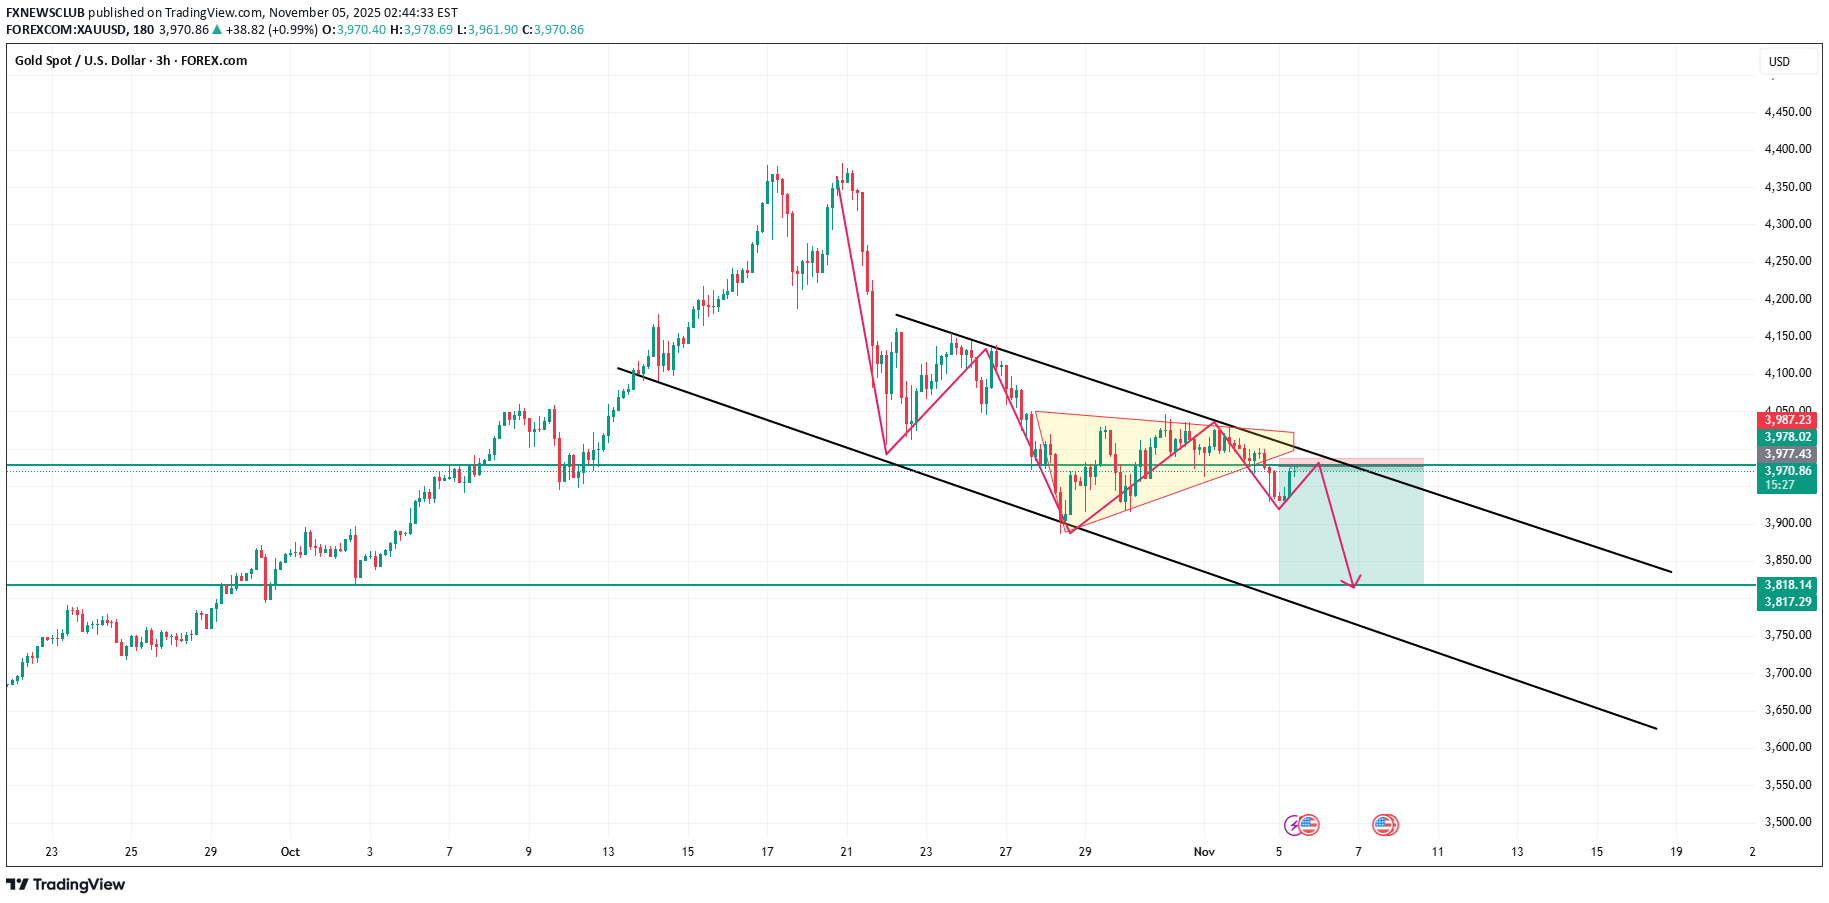
Price Action Analysis: Downtrend Channel Price is trading inside a clearly defined descending channel (black lines). Lower highs and lower lows indicate bearish momentum. Consolidation / Triangle Formation A small symmetrical triangle formed recently (highlighted in yellow). Price broke slightly lower from the triangle, showing continuation of the bearish trend. Support and Resistance Zones: Immediate resistance: ~3,977 – 3,987 (recent highs, triangle top). Immediate support: ~3,818 (previous low & channel support). Recent Price Action: Price attempted a minor bullish retracement toward the upper trendline of the channel. Rejection at the channel line suggests sellers are still strong. SMC / Smart Money Concepts Analysis: Liquidity & Order Blocks The area around 3,977–3,987 looks like a minor order block, where smart money likely absorbed buying before pushing price lower. The drop from ~4,150 was aggressive, indicating market maker liquidity sweep and stop hunt. Breaker / Supply Zones The previous support around 3,818 may act as the next target for stop hunting and liquidity collection. Price retesting the channel resistance acts as a liquidity grab for smart money before resuming the downtrend. Market Structure: Structure broken: Highs around 4,150–4,200 were broken downward, confirming lower high formation. Current structure suggests continuation of the bearish trend until new demand is found. Trading Bias / Plan: Bias: Bearish continuation inside descending channel. Ideal Entry: Short near 3,977–3,987 (retest of broken triangle and channel resistance). Targets: First target: 3,918–3,820 (previous liquidity zone / support). Secondary target: Lower channel boundary ~3,800–3,750 if momentum continues. Stop Loss: Above the recent triangle high ~3,995–4,000. ✅ Summary: Price is showing a clear bearish continuation setup. Smart money concepts suggest this is a liquidity grab before dropping toward the channel support around 3,818. Watch for a rejection at the channel top before shorting. If you want, I can draw and mark all SMC zones, order blocks, breaker areas, and liquidity sweeps directly on this chart for a fully visual trading plan. This usually makes it much easier to execute
FXNEWSCLUB
پیشبینی طلا: آیا تصمیم فدرال رزرو قیمتها را تا مرز 4249 دلار بالا میبرد؟
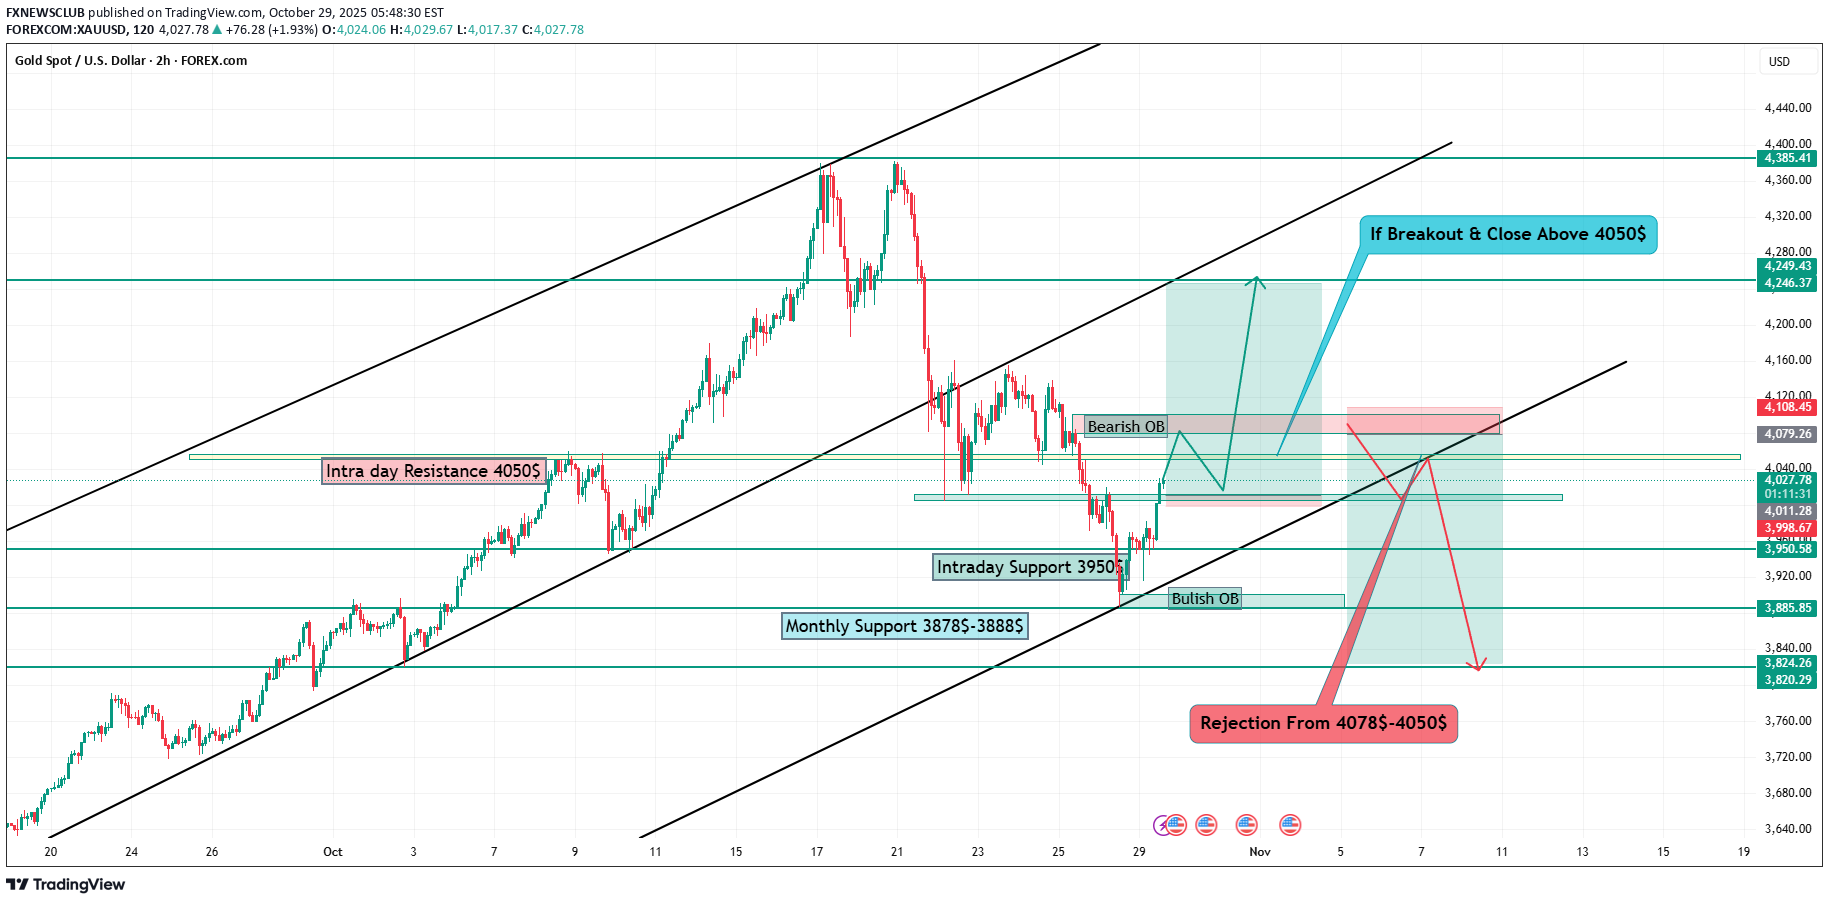
Gold Outlook Ahead of FOMC: Dovish Fed Could Push Prices Higher As the market eyes tonight’s FOMC decision, volatility in Gold (XAU/USD) is expected to spike. Traders are pricing in a 97% probability of a 25 bps rate cut, from 4.00% to 3.75%, making the Fed’s tone a key determinant for the USD and Gold direction. 1️⃣ Fundamental Outlook Rate Cut / Dovish Tone: Likely to weaken the USD, supporting a bullish move in Gold. No Cut / Hawkish Tone: Strengthens USD, which may trigger a Gold correction. Recent data shows softer inflation and slowing job growth, tipping the scales toward a dovish outcome. This aligns with a short-term bullish bias for Gold. 2️⃣ Technical Overview (H1–H4) Gold is currently in a descending channel—a short-term correction within a larger bullish structure. Key levels to watch: TypePriceComment Resistance$4,078–$4,100Channel top & supply zone Intraday Resistance$4,050Potential liquidity grab area Support$3,947Intraday demand zone Major Support$3,874–$3,878Monthly SMC demand block Liquidity Zone$4,005Equal highs area pre-FOMC The monthly support at $3,874–$3,878 has been strongly defended, indicating institutional buying interest. 3️⃣ Price Action & SMC Bias From a Smart Money Concepts (SMC) perspective: A sweep below $3,880 created a strong reversal block, signaling accumulation by institutions. The market is now in a reaccumulation phase, targeting premium levels for liquidity grabs before the FOMC. Order Blocks to Watch: Bullish OB: $3,875–$3,900 Bearish OB: $4,078–$4,100 Price may test above $4,050 to collect stop orders, then react sharply based on the FOMC outcome. 4️⃣ Trading Plan (Scenario-Based) 🟢 Bullish Case (Rate Cut / Dovish Fed): Entry: Break & close above $4,050 SL: Below $4,020 TP1: $4,078 | TP2: $4,135 | TP3: $4,249 SMC View: Break above channel → imbalance fill toward $4,135–$4,250 🔴 Bearish Case (No Cut / Hawkish Fed): Entry: Rejection from $4,050–$4,078 zone SL: Above $4,110 TP1: $3,947 | TP2: $3,874 | TP3: $3,820 SMC View: Premium zone manipulation → continuation of bearish channel correction 5️⃣ Strategic Summary BiasSetupAction Short-termBullish if rate cut confirmedWait for breakout above $4,050 Medium-termConsolidation until FOMC volatility clearsTrade reaction, not anticipation Long-termStill bullish as long as $3,874 holdsPotential expansion toward $4,249+ in November Conclusion: Gold traders should monitor the $4,050 breakout zone for clues. A dovish Fed could propel Gold toward $4,249, while a hawkish surprise may see it revisit $3,874. Reacting to price action post-FOMC is key—anticipation could be risky.
FXNEWSCLUB
تحلیل قیمت طلا: رمزگشایی حرکتهای بزرگ با مفاهیم اسمارت مانی و پرایس اکشن
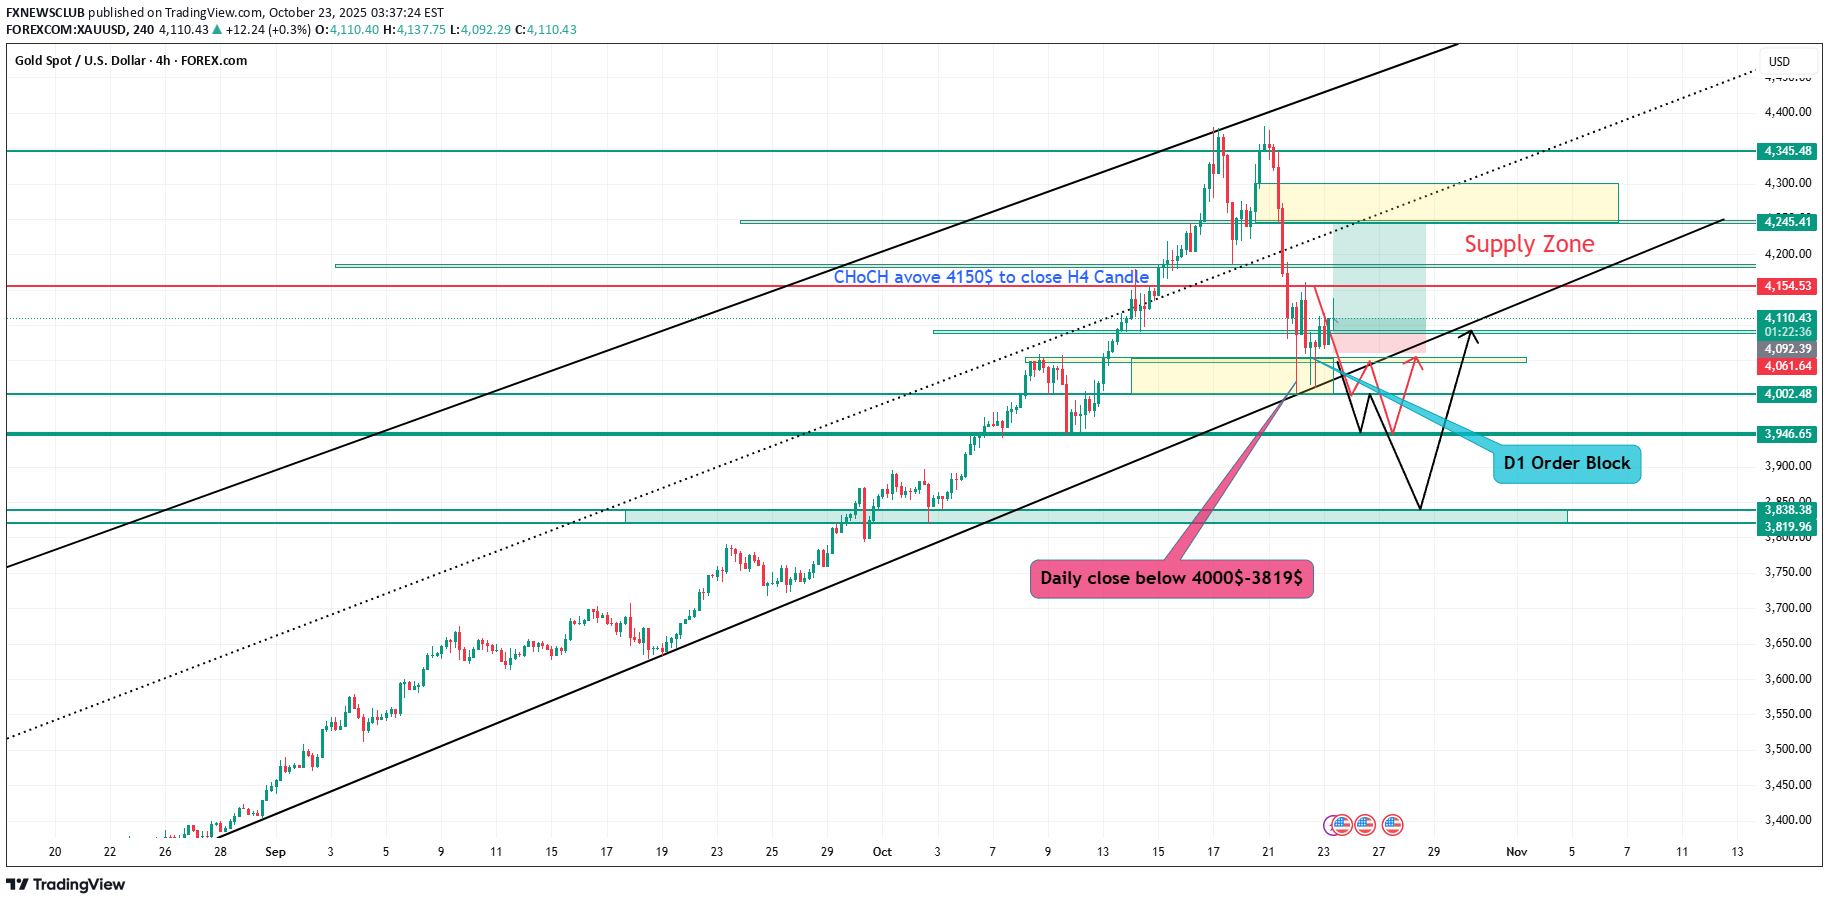
Gold is trading near $4,100, and the market is now showing signs of a possible turning point. After months of steady gains, price has entered a correction phase, but the overall long-term trend remains bullish. In this article, we’ll look at gold’s current structure, key supply and demand zones, and what Smart Money Concepts (SMC) and Price Action are telling us about possible future moves. Market Structure Overview On the daily and weekly charts, gold still maintains a bullish structure, though price is now testing a critical demand zone between $4,050 and $4,100. This zone has acted as a base for buyers in the past, and many institutional traders may look to accumulate new long positions here. The previous swing high sits around $4,350–$4,400, where liquidity likely remains from retail traders’ stop orders. If the larger uptrend is to continue, the market may attempt to revisit or even break above that region in the coming weeks. Smart Money Concepts Breakdown Smart Money traders analyze liquidity, order blocks, and changes in market character to identify where big players are active. Liquidity Sweep: Recently, gold swept liquidity below $4,100 by taking out stops from earlier long positions. This often happens before larger players start buying. Change of Character (CHoCH): A bullish signal will appear if gold closes strongly above $4,150 on the H4 chart. That would mark a structural shift from bearish correction to bullish continuation. Fair Value Gap (FVG): There’s an imbalance between $4,150 and $4,180. If buyers regain control, price may move toward this zone as a short-term target. Order Block: The main bullish order block sits between $4,050 and $4,100 on the daily chart—an area where institutional buying likely occurs. Supply Zones: On the H4 timeframe, supply lies around $4,250–$4,300 and on the daily chart around $4,350–$4,400. These zones can act as profit-taking points for longs or entry zones for potential shorts. Long (Buy) Scenario If gold holds the $4,050–$4,100 support area and breaks above $4,150, it would confirm a bullish change of character. Traders can then look for a pullback toward $4,120–$4,130 to enter long positions. A stop-loss should be placed below $4,040, under the daily order block, to protect against false breakouts. The profit targets for this move could be: TP1 → $4,180 (to fill the FVG) TP2 → $4,250 (H4 supply) TP3 → $4,350–$4,400 (daily supply zone) This setup offers a risk-to-reward ratio of around 1:3 to 1:5 if executed correctly. Short (Sell) Scenario If the bullish setup fails and price rallies toward $4,250–$4,300 but shows strong rejection, this could create a short opportunity from the supply zone. In that case, traders can enter short positions with a stop-loss above $4,330. The profit targets for the short trade would be: TP1 → $4,150 (minor liquidity zone) TP2 → $4,080 TP3 → $4,000 (major psychological level) This would represent a bearish continuation pattern based on rejection from institutional supply. Short-Term Outlook (1–3 Days) In the next few days, gold is likely to retest the $4,150–$4,180 zone. If price rejects from that level, short-term bearish pressure could return, pulling gold back to $4,050. If it breaks and retests the zone successfully, bullish momentum might build again, aiming for $4,250 and above. Long-Term Outlook (1–3 Weeks) The $4,050–$4,000 level is now the key area to watch. If gold remains above it, we can expect accumulation and eventually a rally back toward $4,350–$4,500. However, a daily close below $4,000 would signal a structural shift toward the downside, opening the path to $3,900–$3,850, which is the next weekly demand zone. Summary Table DirectionEntryStop LossTargetsCondition Buy (Swing)4,100–4,1204,0404,180 / 4,250 / 4,350Bullish CHoCH above 4,150 Sell (Retest)4,250–4,3004,3304,150 / 4,080 / 4,000Rejection from supply, bearish BOS Final Thoughts Gold is now sitting in a make-or-break zone. The $4,100 region could become the foundation for the next bullish leg—or the point where sellers take full control. Traders should stay patient, wait for a clear CHoCH confirmation, and manage risk carefully. As always, the market rewards patience and discipline. Following Smart Money Concepts and price action together can help traders align with institutional flow instead of chasing moves blindly. — Md Golam Rabbani
FXNEWSCLUB
طلا پس از حمایت داغ شد: هدف ۴۵۰۰ دلار در دسترس است!
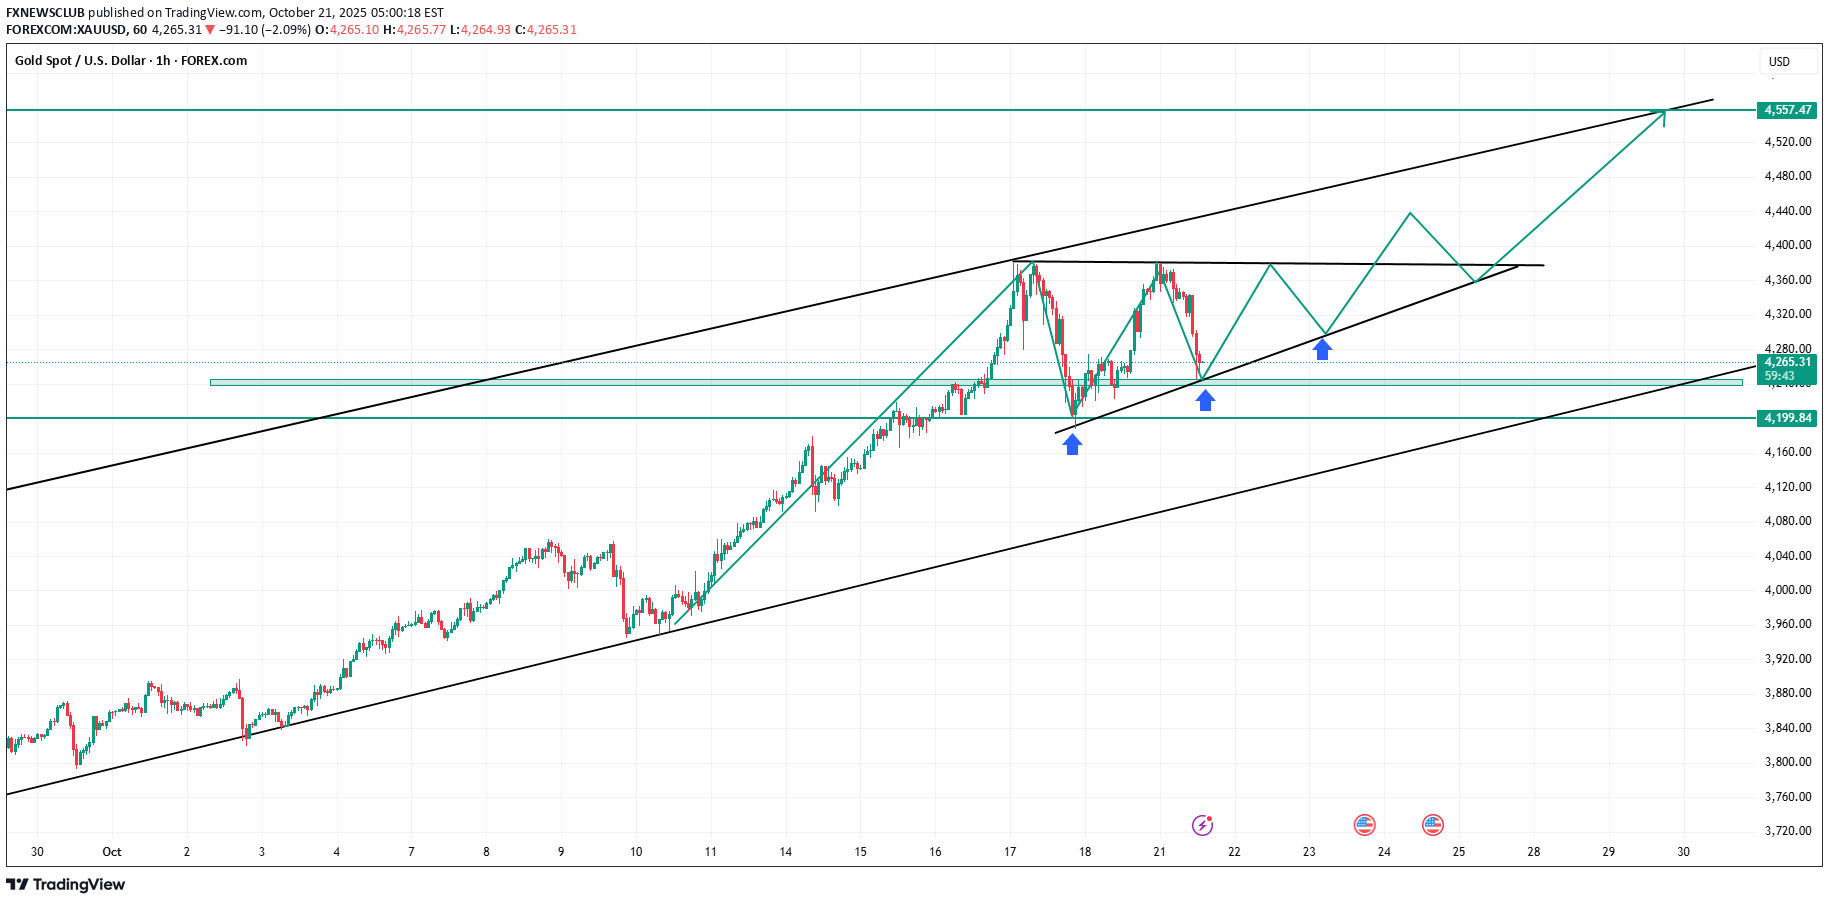
Technical Analysis (1H Chart) Structure: Gold remains in a strong ascending channel, with price consistently respecting both the upper and lower trendlines. The lower black trendline (marked by blue arrows) has acted as a dynamic support multiple times. The upper black line is serving as a trendline resistance, with potential rejection zones near $4,550–$4,560. Current Pattern: Inside the main channel, a smaller parallel structure (rising wedge/inner channel) is forming — showing potential accumulation or continuation within the trend. This usually precedes a breakout move toward the upper zone of the larger channel. Key Levels: Support: $4,200 – $4,220 (Major support zone)** Current Support Zone: Around $4,250 (near trendline confluence and previous rejections) Resistance: $4,455 – $4,560 (target zone / channel top)** Technical Bias: ✅ Bullish above $4,200 support ❌ Bearish breakdown below $4,200 may open room to $4,100–$4,050 💹 Price Action View Triple rejection from the midline shows short-term liquidity grabs before continuation. Each rejection was followed by higher lows, showing buyers’ defense (sign of demand zone creation). The blue arrows represent areas where price tapped liquidity and rebalanced inefficiencies — typical of smart money retracements before continuation. Next expected move: Price may: Tap once more near $4,250 (liquidity sweep of recent lows) Then rally toward $4,450–$4,550 🧭 SMC (Smart Money Concept) Liquidity & Demand Zones: Liquidity below $4,250 (equal lows) Demand Zone: $4,200–$4,240 → ideal institutional entry Imbalance/FVG: Between $4,300–$4,360, which price may fill before next push Market Structure: Higher Highs & Higher Lows intact (bullish structure) Internal BOS (Break of Structure) on minor pullbacks confirms healthy trend Expectation: Re accumulation phase → move to premium zone (above $4,500) SMC Setup Idea: Wait for liquidity sweep at $4,250 Entry: On bullish BOS on lower TF (M15–M30) TP1: $4,400 TP2: $4,550 SL: Below $4,200
FXNEWSCLUB
رالی ۹ ماهه طلا به سقف رسید: نظریه داو چه میگوید؟
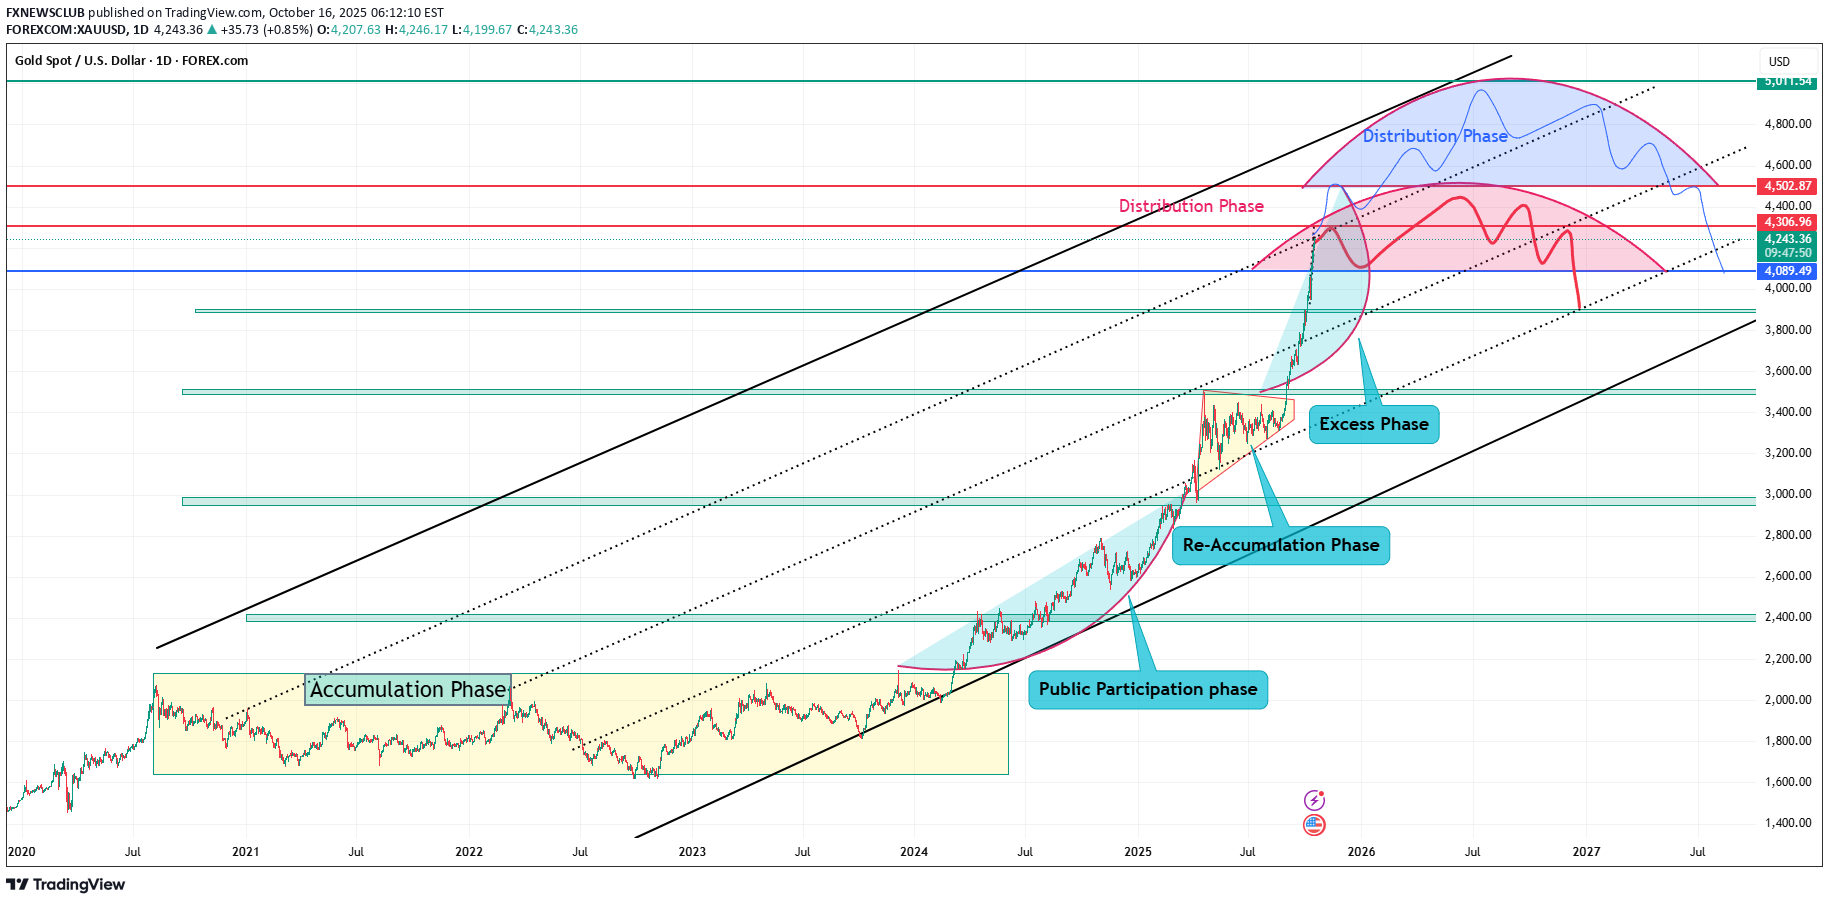
🟡 Gold’s 9-Month Rally Nears the Top Channel — What Dow Theory Tells Us Gold (XAU/USD) has been on a strong run for the past nine months, climbing from around $3,200 to above $4,230. This impressive move has caught global attention, but the chart now shows gold reaching the top of its long-term rising channel — a sign that the market could be losing steam. Let’s break this down using Dow Theory, one of the oldest and most reliable ways to understand market trends. 🔹 1️⃣ The Main Trend – Still Up According to Dow Theory, markets move in large “primary trends” that can last for months or years. Gold’s main trend has been strongly bullish, with clear higher highs and higher lows. This rise has been supported by: Expectations of more U.S. interest rate cuts, Geopolitical tensions, and Ongoing central bank gold buying. All of these have kept investors confident in gold. 🔹 2️⃣ The Three Phases of a Bull Market Dow Theory says every uptrend has three phases — and gold has followed this pattern very clearly: PhaseMarket BehaviorGold’s Example Accumulation PhaseSmart money buys quietly after a downtrend.Started in early 2024 when institutions and banks added gold at low prices. Public Participation PhaseThe trend becomes visible; the public joins in.Most of 2025 saw this phase, with strong rallies and big breakouts. Distribution PhaseLate buyers rush in, while professionals start taking profit.Now, around $4,250–$4,400, gold seems to be entering this stage. At this point, the market is still bullish, but momentum looks overstretched. 🔹 3️⃣ Market Confirmation Dow Theory also says that a trend is stronger when other related markets move in the same direction. Currently, that’s happening: Silver is also rallying, The U.S. dollar (DXY) is weaker, and Bond yields are falling, which helps gold. These signals confirm gold’s main uptrend is still valid — but it won’t last forever. 🔹 4️⃣ Possible Distribution Near $4,250–$4,400 The upper channel area around $4,250–$4,400 could act as a distribution zone, where big traders start selling and prices begin to slow down. Traders should watch for these warning signs: Prices rising but volume dropping, Doji or reversal candles on the weekly chart, Price failing to make new highs after reaching resistance. If this happens, gold could pull back to $3,850–$3,950 before continuing its long-term uptrend. 🔹 5️⃣ Summary — What Dow Theory Says Now Key PointGold’s Status TrendPrimary uptrend (still valid) PhaseShifting from Public Participation → Distribution ConfirmationSupported by silver, USD, and bond market moves Distribution Zone$4,250 – $4,400 Correction Target$3,850 – $3,950 Big PictureBullish long-term, but near-term caution needed 🔸 Final Thoughts From a Dow Theory view, gold’s 9-month rally looks mature. The market has moved fast and far, suggesting it may be nearing a short-term top. This doesn’t mean the trend is over — but it could enter a cooling-off period before the next big move. Smart traders at this stage: Take partial profits, Tighten stop losses, and Watch for early reversal signals. “A trend remains in effect until it gives a clear sign that it has reversed.” — Dow Theory Gold hasn’t shown a reversal yet… but the signs of early distribution are starting to appear.
FXNEWSCLUB
پیشبینی طلا (XAUUSD): صعود قدرتمند یا اصلاح در راه است؟ (تحلیل تکنیکال و بنیادی)
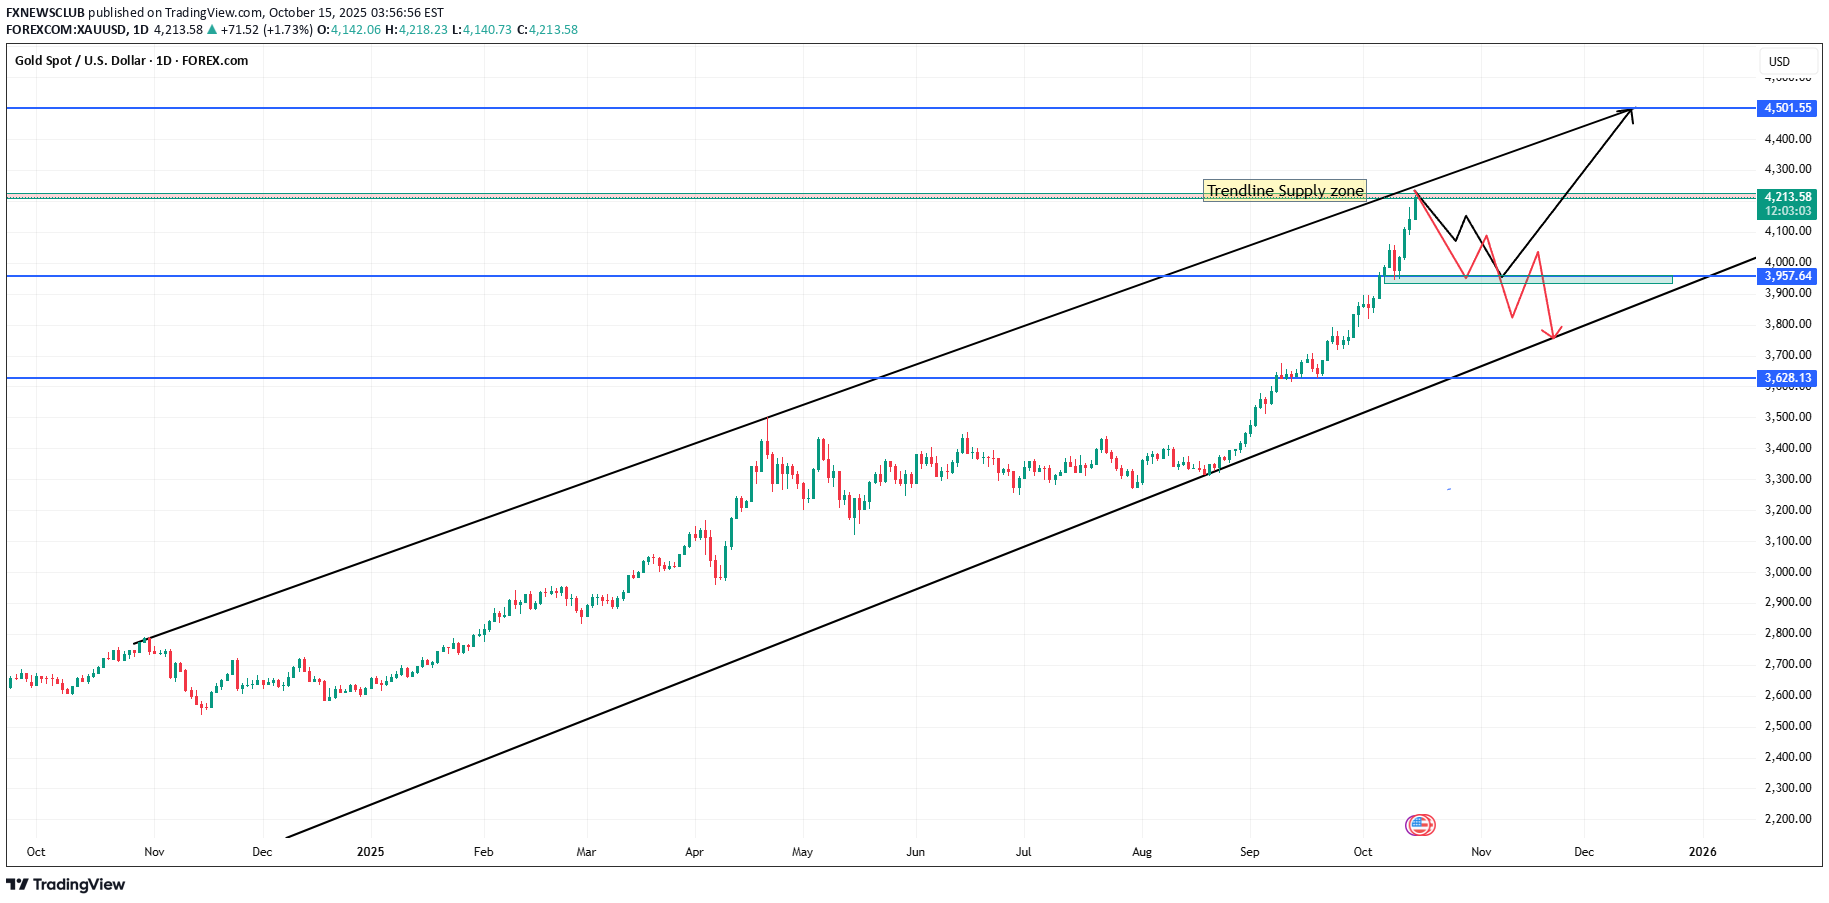
GOLD (XAUUSD) – Technical & Fundamental Outlook Technical View: Gold remains in a strong uptrend, trading within a rising channel. Currently testing the trendline supply zone around 4218–4223, where some short-term resistance is expected. A correction toward 3950 support could occur before the next bullish move. If price holds above 3950, the next potential target remains near 4500. Key Levels: Resistance: 4218 – 4223 Support: 3950 Fundamental View: The outlook stays bullish supported by: Fed’s dovish tone and potential rate cuts. Central bank demand for gold. Geopolitical uncertainties boosting safe-haven flows. Short-term volatility may appear as traders take profits near recent highs, but the broader trend remains positive. 📉 Short-term: Possible pullback to 3950 📈 Medium-term: Bullish continuation toward 4500 This is not financial advice.
Disclaimer
Any content and materials included in Sahmeto's website and official communication channels are a compilation of personal opinions and analyses and are not binding. They do not constitute any recommendation for buying, selling, entering or exiting the stock market and cryptocurrency market. Also, all news and analyses included in the website and channels are merely republished information from official and unofficial domestic and foreign sources, and it is obvious that users of the said content are responsible for following up and ensuring the authenticity and accuracy of the materials. Therefore, while disclaiming responsibility, it is declared that the responsibility for any decision-making, action, and potential profit and loss in the capital market and cryptocurrency market lies with the trader.