Technical analysis by FXNEWSCLUB about Symbol PAXG on 10/23/2025

FXNEWSCLUB
تحلیل قیمت طلا: رمزگشایی حرکتهای بزرگ با مفاهیم اسمارت مانی و پرایس اکشن
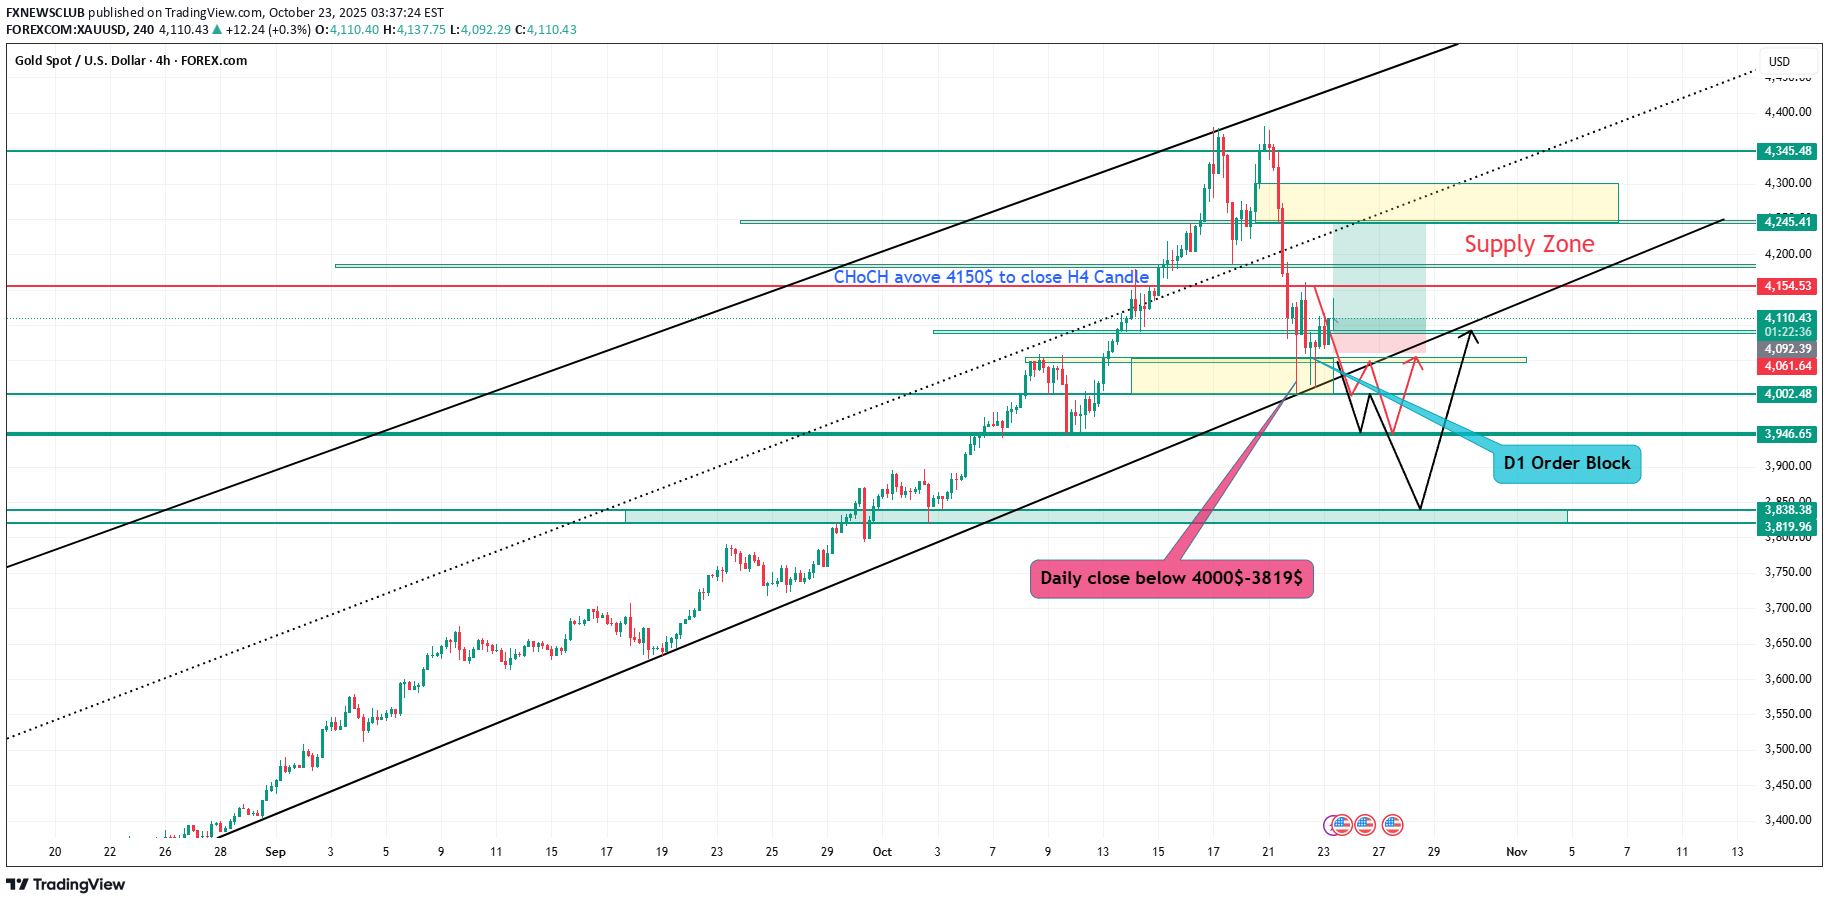
Gold is trading near $4,100, and the market is now showing signs of a possible turning point. After months of steady gains, price has entered a correction phase, but the overall long-term trend remains bullish. In this article, we’ll look at gold’s current structure, key supply and demand zones, and what Smart Money Concepts (SMC) and Price Action are telling us about possible future moves. Market Structure Overview On the daily and weekly charts, gold still maintains a bullish structure, though price is now testing a critical demand zone between $4,050 and $4,100. This zone has acted as a base for buyers in the past, and many institutional traders may look to accumulate new long positions here. The previous swing high sits around $4,350–$4,400, where liquidity likely remains from retail traders’ stop orders. If the larger uptrend is to continue, the market may attempt to revisit or even break above that region in the coming weeks. Smart Money Concepts Breakdown Smart Money traders analyze liquidity, order blocks, and changes in market character to identify where big players are active. Liquidity Sweep: Recently, gold swept liquidity below $4,100 by taking out stops from earlier long positions. This often happens before larger players start buying. Change of Character (CHoCH): A bullish signal will appear if gold closes strongly above $4,150 on the H4 chart. That would mark a structural shift from bearish correction to bullish continuation. Fair Value Gap (FVG): There’s an imbalance between $4,150 and $4,180. If buyers regain control, price may move toward this zone as a short-term target. Order Block: The main bullish order block sits between $4,050 and $4,100 on the daily chart—an area where institutional buying likely occurs. Supply Zones: On the H4 timeframe, supply lies around $4,250–$4,300 and on the daily chart around $4,350–$4,400. These zones can act as profit-taking points for longs or entry zones for potential shorts. Long (Buy) Scenario If gold holds the $4,050–$4,100 support area and breaks above $4,150, it would confirm a bullish change of character. Traders can then look for a pullback toward $4,120–$4,130 to enter long positions. A stop-loss should be placed below $4,040, under the daily order block, to protect against false breakouts. The profit targets for this move could be: TP1 → $4,180 (to fill the FVG) TP2 → $4,250 (H4 supply) TP3 → $4,350–$4,400 (daily supply zone) This setup offers a risk-to-reward ratio of around 1:3 to 1:5 if executed correctly. Short (Sell) Scenario If the bullish setup fails and price rallies toward $4,250–$4,300 but shows strong rejection, this could create a short opportunity from the supply zone. In that case, traders can enter short positions with a stop-loss above $4,330. The profit targets for the short trade would be: TP1 → $4,150 (minor liquidity zone) TP2 → $4,080 TP3 → $4,000 (major psychological level) This would represent a bearish continuation pattern based on rejection from institutional supply. Short-Term Outlook (1–3 Days) In the next few days, gold is likely to retest the $4,150–$4,180 zone. If price rejects from that level, short-term bearish pressure could return, pulling gold back to $4,050. If it breaks and retests the zone successfully, bullish momentum might build again, aiming for $4,250 and above. Long-Term Outlook (1–3 Weeks) The $4,050–$4,000 level is now the key area to watch. If gold remains above it, we can expect accumulation and eventually a rally back toward $4,350–$4,500. However, a daily close below $4,000 would signal a structural shift toward the downside, opening the path to $3,900–$3,850, which is the next weekly demand zone. Summary Table DirectionEntryStop LossTargetsCondition Buy (Swing)4,100–4,1204,0404,180 / 4,250 / 4,350Bullish CHoCH above 4,150 Sell (Retest)4,250–4,3004,3304,150 / 4,080 / 4,000Rejection from supply, bearish BOS Final Thoughts Gold is now sitting in a make-or-break zone. The $4,100 region could become the foundation for the next bullish leg—or the point where sellers take full control. Traders should stay patient, wait for a clear CHoCH confirmation, and manage risk carefully. As always, the market rewards patience and discipline. Following Smart Money Concepts and price action together can help traders align with institutional flow instead of chasing moves blindly. — Md Golam Rabbani