Technical analysis by FXNEWSCLUB about Symbol PAXG: Sell recommendation (10/16/2025)

FXNEWSCLUB
رالی ۹ ماهه طلا به سقف رسید: نظریه داو چه میگوید؟
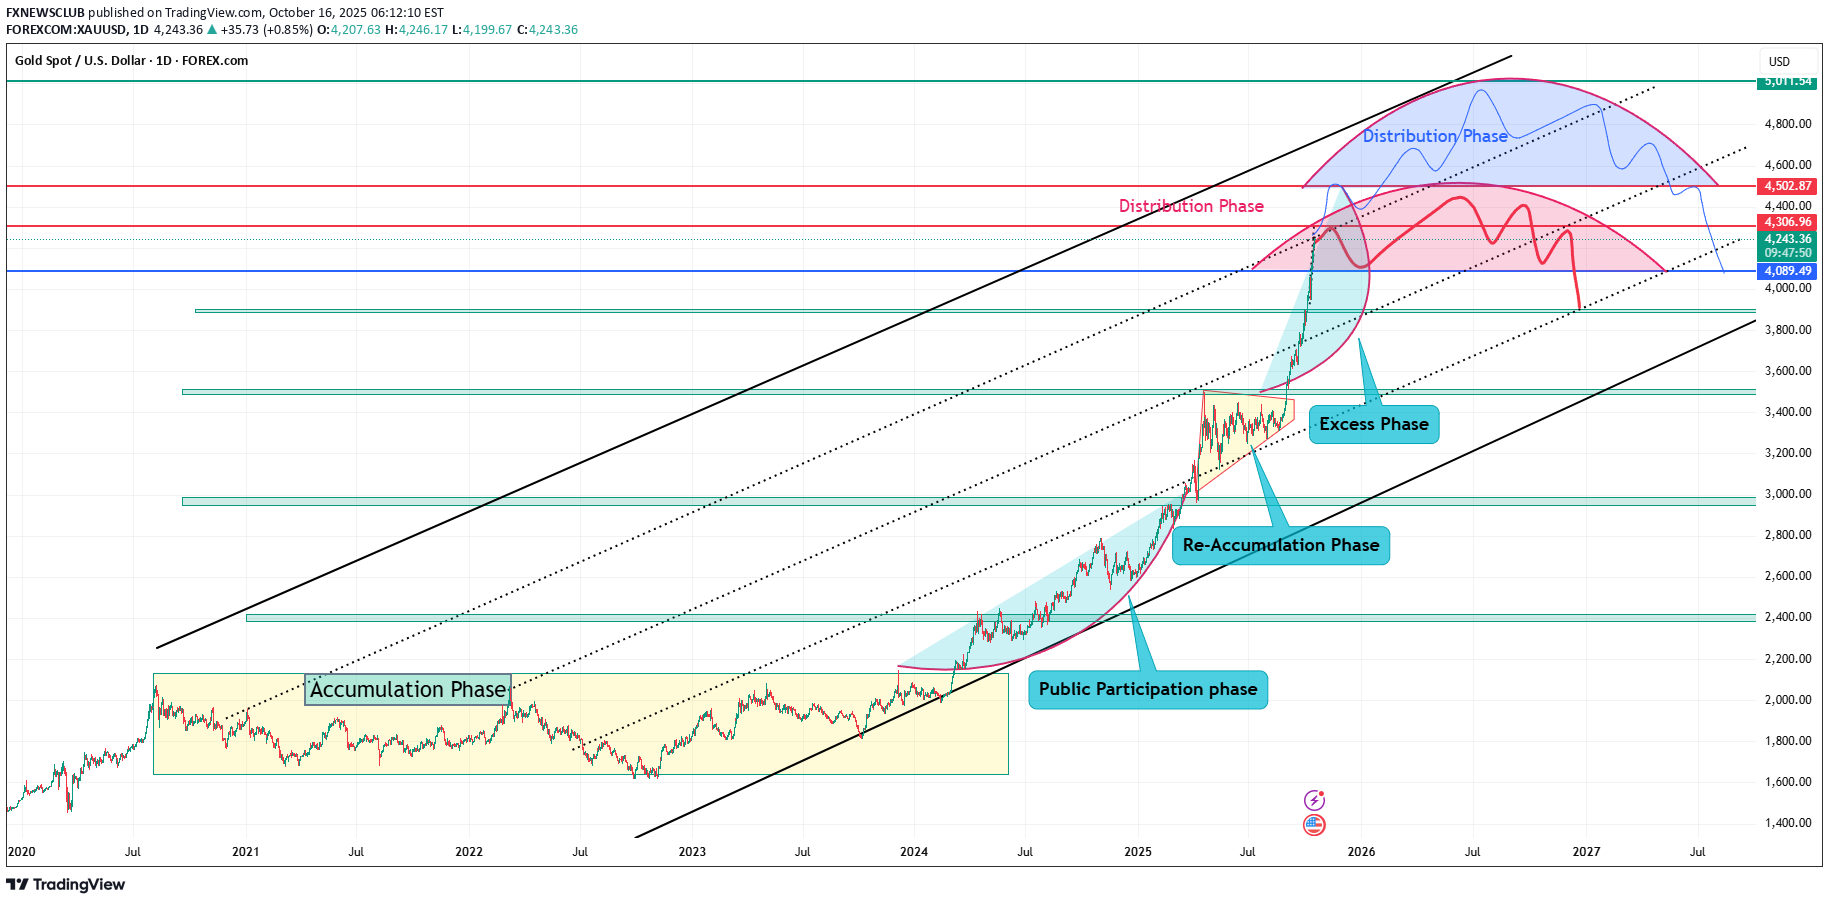
🟡 Gold’s 9-Month Rally Nears the Top Channel — What Dow Theory Tells Us Gold (XAU/USD) has been on a strong run for the past nine months, climbing from around $3,200 to above $4,230. This impressive move has caught global attention, but the chart now shows gold reaching the top of its long-term rising channel — a sign that the market could be losing steam. Let’s break this down using Dow Theory, one of the oldest and most reliable ways to understand market trends. 🔹 1️⃣ The Main Trend – Still Up According to Dow Theory, markets move in large “primary trends” that can last for months or years. Gold’s main trend has been strongly bullish, with clear higher highs and higher lows. This rise has been supported by: Expectations of more U.S. interest rate cuts, Geopolitical tensions, and Ongoing central bank gold buying. All of these have kept investors confident in gold. 🔹 2️⃣ The Three Phases of a Bull Market Dow Theory says every uptrend has three phases — and gold has followed this pattern very clearly: PhaseMarket BehaviorGold’s Example Accumulation PhaseSmart money buys quietly after a downtrend.Started in early 2024 when institutions and banks added gold at low prices. Public Participation PhaseThe trend becomes visible; the public joins in.Most of 2025 saw this phase, with strong rallies and big breakouts. Distribution PhaseLate buyers rush in, while professionals start taking profit.Now, around $4,250–$4,400, gold seems to be entering this stage. At this point, the market is still bullish, but momentum looks overstretched. 🔹 3️⃣ Market Confirmation Dow Theory also says that a trend is stronger when other related markets move in the same direction. Currently, that’s happening: Silver is also rallying, The U.S. dollar (DXY) is weaker, and Bond yields are falling, which helps gold. These signals confirm gold’s main uptrend is still valid — but it won’t last forever. 🔹 4️⃣ Possible Distribution Near $4,250–$4,400 The upper channel area around $4,250–$4,400 could act as a distribution zone, where big traders start selling and prices begin to slow down. Traders should watch for these warning signs: Prices rising but volume dropping, Doji or reversal candles on the weekly chart, Price failing to make new highs after reaching resistance. If this happens, gold could pull back to $3,850–$3,950 before continuing its long-term uptrend. 🔹 5️⃣ Summary — What Dow Theory Says Now Key PointGold’s Status TrendPrimary uptrend (still valid) PhaseShifting from Public Participation → Distribution ConfirmationSupported by silver, USD, and bond market moves Distribution Zone$4,250 – $4,400 Correction Target$3,850 – $3,950 Big PictureBullish long-term, but near-term caution needed 🔸 Final Thoughts From a Dow Theory view, gold’s 9-month rally looks mature. The market has moved fast and far, suggesting it may be nearing a short-term top. This doesn’t mean the trend is over — but it could enter a cooling-off period before the next big move. Smart traders at this stage: Take partial profits, Tighten stop losses, and Watch for early reversal signals. “A trend remains in effect until it gives a clear sign that it has reversed.” — Dow Theory Gold hasn’t shown a reversal yet… but the signs of early distribution are starting to appear.