
EXCAVO
@t_EXCAVO

What symbols does the trader recommend buying?
Purchase History
پیام های تریدر
Filter
EXCAVO
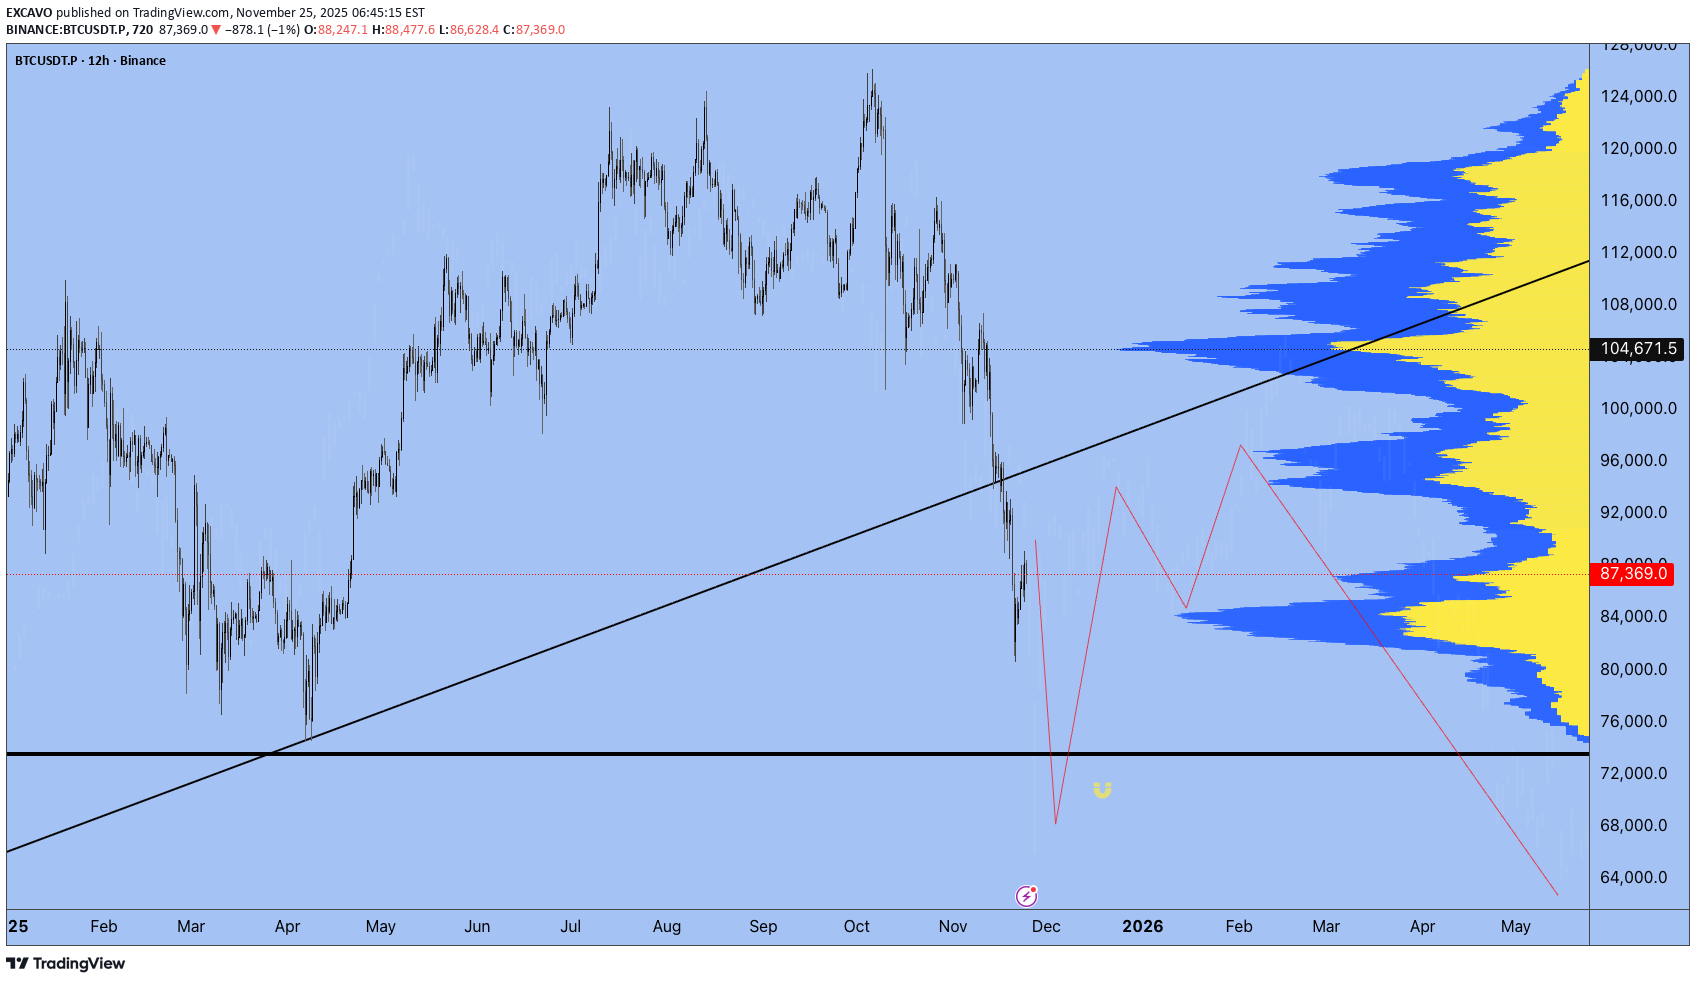
What I Expect from 2026

Scenarios • Markets • Levels • Positioning First of all, I want to thank everyone for the activity under my previous post . More than 300 likes are not just numbers to me — they show that you read, think, and ask the right questions. These are exactly the people who motivate me to keep sharing my perspective. I don’t write for algorithms. I write for those who want real results and understand that results come through process, discipline, and the right environment. This text is not about fast growth or guessing the bottom. It is about patience, structure, and working during moments of maximum pain. In 2026, the market will be selective: opportunities will become fewer, and the cost of mistakes will be higher. This is exactly when an advantage is built — by those who can wait and work systematically, not alone. ___________________________________________ Context and Philosophy of 2026 2026 is a year of reassessment and awareness. A year when the market stops rewarding haste and illusions. We are in a bearish phase, and according to my calculations, it will likely last almost until the end of the year. This is not a time for emotions or hope — it is a time for learning and preparing for the next cycle. It’s important to accept a simple truth: the market does not owe you opportunities every day. No trade is also a position. I’ve been in financial markets since 2009 and in crypto since 2016. I’ve seen how every cycle looks different but ends the same way — disappointment and denial. That is exactly where the market pushes the majority in 2026. ___________________________________________ What Really Happened in 2025 2025 became the year of maximum institutional involvement. ETFs, derivatives, structured products, and complex instruments fully integrated crypto into the global financial system. And the global financial market is: - highly competitive - professional - cold and calculated This is not a place for belief — this is where capital positions, hedges, and extracts liquidity. Crypto remains a young industry, but it is already playing by adult rules. Many failed to understand this — and paid for it. ___________________________________________ The Main Mistake Most Will Make in 2026 Two things: 1. Believing in a quick reversal 2. Increasing risk in an attempt to “win it back” Hope is the most expensive emotion in the market. The market does not pay for hope — it pays for timing, structure, and execution. Most people will leave not because the market is “bad,” but because they will break psychologically. I’ve seen it many times: different cycles, different faces — the same mistakes. If you stay in the market, you must relearn it every cycle. ___________________________________________ Macro Environment and Market Conditions Key factors I’m watching: - interest rates - regulation - capital flow direction - narratives that attract new liquidity Regulation is neither an enemy nor a savior — it is reality. Licenses, requirements, and rules are shaping a market that is becoming part of the global financial system. 2026 is a year of redistribution and accumulation, not growth. Liquidity is fragmented. There are too many projects, too many tokens, and not enough capital for everyone. Stablecoins are growing, but still not enough to “feed” the entire market. ___________________________________________ Altcoins in 2026: My View My position is strict and honest: Most altcoins face collapse, cleansing, and increased regulatory pressure. The reasons are clear: - an excessive number of tokens - fragmented attention - constant unlock pressure - funds sitting in long-term profit - lack of sustainable economics There will be exceptions — but they will be rare. Paradoxically, memecoins (despite my skepticism) did one useful thing: they forced people to learn on-chain analysis, search for inefficiencies, and track capital flows. What remains structurally alive RWA (tokenized real-world assets) infrastructure DeFi v2 as an alternative to the traditional system At the same time, we must be honest: potential returns in altcoins are structurally declining compared to previous cycles. ___________________________________________ Bitcoin — Base Scenario for 2026 and Key Levels My base scenario is continued pressure and bottom formation. Capitulation will affect: - traders - investors - miners - funds - large corporations The market will be cleansed of large holders. This process is always painful — and always necessary. Key ranges - base: 48,000 – 74,000 - extreme zones: 38,000 – 46,000 My operating logic - the first meaningful accumulation zone is around 64k - limit orders are placed lower - buying only during moments of panic - no rush, no emotions There is an old saying: “ We enter the market when there is blood in the streets .” This is not drama — this is how asymmetric advantage is built. Short squeezes are possible, but they will be short-lived. Markets do not trend higher on disappointment. In my view, the final deep phase of this cycle and the shift toward early bullish conditions align closer to September 2026. ___________________________________________ Other Markets and Diversification One of the biggest mistakes crypto traders make is thinking the world ends with crypto. Blockchain is infrastructure — not the entire market. That’s why in 2026 I diversify across: - gold - oil - indices - stocks - and only very selectively crypto assets Other markets are: - more liquid - more structured - often cleaner in execution S&P 500 So far there are no clear reversal signals, but after new highs I expect correction or stagnation. The reasons are obvious: the AI bubble, debt pressure, and liquidity concentration. Gold A historical safe haven. The trend remains intact. My long-term target is $6,000 ± $1,000. DXY Weakening is possible, but the dollar is likely to maintain dominance due to digitization and global settlement demand. Oil One of my key instruments. Expensive oil is not beneficial for the US, and I see no strong reasons for sustainably high prices in the short term. ___________________________________________ Narratives Beyond Crypto The world is reaching the limits of energy supply. Energy is becoming a strategic advantage. Those who produce electricity efficiently will be in a strong position. Alternative energy sources and the entire energy chain will play a key role. AI is not just hype. AI will drive breakthroughs in medicine, energy, data analysis, and financial markets. Global instability is no longer a forecast — it is a condition. We are moving toward a reset of global processes and agreements. ___________________________________________ My Trading Approach in 2026 - more cash - short-biased trading when structure allows - only selective entries - waiting for panic - minimized risk If there is no setup - there is no trade. That is discipline. And one more thing: if you are tired - rest. The market will not disappear. Your capital and your mindset are your main assets. ___________________________________________ Personal Commitment and Community In 2026, I will relaunch the Academy and deeply integrate AI tools. For members of my community, the Academy will be free under specific conditions. Discipline is not motivation. Discipline is the ability to follow a plan regardless of emotions. Growth is slow alone. It is faster in the right environment. I am building a strong trading community where: - thinking evolves - on-chain capital flows are analyzed - portfolios with limit orders are structured - experience is shared, not illusions Some of these portfolios have already started activating, and one position is around +15%. This is not luck — this is systematic work. ___________________________________________ One Honest Question Ask yourself honestly: Are you here to prove something to the market — or to achieve a sustainable result? Because results only come through self-study, discipline, and a repeatable process. ___________________________________________ Final Thoughts Markets reward preparation, not urgency. Give the market time. Give the system time. If you are still here in 2026 — you are already ahead of most. The main task is simple: stay in the game. Build positions when it hurts. Grow when it is quiet. Best regards EXCAVO
EXCAVO
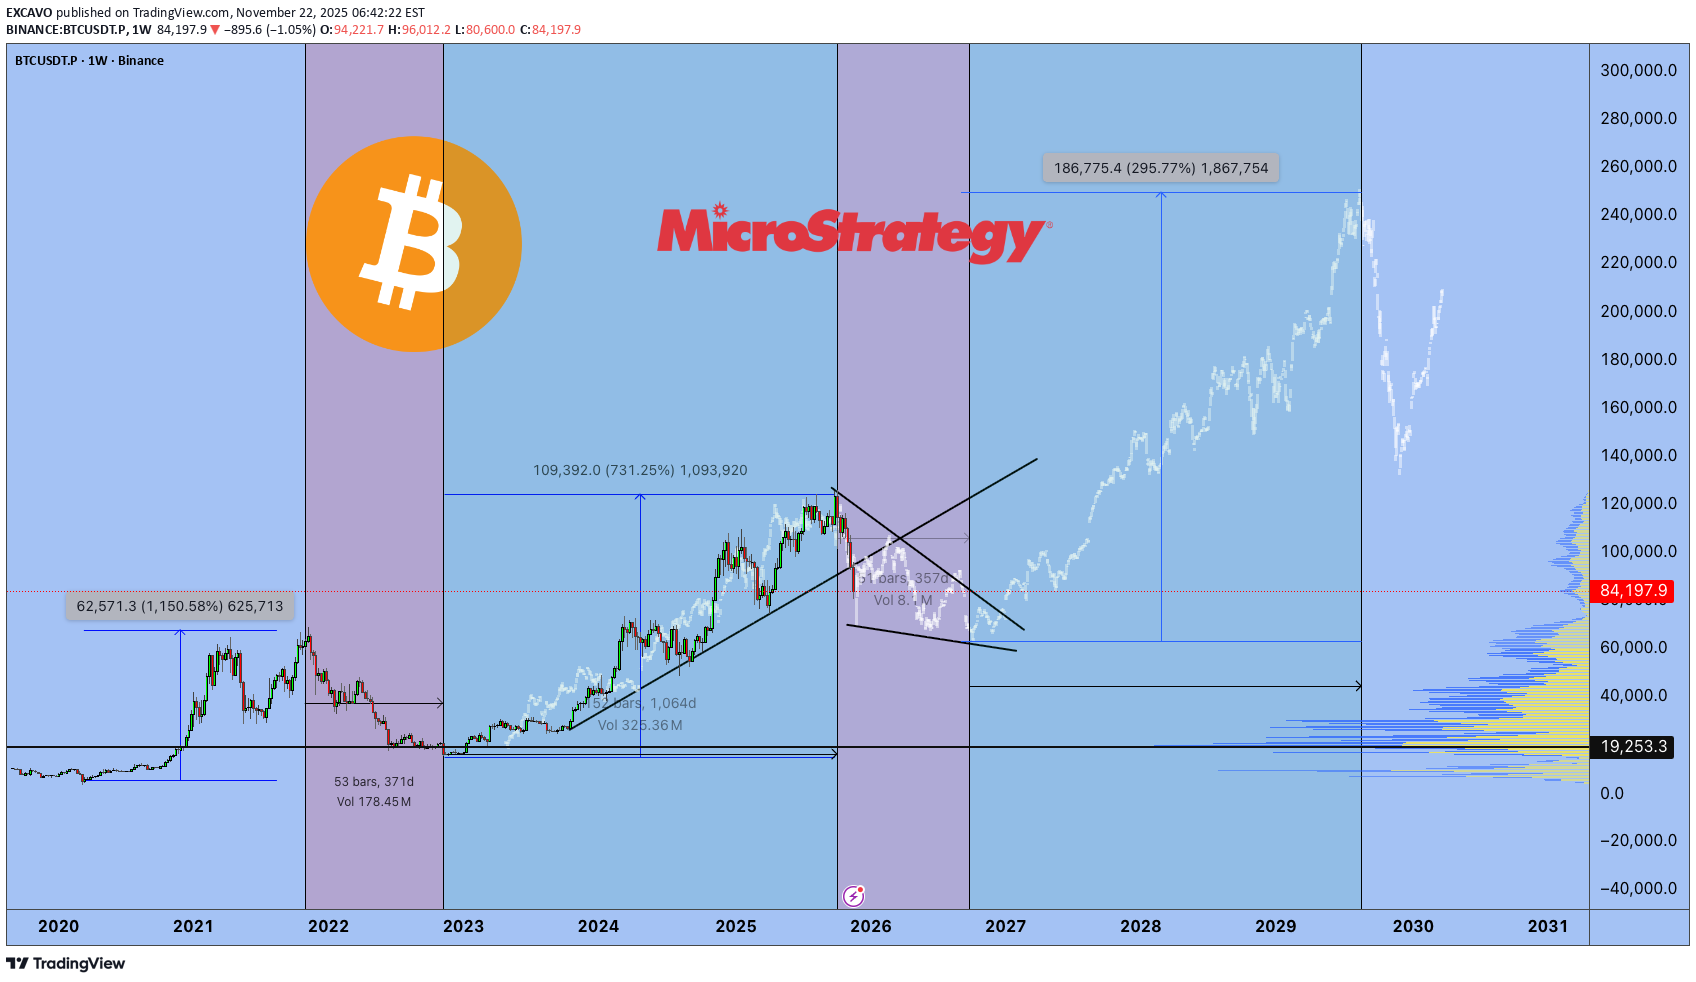
Bull Market 2023–2025: Final Results (27.12.25)

Public history, responsibility, and the environment without which you don’t belong in the market First of all, I want to thank TradingView In 2025, I received the WIZARD badge. This is not just a label — it is recognition of my contribution as an active member of the TradingView Community. For me, this matters not because of status, but because of responsibility. This badge means I have the ability to propose changes and improvements to the platform, and some of these proposals have already been implemented. I’m genuinely glad to be one of those community members who helps make TradingView better for everyone. Why TradingView is about responsibility, not social media I have been an active member of the TradingView Community for a long time, and I strongly believe this platform is fundamentally different from any other financial media space. First — the chart as the core tool of analytical thinking. Second — publications and the Play button, which lock ideas in time. Third — and most important — the impossibility of deleting published ideas. Fourth - indicators You cannot rewrite history here. You cannot erase mistakes. You cannot hide behind “the context has changed.” That is why I approach every single publication on TradingView with full responsibility. Why there is no noise or random content here I do not use TradingView the way many people use Twitter or Telegram. There are no: emotional reactions random thoughts posts made for reach or hype As of December 2025, my audience consists of 132,000 followers, and I fully understand the responsibility that comes with that. Yes, every publication is not financial advice. But for myself, I set a clear internal rule: every idea must be logical, verifiable, and honest. Why the timeline starts in 2023 I intentionally start this review from 2023 because that is when the bottom of the previous cycle was forming. At the time, it was not obvious to the majority of the market: - fear was at its peak - trust was minimal - negative narratives dominated I’ve been in the market for a long time and have lived through multiple full cycles. This Bitcoin cycle was my third, and I consider it the most professionally executed one so far. Each cycle is different: - different narratives - different audiences - different speed But market logic and crowd psychology repeat. Publications that cannot be adjusted after the fact Back in late 2022, an idea was published: Bitcoin cycles + logistic curve = New bull run 2023–2025. This was done before the move, not after. Every marker you see on this chart represents a public idea published in real time on TradingView. It’s important to highlight: - all key ideas were LONG - there were no public SHORT ideas during the bull phase Why? Because in a true bull market, speculating against the trend makes no sense. The upside potential always outweighs the logic of catching small pullbacks. Timing and the end of the cycle If you open each publication, you’ll see: - market phases - time-based expectations - structural projections On most higher-timeframe ideas, the end of the bull market was publicly marked in red. My key time reference was stated in advance — September 2025. September 2025: when most still believed in continuation Starting in September 2025, while market euphoria was still present, I began publishing ideas stating that: - the bull market was over - positions were closed - Bitcoin was forming a reversal - the market was entering a bull trap phase - you were warned in advance These ideas were based not on emotions, but on market structure, cycles, and psychology. Experience, no FOMO, and a mature position After years in the market, I have zero FOMO. I don’t worry about: - missing a coin - missing a narrative - not participating in every move The market is: - fast - volatile - heavily manipulated You cannot be everywhere. The core task of the market is simple: buy low — sell high. That’s exactly what I’ve been doing for over 12 years, with more than 10,000 hours spent in the market. The reality of the modern market Today’s market consists of: - funds - corporations - algorithms - quantitative strategies On lower timeframes and chaotic moves, retail traders are simply outmatched. The gap between emotional decision-makers and those who operate with structure, data, and discipline will only continue to widen. If you are in the market — you must be in the environment Here I’ll be as direct as possible. If you are in financial markets, if you plan to continue trading, if you want to survive and adapt — you must be part of a strong community. A lone trader in today’s market is easy prey. Over the years, a community of like-minded traders has formed around me — people who: approach the market systematically - discuss scenarios - analyze entries and exits - stay connected during difficult periods I share my public ideas for free, and that remains a core principle. But if you truly intend to stay in this market, you need an environment, feedback, and shared logic. What you do next is your decision. Trading is a marathon Trading is not a sprint. It’s a marathon. Sometimes the best position is no position. Sometimes the best trade is the one you didn’t take. Patience, waiting, and discipline are skills — without them, you don’t belong in this market. The current moment and what’s ahead At the moment, crypto is in a phase where I take very few trades. Some positions are already open — at predefined levels, within a structured risk framework. I’m not leaving financial markets: - crypto - Forex - equities - tokenized assets - gold - oil Instruments change. Principles don’t. In conclusion If this chart receives 300 likes, I will publish a separate post outlining: - goals - scenarios - positioning for 2026. Wishing everyone clarity, discipline, and a cold mind. May 2026 be better than 2025. And may there be peace on our planet. Yours, EXCAVO
EXCAVO
اهداف بیت کوین ۲۰۲۵: توهم یا واقعیت؟ حقیقت تلخ پیشبینیها

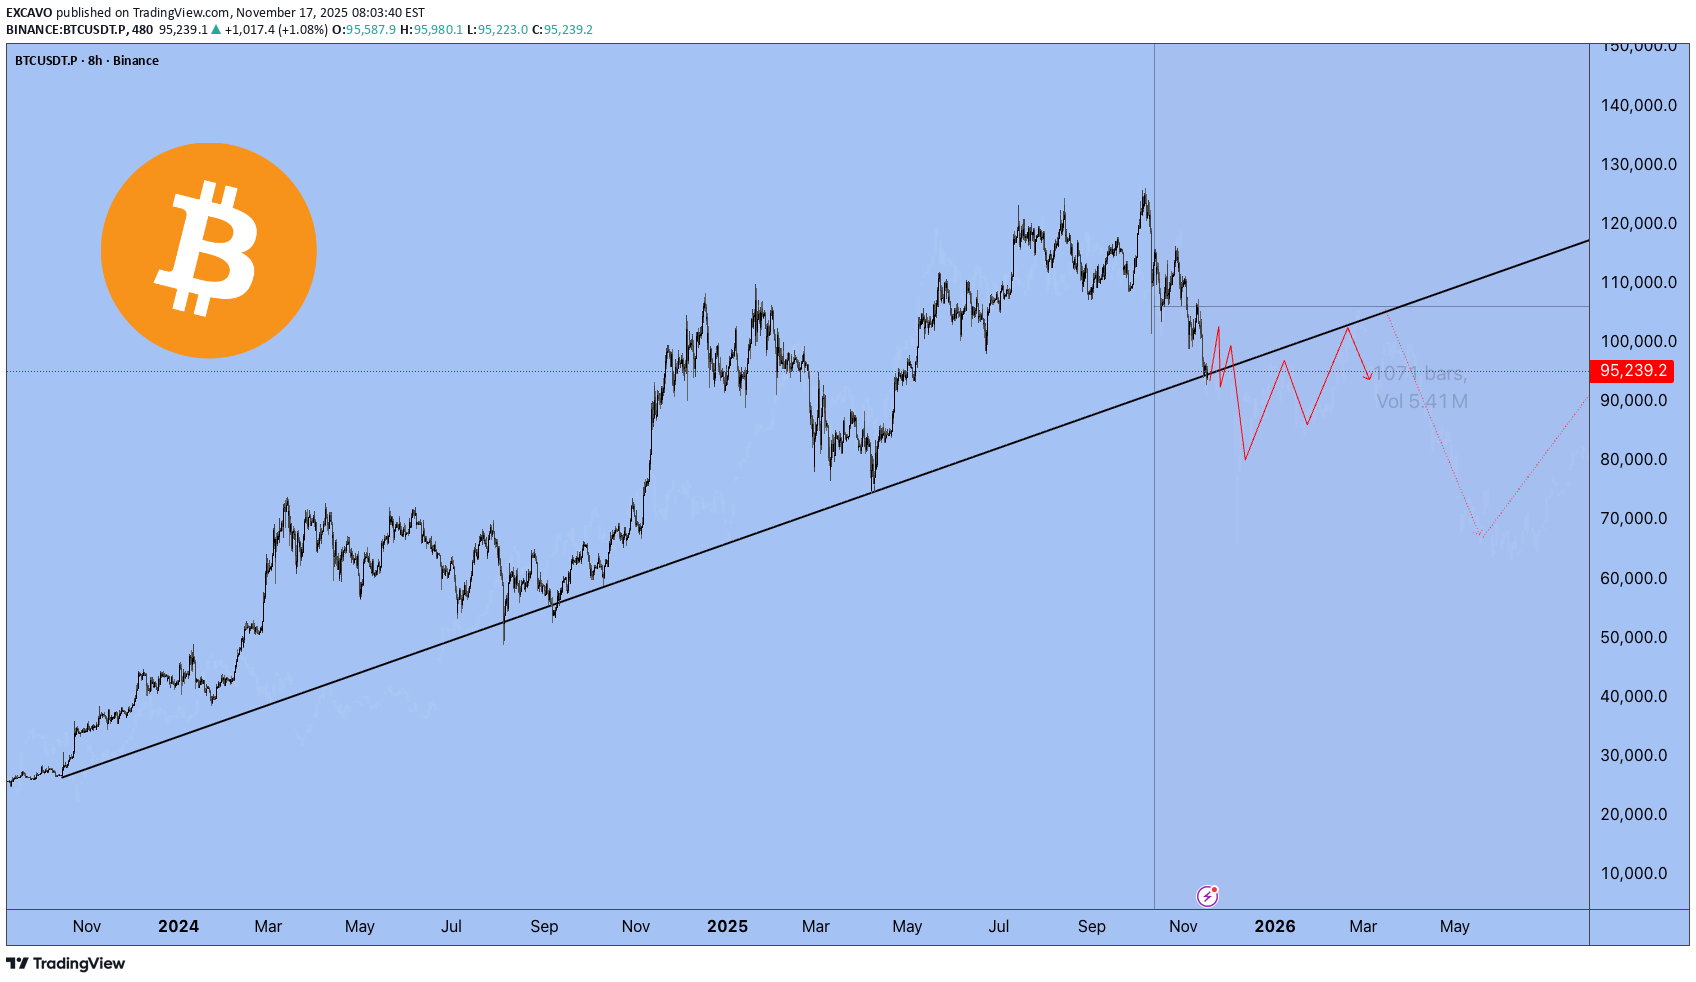
Forecasting is easy. Being right is hard. 1. When Targets Turn Into Illusions Look at this chart. Bitcoin at $90,000. Sixteen days left in 2025. And every “expert” target — JPMorgan, VanEck, Standard Chartered, Tom Lee, Kiyosaki, BlackRock, Cathie Wood — all of them missed. Every single one. Why? Because it’s almost impossible to stay objective when you own the asset you’re predicting. When you hold a position, your mind paints infinity. You stop seeing the market — you start seeing your hopes. You stop analyzing — you start believing. These price targets were never forecasts. They were wishful thinking, dressed up as analysis. 2. My Position — Stay Sane In my posts, I always try to remain objective and grounded. I don’t trade emotions. I observe, analyze, and share what I actually see — not what I want to see. And here’s what I see now: Those bullish targets might still be achieved one day — but not by the end of 2025. Not even by the end of 2026. According to my cycle analysis, the next real bull market peak will come around 2029. And even then, it’s hard to name a precise number. But if history repeats — and each new cycle doubles the previous one — then levels like $250k, $275k, or even $300k are possible. Still, even those words must be questioned. Because the market has one constant lesson — humility. And those who sound most confident are usually the first to be wrong. 3. Why Bitcoin Will Keep Growing Anyway Despite all the chaos and uncertainty, one thing remains clear: Bitcoin will keep growing in the long run. The reasons are structural, not emotional: mining difficulty keeps rising, competition among miners is increasing, the industry is expanding, institutional interest is growing, the circulating supply is shrinking, the market is becoming more concentrated, leveraged, and volatile. We’re witnessing moves that a few years ago were unimaginable. A $20,000 daily swing is no longer shocking — it’s the new normal. Just look back at October 11th — Bitcoin dropped $20,000 in a single day. That’s a record. And it will be broken again. Because the game keeps escalating. Bitcoin won’t die. Unlike thousands of altcoins that fade into oblivion, Bitcoin has too many players, too much capital, too much gravity to disappear. 4. Where We Are Now Let’s be honest — we’re not even halfway through this bear market. Not even close. Maybe 20% of the way. The real pain is still ahead — disappointment, capitulation, and exhaustion. And not only among retail traders. Funds, miners, corporations — all of them will face it. Every cycle demands maximum rejection. It needs the crowd to give up. That’s how markets reset. Bear markets are not crashes — they’re slow, grinding declines that strip away hope. They don’t destroy capital first — they destroy conviction. 5. The Bicycle Metaphor If you plan to stay in this market the whole way down, I’ll compare you to a man riding a bicycle downhill. He tells himself: “Yes, I’m going down, but I’ll keep pedaling. When others quit, I’ll be ahead.” But the truth is — when he reaches the bottom, and the next uphill begins, he’ll have no strength left to climb. He’ll be burned out — mentally, financially, emotionally. He won’t make it up the next mountain. 6. What’s Happening Now Right now, we’re in a correction phase. The impulse move is over. The small bounces you see — they’re not a reversal, just temporary relief before the next leg down. This is not the start of a new bull market — it’s a pause between declines. The macro setup doesn’t support growth yet. The structure isn’t there. The market simply isn’t ready. Every cycle gets heavier. Each one demands more pain, more time, more cleansing. 7. The Bottom Line I have no illusions. No fantasies about instant rallies to $300k. Only realism and patience. The market will sort itself out. But by the time the next real bull run begins, most of those who are still “pedaling downhill” now won’t have the energy — or the faith — to climb again. Best regards, EXCAVO
EXCAVO
The Real Bitcoin Bottom: It’s in the Power Bill

The Cost of Mining 1 BTC – Autumn 2025 Deep Dive First of all, I want to say that I already made a similar publication in 2020 about the cost of Bitcoin, and we reached these levels (the chart is below). Introduction: The Bitcoin mining industry in Autumn 2025 stands at a crossroads. Network difficulty has soared to all-time highs, squeezing miner profit margins as hashpower races ahead of price. The hashprice – the daily revenue per unit of hashing power – has slumped to record lows around $54 per PH/s-day (down from ~$70 a year ago). Analysts expect this metric to languish between $50 and $32 until the next halving in 2028, underscoring how challenging the economics have become. In this environment, understanding the cost to mine 1 Bitcoin is more crucial than ever. Below, we present a detailed comparison of popular ASIC miners and analyze which rigs remain profitable (or not) at current prices. We’ll also explore how the cost of production acts like a magnetic price level for BTC – often drawing the market down to this “floor” before a rebound – and what that means for investors now. Cost to Mine 1 BTC by ASIC Miner Model (at $0.03–$0.10/kWh) To quantify Bitcoin’s production cost, we compare leading ASIC miners from Bitmain, MicroBT, Canaan, Bitdeer, and Block. Table 1 below shows key specs and the estimated cost to mine one BTC under different electricity prices (from very cheap $0.03/kWh to pricey $0.10/kWh): Key Takeaways: Electricity price is the dominant factor in mining cost. At an ultra-cheap $0.03/kWh (possible in regions with subsidized power or stranded energy), even older-generation miners can produce BTC for well under $30k per coin. In our table, all models have a cost per BTC between ~$21k and $27k at $0.03/kWh – a fraction of Bitcoin’s current ~$90k–$95k market price. At a mid-tier rate of $0.05/kWh (typical for industrial miners in energy-rich areas), the top machines still show healthy margins. Bitmain’s flagship S21 XP leads with roughly $36k cost per BTC, while other new-gen rigs fall in the ~$39k–$45k range. These figures imply profit margins of 50–60% for efficient miners at $0.05 power. At a pricey $0.10/kWh (common for retail electricity or high-tariff regions), mining costs skyrocket. Only the very latest ASIC (S21 XP) stays comfortably below the current BTC price, at around $72k per coin. Most other models hover in the $78k–$90k range, meaning their operators are earning little to no profit at spot prices. In fact, at $0.10/kWh, a miner like the Avalon A15 Pro would spend about $89k to generate one BTC – essentially breakeven with Bitcoin at ~$90k. This illustrates why high-power-cost miners struggle or shut off during downturns. Profitable vs. Unprofitable: Current Market Reality Which miners are still profitable at today’s rates? Given Bitcoin’s price in the low $90,000s and typical industrial electricity around $0.05–$0.07/kWh, the newest generation ASICs remain comfortably profitable, while older, less efficient models are on the edge. For example: Latest-gen winners: The Bitmain S21 XP – with industry-best ~13.5 J/TH efficiency – can mine a coin for roughly $36k at $0.05/kWh, leaving a huge cushion against price. Even at $0.07/kWh (a common hosting rate), its cost per BTC would be on the order of ~$50k, still well below market price. Other 2024–2025 flagship units (Whatsminer M60S++, Bitdeer A2 Pro, Block’s Proto) likewise have breakeven power costs around $0.12–0.13/kWh; they remain viable in most regions except the very expensive ones. Older-gen on the brink: By contrast, an earlier-gen workhorse like the Antminer S19 XP ( ~21.5 J/TH) or similarly efficient rigs from 2021–2022 generation become marginal at moderate power rates. An S19 XP mining at $0.08/kWh sees its cost per BTC climb to roughly ~$94k (near current price), and at $0.10 it exceeds $110k (mining at a loss). Many such units are only profitable in locales with <$0.05 power. This is why we’ve seen miners with older fleets either upgrade or retire hardware as the margin for profitability narrows. The efficiency gap: The spread between best-in-class and older miners translates directly into survivability. A miner burning 30–40 J/TH can only stay online if they have extremely cheap electricity or if BTC’s price is far above average production cost. As of Q4 2025, Bitcoin’s price is indeed high, but so is the network difficulty – meaning inefficient gear yields so little BTC that electricity costs outweigh revenue in many cases. According to one industry report, the cost of mining 1 BTC varies widely across companies – from as low as ~$14.4k for those with exceptional power contracts (e.g. TeraWulf’s U.S. facilities) to as high as ~$65.9k for others like Riot Platforms, even before accounting for overhead. (Riot’s effective cost was brought down to ~$49.5k after cost-cutting measures.) This huge range shows how electricity pricing and efficiency determine which miners thrive. In early 2025, the situation became so extreme that CoinShares analysts found the average all-in production cost for public mining companies spiked to ~$82,000 per coin – nearly double the prior quarter (post-halving impact) – and up to $137,000 for smaller operators ixbt.com . At that time Bitcoin was trading around $94k, meaning many miners, especially smaller ones, were underwater and operating at a loss. In high-cost regions like Germany, the breakeven cost even hit an absurd ~$200k per BTC, making mining there utterly unviable. Bottom line: At current prices, only miners with efficient rigs and reasonably cheap power are making money. Those with older equipment or expensive electricity have minimal margins or are already in the red. This dynamic naturally leads to miners shutting off machines that don’t profit, which in turn caps the network hashrate growth until either price rises or difficulty drops. It’s a self-correcting mechanism – one that ties directly into Bitcoin’s production cost acting as a market floor. Production Cost as Bitcoin’s “Magnetic” Price Level There’s a saying in the mining community: “Bitcoin’s price gravitates toward its cost of production.” In practice, the production cost often behaves like a magnet and a floor for the market. When the spot price climbs far above the cost to mine, it invites more hashing power (and new investment in miners) until rising difficulty pulls costs up. Conversely, if price falls below the average production cost, miners start to capitulate – selling coins and shutting rigs – until the difficulty eases and the market finds a bottom. This push-pull keeps price and cost loosely tethered over the long run. Notably, JPMorgan’s research this cycle highlighted that Bitcoin’s all-in production cost (now around ~$94,000) has “empirically acted as a floor for Bitcoin” in past cycles. In other words, the market has rarely traded for long below the prevailing cost to mine, because at that point fundamental supply dynamics kick in. As of late 2025, they estimate the spot price is hovering just barely above 1.0 times the cost (~1.03x) – near the lowest end of its historical range. This implies miners’ operating margins are razor-thin right now, and any extended move significantly below ~$94k would likely trigger miner capitulation and supply contraction. In plainer terms: downside from here is naturally limited – not by hope or hype, but by the economics of mining. If BTC dropped well under the cost floor, many miners would simply turn off machines rather than mine at a loss, removing sell pressure and helping put in a price bottom. History supports this magnetic pull. In previous bear markets, Bitcoin has tended to retest its production cost during the worst of capitulations. For example, during the late-2018 crash and again in the 2022 downturn, BTC prices plunged to levels that put numerous miners out of business. But those phases were short-lived. Prices found support once enough miners quit and difficulty adjusted downward, allowing the survivors to breathe. The market “wants” to stay near the cost of production, as that is a sustainable equilibrium where miners neither drop like flies nor earn excessive profits. Whenever price strays too high above cost, it usually invites a surge in competition (hashrate) that raises the cost floor; when price sinks too low, hashpower falls until cost drops to meet price. It’s an elegant economic dance built into Bitcoin’s design. Why Price Often Meets Cost Before Rebounding If Bitcoin production cost is a de facto floor, why do we often see price fall all the way down to it (or even briefly below it) before the next big rally? The answer lies in miner psychology and market cyclicality: Miner Capitulation & Shakeouts: Markets are cruel to the over-leveraged and inefficient. During bull runs, miners expand operations, often taking on debt or high operating costs under the assumption of continually high prices. When the cycle turns, Bitcoin’s price can free-fall toward the cost of production, erasing margins. The weakest miners (highest costs or debt loads) capitulate first – selling off their BTC reserves and unplugging hardware. This wave of forced selling can push price right to (or slightly under) the cost floor, marking a final “shakeout” of excess. Only when the weakest hands are flushed does the market rebound. It’s no coincidence that major bottoms often align with news of miner bankruptcies or mass liquidations. The Iron Law of Hashrate: Miners are competitive and will run at breakeven or even slight loss for some time, hoping for recovery, rather than quit immediately. This means the network can temporarily operate above sustainable difficulty levels. Eventually, however, reality sets in. When enough miners can’t pay the bills, hashrate plateaus or drops, halting difficulty growth or causing it to decline. At that inflection point, the cost of mining stabilizes (or falls), giving relief to the remaining miners. The stage is set for price to rebound off the now-lower equilibrium. In essence, Bitcoin often has to tag its production cost to force a network reset and purge imprudent operators. Only after that cleansing can a fresh uptrend begin with a healthier foundation. Investor Sentiment at the Floor: From a contrarian market perspective, a convergence of price and production cost typically corresponds with maximum pessimism. If Bitcoin is trading at or below what it “should” cost to make, it signals extreme undervaluation to savvy investors. In late 2022, for instance, estimates of BTC’s cost basis in the $18k–$20k range coincided with the market trading in the mid-$15k’s – a level where miners were going bankrupt and sentiment was in the gutter. Yet those willing to be greedy when miners were fearful reaped the rewards when price recovered. The same pattern could be unfolding now in late 2025: the public is fearful of Bitcoin’s recent pullback, but its cost floor (~$94k) suggests fundamental value support. Smart money knows that when price meets cost, downside is limited and upside potential grows. Conclusion – Steeling Ourselves at the Cost Floor In EXCAVO’s signature fashion, let’s cut through the noise: Bitcoin’s production cost is the line in the sand – the magnetized level where price and reality meet. As of Autumn 2025, that line hovers in the mid-$90,000s, and Bitcoin has indeed been gravitating here. The data shows miners barely breaking even on average. This is a make-or-break moment. If you’re bullish because everyone else is, check your thesis – the real reason to be bullish is that BTC is scraping its cost floor, a level from which it has historically sprung back with vengeance. Conversely, if you’re panicking out of positions now, remember that you’re selling into the teeth of fundamental support. The market loves to punish latecomers who buy high and sell low. Yes, the mining industry is under stress; yes, the headlines scream fear. But those very pressures are what forge the next bull run. Every miner that shuts off today is one less source of sell pressure tomorrow. Every uptick in efficiency raises the floor that much higher, like a coiled spring tightening. Bitcoin has been here before – when production cost and price locked jaws in late 2022, and again in early 2025 post-halving. Each time, the doom and gloom was followed by a dramatic recovery as the imbalances corrected. Our contrarian take: The cost of mining 1 BTC isn’t just a number on a spreadsheet – it’s the secret pulse of the market. Right now it’s telling us that the bottom is in or very near. Prices might chop around this magnet a bit longer, even dip slightly below in a final fake-out, but odds of a deep crash under the ~$94k cost basis are slim. The longer Bitcoin grinds at or below miners’ breakeven, the more hashpower will fall off, quietly tightening supply. When the spring releases, the next upward leg could be explosive (as even mainstream analysts like JPMorgan are eyeing ~$170k targets). In summary, Bitcoin tends to revisit its production cost for one last test – and when it holds, it launches. Autumn 2025 appears to be giving us that test. The savvy, data-driven operator will view this not with panic, but with patience and resolve. After all, if you can accumulate Bitcoin near its intrinsic mining value while the herd is fearful, you position yourself on the right side of the trade once the inevitable rebound kicks in. As the saying goes, bears win, bulls win, but miners (and hodlers) who understand the cost dynamics win big in the end. Brace yourself, stay analytical, and remember: Bitcoin’s true floor is built in watts and hashes, and it’s solid as steel. Best regards EXCAVOYesterday, the network's total hash rate fell by ~100 EH/s, representing a decline of ~8%, with at least 400,000 BTC mining rigs being shut down. The main reason for this is the closure of mining farms in Xinjiang, China.
EXCAVO
INTERVIEW: EXCAVO View 12/12/25

In my previous post, I invited you to ask any questions you had about the current market, the cycle structure, Bitcoin dominance, altcoins, timing, and everything in between. You asked - and here are the detailed answers. This is the continuation of our interview series. I have taken every question from the comments, grouped them under your usernames, and provided full, transparent explanations based on my current market view. Let's dive in. just5 Q: Why do you say the bear market started in November? If it started earlier, why not in October? Where does the 126k top come from? Why is Bitcoin dominance so high? Why haven't many altcoins (ETH, SOL) broken their previous highs? How far can they fall? Your analysis is based on past cycles and fractals. Do you admit you can be wrong? A: I do not define the beginning of a bear market strictly by the date of the absolute top. For me, the trigger is the structure on the weekly timeframe. The formal high was reached in October, but the signal that confirmed the start of the bear phase was the first strong red weekly candle, which appeared in November. That is why I mark November as the beginning of the bear market. The 126k level is not something random - the market simply traded there (around 126,250 USD depending on the exchange). So the level itself is not in question. As for Bitcoin dominance - it is very simple. We have one main instrument in the market: BTC. It defines the weather for the entire crypto market. When BTC rises, some alts rise and others lag. When BTC falls, everything falls - especially assets with weaker liquidity or fundamentals. Historically, people traded a lot of alt/BTC pairs. Many even believed altcoins were created mainly to accumulate more BTC. Today this logic still works: liquidity and attention gravitate toward Bitcoin, which naturally leads to high dominance. Regarding ETH and SOL: I honestly expected ETH to break its previous ATH. On SOL, I have written a separate idea (I will attach the link) where, back when ETH was around $1700 and SOL was around $150, I already said that between these two I prefer ETH because cycles matter. Above $200-250 on SOL and $4900-5000 on ETH there is a large liquidity cluster. The market will eventually go there, but the question is when. This expectation kept many people in top altcoins without taking profit. How far can altcoins fall? My baseline scenario is a 50-60% correction from their peaks, and that is the minimum. Crypto cycles often surprise with deeper drawdowns. Regarding the fractal and cycle approach - yes, my view is based on previous cycles. But of course, I admit that I can be wrong. If I am wrong, I will acknowledge it publicly. TradingView does not allow deleting ideas, everything stays visible, so everyone can judge my track record objectively. louistran_016 Q: If the 41% drop (126k -> 75k) happened in 2 months, why would the move to 60k take another 10 months? Is the 60k downside target too high? Is September 2026 too late for a market bottom? If the previous bottom in 2022 was at the 100-month EMA (around 16k), should not the next bottom be around 44k? A: I never said the drop to 60k must take 10 months. The chart is not obligated to move like "stick down -> stick up". We have only two axes: price and time. The market can: drop quickly, then consolidate, then spend months accumulating before the next move. Even if we hit 60k in 3 months, it does not mean the market will immediately reverse. Accumulation can take time. The 60k target is indeed a "high" bottom for a bear market because it is only about a 50% correction from the peak. I do not exclude deeper scenarios: 60-65-70% drawdowns are normal for crypto. But even 60k is a much better long-term buying zone than 90-100k or current prices. September 2026 is not "too late" in my view. It aligns well with the classical cycle structure: distribution -> decline -> depression -> accumulation. Regarding the 44k idea based on the 100-month EMA: It is absolutely possible. I do not rule it out. But tactically, I first target the 60-64k zone and then will reassess whether deeper levels become realistic. ikkie Q: Many people are calling this a bear market. Is that a bad sign? A: What I actually see is many influencers publicly questioning whether this is a bear market because they did not exit in time, and now it is hard for them to admit it to their audiences. The fact that many people call it a bear market is completely normal. The real question is not how people label the market, but what you do with your money. Being out of the market is also a position, sometimes the best one. When price enters a transition phase, staying flat can be a very strong decision. luaselene Q: What about ETH? A: ETH has a large liquidity zone above $4900-5000. I expect this region to be taken in one of the future bullish phases, but not in the near future. More realistically, this is a 2026-2027 story. Within the current part of the cycle, I do not expect ETH to sustainably break the ATH. mpd Q: I expect a retest of 100k before a crash to 35k. Thoughts? A: A very realistic scenario. A retest of 100k is the perfect psychological trap: it attracts the last wave of euphoric buyers, it loads the market with long positions (usually with leverage), and then the market can wipe them out with a deeper drop, even toward your 35k target. Crypto loves this pattern: round number -> FOMO -> leverage -> liquidation. KoDPrey Q: Why should the drop to 70k lead to a long correction instead of being a quick liquidity sweep before a move to 150-200k? Why do you think this cycle repeats previous ones? Can BTC dominance reach 70% in a bear market? Aren't we in the middle of a bull market? If you were wrong on PORTAL longs, can you also be wrong about the entire cycle? A: I do not think the drop to 70k must be a simple wick with an instant reversal. Historically, Bitcoin cycles include a depression phase where people lose hope, liquidity gets washed out, and even long-term holders capitulate. After this phase, a move toward 150-200-250k makes much more structural sense. A simple "drop -> instant all-time-high" scenario resembles the old "supercycle" meme. Possible? Maybe. Likely? In my view - not now. This cycle is indeed different: almost no broad altseason, many more participants, institutions, and countries involved, much more infrastructure that can liquidate traders' positions, more derivatives, more leverage, more points of failure. But Bitcoin's macro-cycle structure is still fractally consistent. The shapes and speeds change - the logic does not. Can Bitcoin dominance hit 70%? Yes. In crypto anything is possible. I consider this scenario totally realistic, even within a bear market. Are we in the middle of a bull market? In my view - no. I do not think we are anywhere near the middle of a bull run. Regarding PORTAL: yes, I was wrong. And not only there, I have been wrong many times. But even with those mistakes, I closed my positions, exited both spot and margin, and avoided much deeper drawdowns. Of course I can be wrong about the cycle. I am sharing my view, not claiming infallibility. My win rate is far from perfect, and every idea remains public on TradingView. Anyone can check them later. houari14 Q: What do you think about the USDT Dominance index (USDT.D)? Is it reliable? A: Honestly, I barely use USDT.D in my analysis. Yes, it shows whether market participants prefer sitting in stablecoins or taking risk, but for me it is not a primary metric. I focus more on: BTC price, market structure, dominance of BTC itself, volume behavior, and how major altcoins react. anatta_ Q: How far can BTC fall in this bear market? How long will the bear market last? If BTC holds 80-85k for a few months, can it start a new bull cycle? A: I expect at least a 50% correction from the top. Realistically, 60-65-70% drawdowns are absolutely possible. More than 75% I do not consider my baseline, but in crypto nothing is impossible. Regarding duration: My estimation is that the bear market should end toward late 2026. Around September 2026 I expect a major bottom, a zone where long-term accumulation becomes attractive. If BTC holds 80-85k for a few months, yes, theoretically it could trigger a new bullish phase, especially if a strong new narrative appears. But I am not betting on that scenario. I prefer staying out of the market until the cycle structure becomes clear. tommayhew Q: Is there a connection between the recent Cloudflare security incident and the crypto drop? A: The timing was surprising, and it is natural to link the two events. But at this moment I do not see solid evidence that the incident caused the market drop. Maybe more information will appear later, but for now I treat it as a coincidence rather than a catalyst. simplejoe1 Q: We already have ETFs and a pro-BTC U.S. president. Could this be the absolute top? A: ETFs and a pro-Bitcoin president do not automatically guarantee continuous growth, nor do they define the market top. The president also has: his own memecoin, check how its chart looks, his own crypto-investing fund, check its token too. These examples show that one person, even the U.S. president, does not determine the entire market. The market is bigger and more complex than a single headline. Best regards, EXCAVO
EXCAVO
تحلیل اختصاصی EXCAVO: بازار خرسی شروع شد! سطح بحرانی بیت کوین و تله قیمتی پیش رو
1. Do you believe the bear market has already begun? If yes - from what moment? Yes. The bear market started in November 2025. My cyclicality chart shows it clearly: not a single scenario points to continued upside. Every chart I posted on TradingView confirms the trend reversal. 2. What was the main signal confirming the reversal? The 153rd week of Bitcoin’s growth — a historic exhaustion point that almost always marks the end of a cycle. 3. What BTC levels are critical for the downside scenario? The key horizontal level is $74,000. At minimum, I expect a clean wick below it. 4. What fundamental factors accelerated the bear market? A massive overbought environment. The 2-year AI bubble pushed valuations far above fair value. The market became overheated — even though AI is here to stay. 5. Technical factors confirming the decline? We’re dropping without any real reason. Any small headline triggers selling. October 11 wasn’t about Trump — it was a whale manipulation on big exchanges. That’s how late-stage cycles behave. 6. Why did most traders fail to see this reversal? — Short memory — Conditioned for 3 years to “buy every dip” — No exit plan — No clear framework — And of course: they weren’t following EXCAVO 😉 7. Where could BTC go in the coming weeks? First: liquidation of short positions. We may even spike up to $94,000. But that would be a trap before continuation downward. In December, I expect the formation of one of the cycle bottoms. 8. Which scenario seems more likely — panic drop or step-by-step bleed? Most likely: a step-by-step bleed. 9. Is a fake bounce possible before further decline? Yes. I already mentioned it: a short squeeze → then a big drop. Practical Part 10. What are you personally doing in this market? I’m waiting. Observing. Studying. You don’t need to be in a trade every day. Overtrading destroyed more traders than any correction. 11. What should beginners do now? Exactly what professionals do: wait for their entry point. We’re hunters in the bushes — we shoot only when the target is close. 12. What should traders revise in their strategy right now? — Understand where we are in the macro cycle — Identify what’s working — Remove what’s not — Accept that the bear market will be long and exhausting Right now we’re in the hope phase. Disappointment is ahead. Best regards EXCAVO If you have any questions, feel free to ask. In the next post, I can do another interview based on the questions you leave under this one.
EXCAVO
سقوط بزرگ در انتظار مایکرواستراتژی؟ برنامه سایبر در معرض خطر حذف از شاخصها!
MSCI May Exclude Crypto-Heavy Companies: What It Means for MicroStrategy and the Market MSCI recently published a proposal that could dramatically reshape how global indices treat companies with large crypto exposure. According to the framework, companies holding more than 50% of their market capitalization in digital assets may be excluded from national and international indices. This sounds technical - but the consequences are huge. What This Means in Practice If the rule is implemented, companies like MicroStrategy, Bitfarms, Marathon, Hut8, Coinbase, or any firm holding a large percentage of crypto on their balance sheet, may: be excluded from major indices, lose exposure to institutional investors, be off-limits for pension funds, insurers and conservative hedge funds, face reduced liquidity and forced selling. This is not a small development. This is a structural shift. 🧩 Why MicroStrategy Is the Most Exposed MicroStrategy’s business model has been extremely straightforward: issue new shares raise debt (including convertible notes) use the proceeds to buy Bitcoin rising BTC → rising MSTR rising MSTR → more borrowing capacity A perpetual loop. But if MSTR gets excluded from key indices, the loop breaks: passive funds must sell institutional investors face compliance risk liquidity dries up volatility increases borrowing costs rise And remember: MicroStrategy currently trades below the fair value of its Bitcoin holdings. A forced outflow amplifies the structural imbalance. ⚠️ Why Institutions Bought MicroStrategy Instead of Bitcoin Many funds legally cannot buy Bitcoin. They also cannot buy high-risk crypto exchange stocks like Coinbase. But they can buy: reputable corporate debt convertible notes equity from a listed U.S. corporation Michael Saylor gave them a regulatory loophole: “Want Bitcoin exposure? Buy my convertible debt. If BTC rises, convert the notes into shares.” This workaround is now cracking. Convertible Debt Holders Are in a Tough Spot If MSTR is excluded from indices: index funds sell → share price drops falling price → convertible notes lose value institutions holding the debt face losses the balance sheet risk increases This is why regulatory decisions matter so much. Insider Selling: VP of Bitcoin at MicroStrategy Sells ~$19.7M Worth of Stock The timing is… interesting. Started selling on September 18 Sold options-based shares in multiple lots Continued selling until November 14 Total realized profit: ~$19.69M Selling into regulatory uncertainty is not random behavior. It’s a signal. Key Takeaways 1. MSCI’s proposal changes the rules: companies with >50% crypto exposure may become “non-indexable”. 2. MicroStrategy’s core model—borrowing to buy BTC—depends on institutional inflows. Index exclusion disrupts it. 3. Convertible note investors may face severe pressure. 4. Insider selling suggests internal awareness of structural risk. 5. If MSTR is removed from indices, forced selling could create significant downside pressure. 📉 Conclusion MicroStrategy has long been a “Bitcoin ETF before ETFs existed”. Institutions bought MSTR because they couldn’t buy BTC directly. But now: Bitcoin ETFs exist, regulations are tightening, index providers are updating risk frameworks. MicroStrategy may become a victim of its own success strategy. Best regards EXCAVO
EXCAVO
بازار در دمای ۸۰ درجه است: چه اتفاقی در ۱۰۰ درجه (نقطه جوش) میافتد؟
Greetings, everyone. Today, I don't want to talk about the news. I want to talk about what truly matters: market structure. Many traders are currently looking for a news event to explain the current lull and predict Bitcoin's next move. They are looking in the wrong direction. Remember this: the news is not the cause of a move. It's just a convenient explanation handed to you after the move has already happened. For me, the chart is primary. And right now, it's telling a story that most people are not going to like. The Global Picture: An Economy of Bubbles and Boiling Water We live in an era of bubbles. We had the dot-coms, the tulip mania, and now we are witnessing the AI bubble. Yes, AI is a game-changer, and I am actively integrating it into all my processes - it would be foolish to deny this trend. But that doesn't change the fact that the markets are overheated. The entire global economy right now feels like water heated to 80 degrees Celsius. It’s not boiling yet, but the boiling point is near. Something is about to happen, and the steam is getting ready to burst out. The Market's Pulse: Where the Crowd Goes Wrong And what about the crowd? The crowd isn't in Bitcoin anymore. They are trapped in altcoins, having resigned themselves to being "forever waiters." They are praying for an altseason, not realizing that the brief 20-30% pump we saw - that was the altseason. It has already become a meme. I see endless posts about liquidations on social media. The sentiment is desperate. Most have already lost their futures positions or will lose them soon. What reigns in the market right now isn't fear or greed, but rather a slow realization that the bear market never really left. The Main Setup on the Chart: A Classic Liquidity Trap Now for the most important part - what is happening on the Bitcoin chart? As you can see, we are sitting on a critical trendline support. Everyone sees it. Novices and retail traders see this as a clear "buy the dip" signal. And that is part of the game. A deliberate trap is being set: Consolidation : The price is being intentionally held near the support line to create an illusion of strength and to accumulate buyers' positions. Stacking Stop-Losses : Market makers know that the crowd places their stops just below this obvious line. Execution : Once enough liquidity has been built up, a sharp breakdown will occur. This will trigger a cascade of stop-loss liquidations, which will only accelerate the fall. I remain fully on the bearish side until we see a confident break of the all-time high. I view any bounce from the current levels as an opportunity for a better entry into a short position. What's Next? What is my advice to myself for the next 2-4 weeks? Wait. The market is preparing for a great cleansing. A wave of delistings of junk projects and meme coins - which serve no one but the exchanges that use them for hype - is coming. After this cleanse, there will be incredible opportunities to buy at very attractive prices. Now is the time for deep research into the projects you truly believe in. It's time to get your limit orders ready and wait for the market to come to your prices. Thank you for your attention. Regards, Your EXCAVO.
EXCAVO
فاجعه رمزارزها: چرا بازار خونین شد و کف قیمت کجاست؟

I want you to look closely at this chart. These aren't just lines and candles. This is a timeline of warnings. September 12th, 23th, 30th, October 6th, October 10th—I was screaming that the top was in. I told you I was getting out of the market. For this, I received more hate than I have in my entire career. 90% of the comments disagreed with me. But I knew what I was signing up for. I wanted to warn you. And I am grateful to those who listened. And today, we saw the price the market pays for euphoria. This Isn't a Meme. This is a Tragedy Today was not just a "liquidity grab." It was the robbery of 1.6 million traders for $10 billion. And these are not just numbers. Today, a trader I knew from competitions, Kostya Kudo, took his own life. This is no longer a joke. This is not a meme. People are dying. The best are leaving. We cannot watch this like it's some internet meme while real lives are being destroyed. How Did This Happen? The Anatomy of a Perfect Storm Of course, someone dumped a large volume. But why was the fall so deep and so fast? Cascading Liquidations: The first wave of selling triggered a chain reaction. A Vacuum in the Order Book: I've known this since 2019. During crashes like this, market makers simply switch off their algorithms to avoid losing money. They pull their liquidity. The order book becomes empty. Any sell order moves the price down by hundreds, thousands of dollars. This isn't a market. It's a vacuum. The Exchanges Are the Winners: Where are those $10 billion now? With the centralized exchanges. And no one will be compensated. You'll just be told, "Manage your risk next time." Why This Is Only the Beginning. The Road to the Bottom I cannot be liquidated. I am entirely in stablecoins, just as I said I would be. I am tired of this aggressive environment. But why am I certain we are going lower? Only futures traders have been liquidated so far. But there is an army of players using leverage through collateral. They collateralize BTC/ETH, receive stablecoins, buy more BTC/ETH with them, and collateralize again... creating a pyramid. They are waiting for BTC at $200k. With a 40-60% drop from the peak, this pyramid will begin to collapse, causing a new wave of forced selling. The bottom, by my calculations, will be around $60,000 - $65,000. And who needs these liquidations? The major financial players who need a good entry point. They don't buy at the highs. They buy on blood. An Address to Every Trader I want to speak to every one of you. Analysts, traders, investors, speculators. You work alone. One-on-one with your decisions, with your problems, in front of a screen. I have immense respect for everyone who has stepped onto this path. You have entered a hostile environment where the smartest algorithms and entire corporations want to take your money. I am disappointed myself. I was expecting an "altseason" that never came. And I admitted it in time: "Altseason" is a scam. A meme that no longer works with a million coins on the market. This isn't a flip-flop. I was following my plan: stay in until September. To those who are waiting for the market to fly up now "without the excess baggage"—good luck. I am not participating in that. I will return to active buying closer to September 2026. Who is left to push the market up? The 1.6 million liquidated traders? The traders who are no longer with us? This post is not gloating. It is pain. And it is a final warning. Protect yourselves and your capital. Best Regards EXCAVOThe next weekly candle will be red
EXCAVO
BTC is in 'The Final Trap' Before the Crash (Wyckoff Phase C)

In my last post, I announced the end of the bull cycle and shared my game plan for the next two years. I explained WHAT I am doing and WHY from a macroeconomic perspective. In this post, I will show you HOW I came to these conclusions using technical analysis. This isn't a gut feeling. It is a structure that is forming on the chart right now—a classic Wyckoff Distribution scheme. What is Wyckoff Distribution? To put it simply, Wyckoff Distribution is a model that shows how "smart money" (large players, insiders) gradually sells their assets to retail investors at the peak of the market. This process consists of several phases designed to create maximum euphoria and lure in as many buyers as possible before the decline begins. Detailed description: Examples: A Phase-by-Phase Breakdown of the Bitcoin Chart (Refer to your chart, which will be the main feature of the post) Now, look at the Bitcoin chart. The resemblance to a textbook example is striking: Phase A (Stopping the Trend): We saw the Preliminary Supply (PSY) and the Buying Climax (BC), where the uptrend began to lose momentum. Phase B (Building the "Cause"): A prolonged consolidation range where "smart money" began to carefully distribute their positions without crashing the price. Phase C (The Final Trap): The most critical phase. We witnessed the UTAD (Upthrust After Distribution)—a final push upward that created the illusion of a continued rally. This is the moment of peak euphoria, designed to trap the last buyers. This is precisely where we are now. Phase D & E (The Markdown): As the schematic shows, after Phase C, a sustained decline (the Markdown) begins, which marks the start of the bear market. The projected trajectory on the chart aligns perfectly with my plan to stay out of the market until September 2026. Conclusion & Call to Discussion This chart is not a 100% accurate prediction of the future. It is a map of market psychology. It shows that the current situation is not chaos, but a structured process that has happened many times throughout history. It is this structure that gives me the confidence in my decision to exit the market. I don't trust emotions; I trust a system. What do you see on the chart? Do you agree with this analysis? What questions do you have about this schematic? Let's discuss it in the comments. PS. My last post calling the top got a lot of hate. I read the 160+ comments. Here are my answers to the 3 main arguments from the bulls. Argument #1: "But ETFs & Institutions! It's different!" My Answer: New players, same game. The game is human psychology. Euphoria is still euphoria, no matter who's buying. Argument #2: "You're too early! There was no real altseason!" My Answer: Exactly. The lack of a 2017-style altseason proves the cycle is exhausted. The market showed us its peak strength, and this was it. Argument #3: "You're just trying to time the top!" My Answer: I'm not timing the top candle. I'm exiting during the distribution phase. Being early is a strategy. Being late is a catastrophe. The sheer amount of emotional rage in my comments is the final confirmation I need. I stand by my call. See you in 2026. #Bitcoin Best regards EXCAVO
Disclaimer
Any content and materials included in Sahmeto's website and official communication channels are a compilation of personal opinions and analyses and are not binding. They do not constitute any recommendation for buying, selling, entering or exiting the stock market and cryptocurrency market. Also, all news and analyses included in the website and channels are merely republished information from official and unofficial domestic and foreign sources, and it is obvious that users of the said content are responsible for following up and ensuring the authenticity and accuracy of the materials. Therefore, while disclaiming responsibility, it is declared that the responsibility for any decision-making, action, and potential profit and loss in the capital market and cryptocurrency market lies with the trader.