
DAY11
@t_DAY11

What symbols does the trader recommend buying?
Purchase History
پیام های تریدر
Filter
DAY11

DAY11
DAY11
BITCOIN: $103K OR 72K IN 2026
#bitcoin Read Carefully before any act . BTC is forming a SYMETRICAL TRIANGLE pattern ! We have 4h chart for the analysis , lets dive ..... A symmetrical triangle is a neutral chart pattern in technical analysis showing market consolidation, formed by converging trendlines (one is as a resistance, and another is as a support) connecting lower highs and higher lows, indicating indecision before a breakout in the direction of the prior trend . It signals decreasing volatility as buyers and sellers reach in equal state , with traders waiting for a decisive price move above resistance or below support, usually confirmed by increased trading volume, to determine the next trend. Key Characteristics: 1. Trendlines: An upper resistance line (downward sloping) meets a lower support line (upward sloping). 2.Lower Highs & Higher Lows: Price action creates a series of lower highs and higher lows. 3.Continuation Pattern: Often suggests the prior trend will resume after the breakout. How it Works? Formation: The price moves between the lines (Consolidation). Breakout: Wait for the price to the break through either the upper or lower trendline. Volume Confirmation: A real breakout is depend on a significant increase in trading volume. Price Target: Measure the height of the triangle at its widest point and project that distance from the breakout point to estimate the potential price target. Bullish: Breakout above the top line, often continuing an uptrend. Bearish: Breakout below the bottom line, often continuing a downtrend or signaling a reversal. Do Your Own Research , #NFA
DAY11
ETH: $2500? OR $3400?
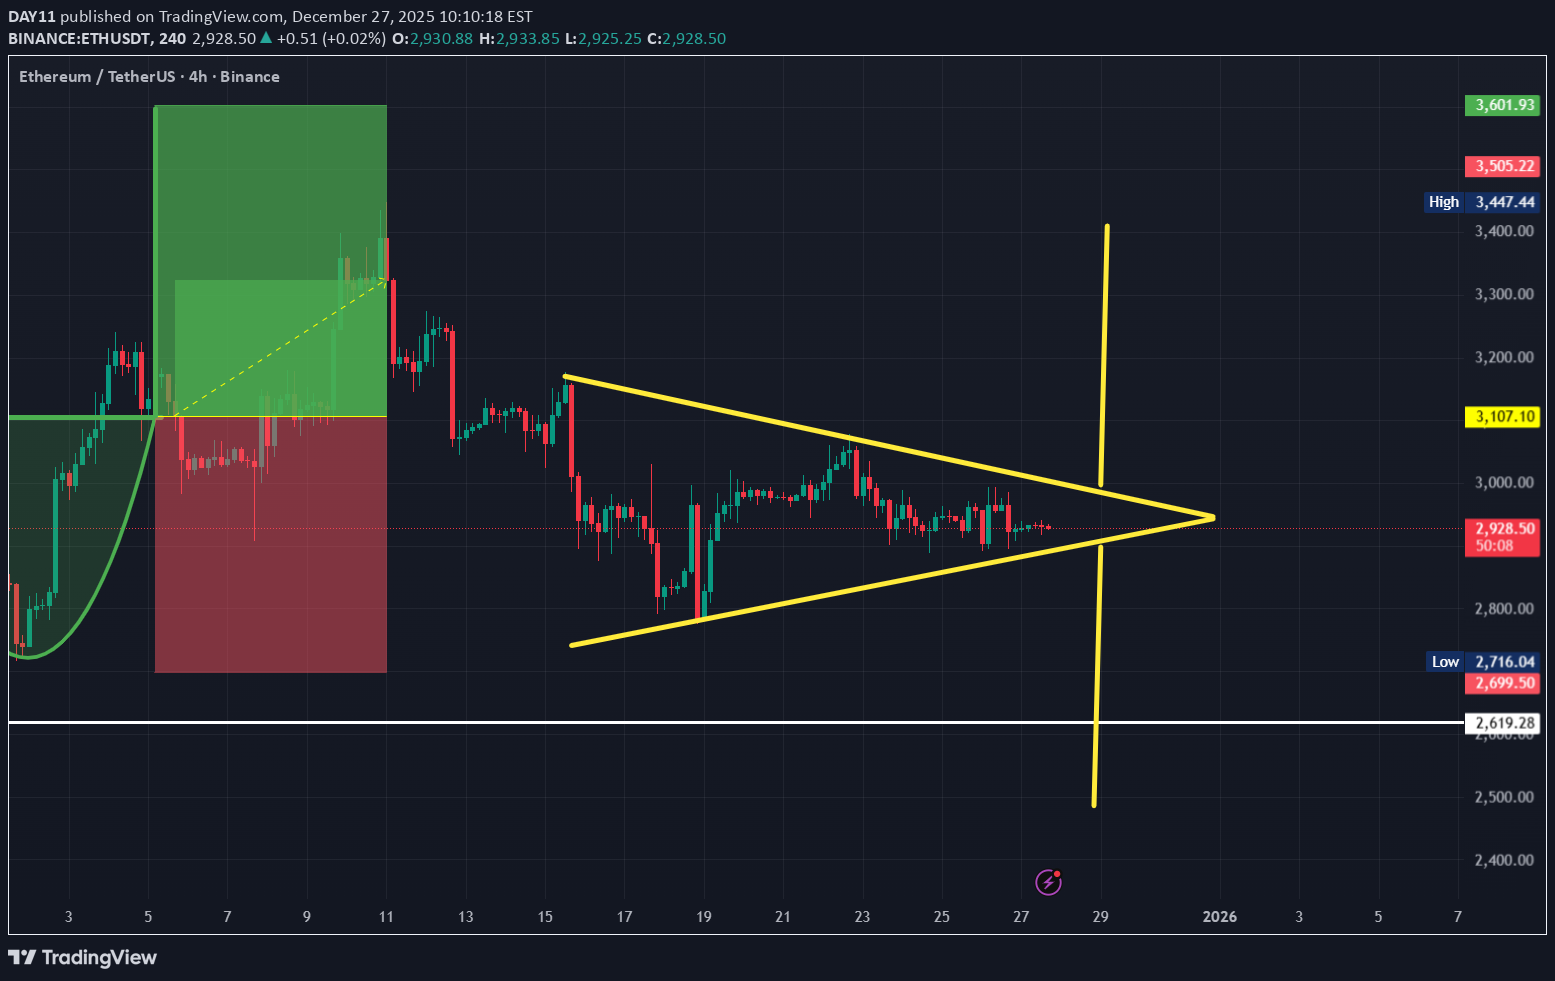
#eth ETH ETH is forming symmetrical triangle pattern in the 4h time frame , which is not complete yet . Be careful and wait to break out . Don't dive into until the break out not happen and confirmation . Note - Do Your Own Research #NFA Trading Strategies- Bullish Breakout:- The price breaks above resistance with high volume; suggests continuation of an uptrend or reversal in a downtrend. Bearish Breakout: The price breaks below support with high volume; suggests continuation of a downtrend or reversal in an uptrend. Stop-Loss: Place just below the breakout point for an upward move or above it for a downward move. Don't Long or Short before break out and confirmation
DAY11
LINK: BEARISH ? HEAD & SHOULDER PATTERN WILL PLAY OUT ?

#link LINK Yes , exactly mentioned in the title LINK is preparing head and shoulder pattern in the 4h chart pattern . Lets dive into chart analysis , Before that - Do Your Own research before taking any action , #NFA (disclaimer) Note - This pattern is not complete , Rules and instructions is mandatory. Here's a Rules on how to effectively trade using this pattern: 1.Wait for the pattern to fully form before trading to avoid false signals. 2.Identify the key components of the pattern-three peaks and troughs, with the head higher than the shoulders, connected by a neckline. 3.An open a position only after the neckline is breached, confirmation is must . 4.The head and shoulders pattern target can be calculated by measuring the distance between the head and neckline. 5.Put the stop-loss above the neckline as per your strategically to manage risk. Do not open a position before break out and confirmation . If the price bounce from the neckline , The pattern will INVALID.
DAY11
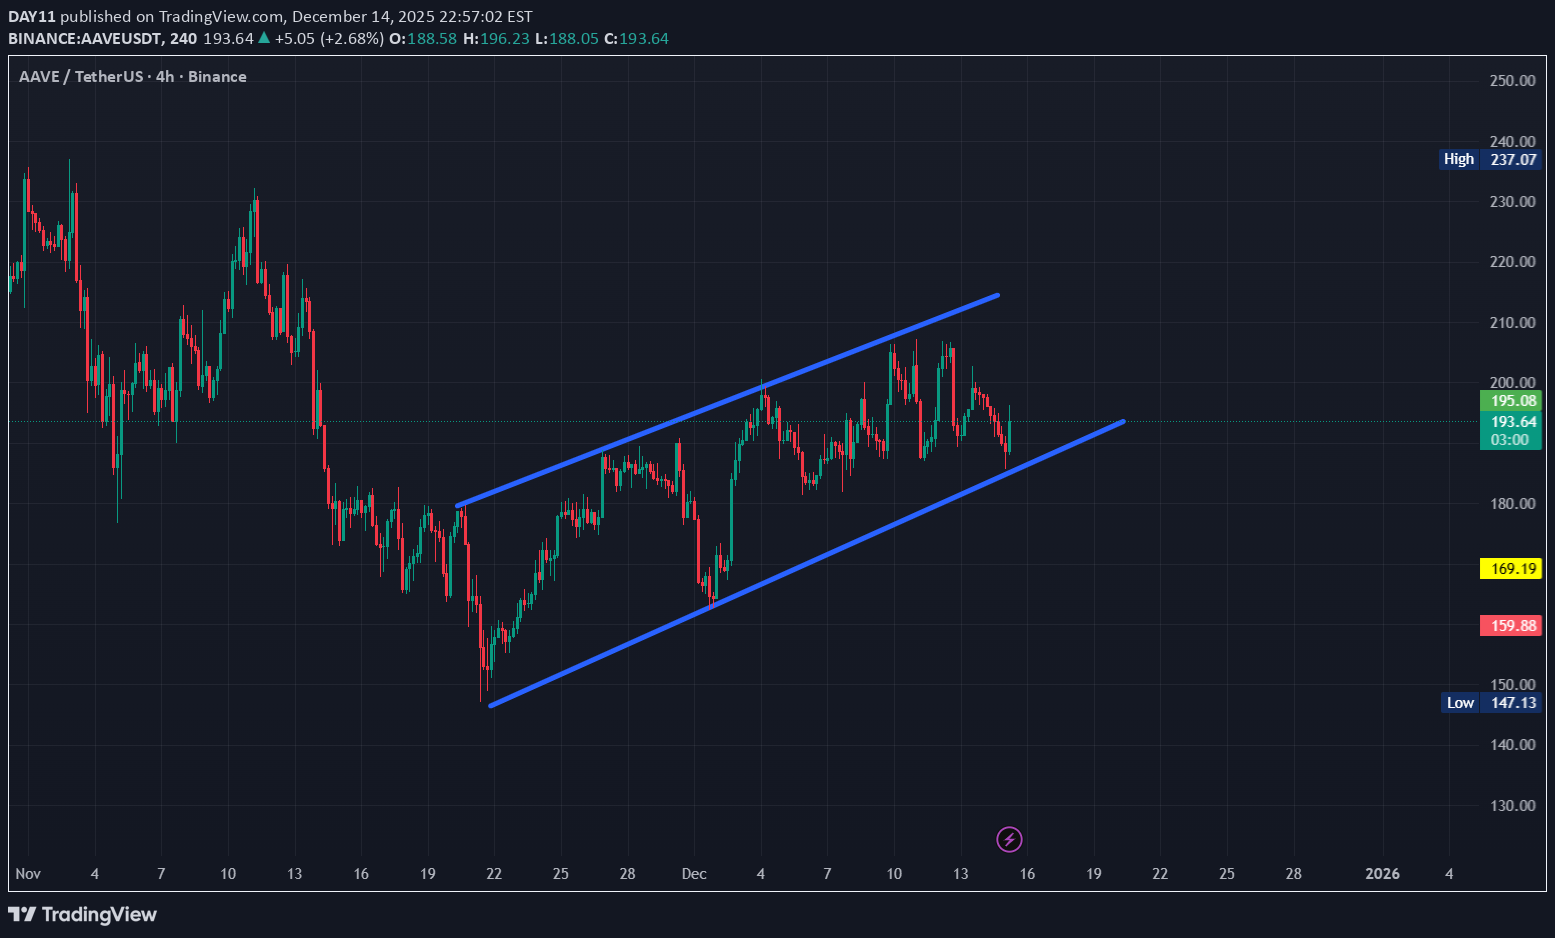
AAVE: HOW DOES ASCENDING CHANNEL WORK?
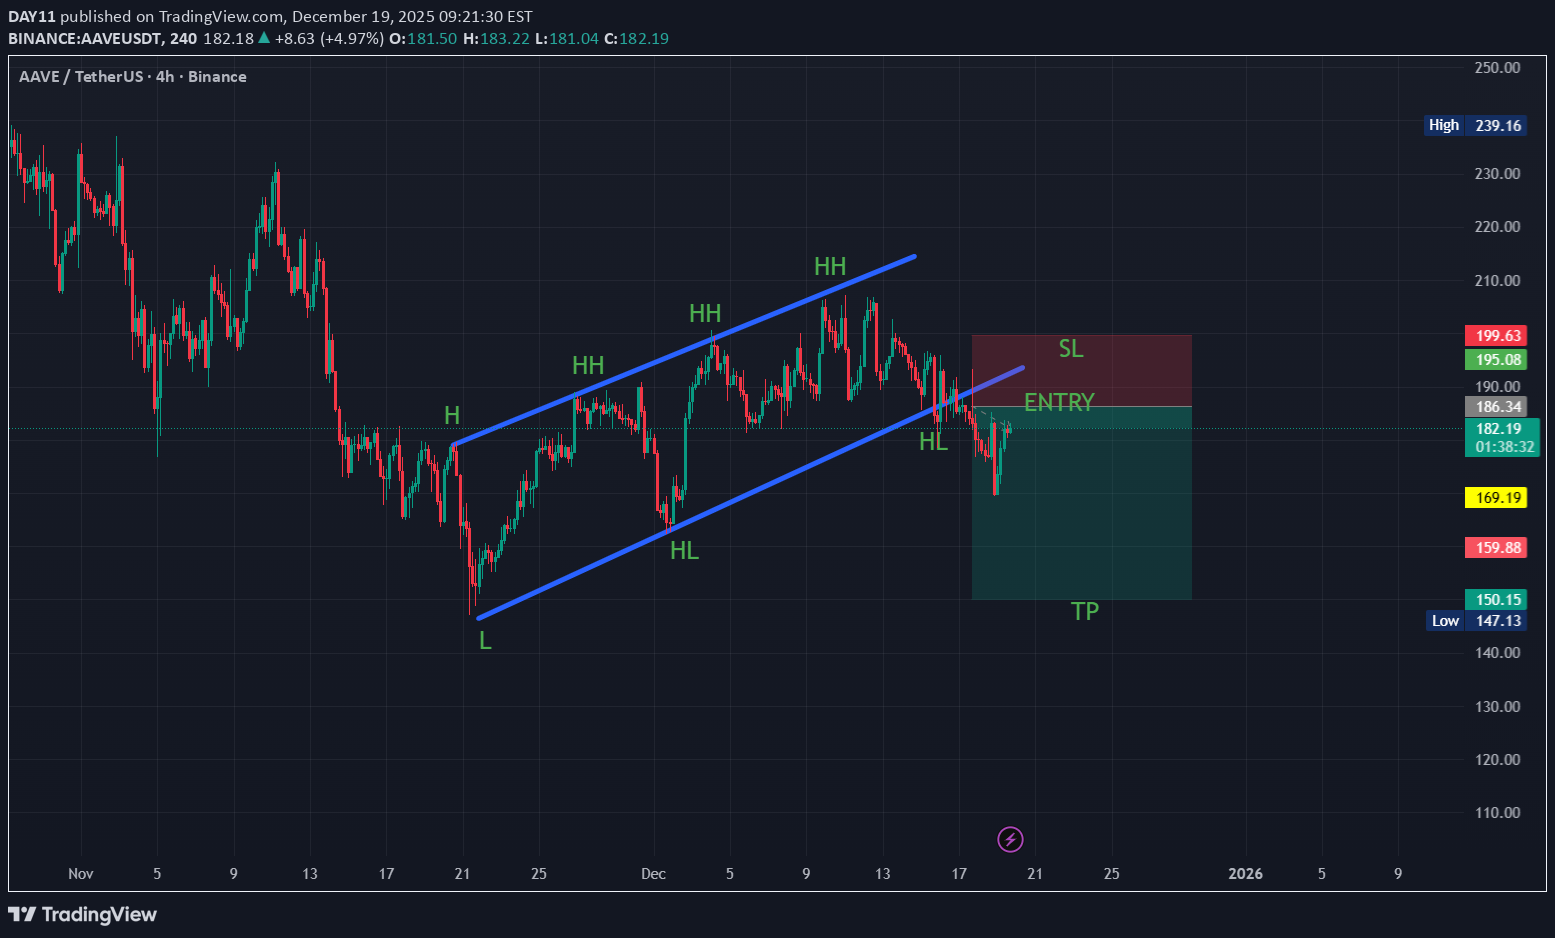
#aave AAVE Exactly mentioned in the title , I would like to explain how to take trade in this pattern. As usual I have 4h chart to explain , lets dive into , Before that - (disclaimers) always Do Your Own Research and #NFA. Here, AAVE breakout happened because the candle closed below the trendline. To identify a valid breakout, a big bearish candlestick must breach through the trendline and should close opposite side. You can use this big candlestick strategy to avoid false channel breakouts, Hope got it. First of all, let’s discuss the stop-loss, take-profit, Entry, and risk management of ascending channel pattern. How to take trade? Open a short position just after the confirmation of ascending channel breakout. You can also wait for the price to give a minor pullback and then place a short position to increase the risk-reward ratio with a stop-loss level. It also depends on the market conditions. Simply wait for a retracement before order entry if the RR ratio is low otherwise open a short position just after channel breakout. Stop-loss ? Place stop-loss above the last higher high made by the price within the channel. Target? The first target is should be at the level from where ascending channel starts (near HL). The second target is should be at near L(where the ascending channel has begun). Risk management? Its very important part of trades , Actually risk reward ratio is depend on traders.
DAY11
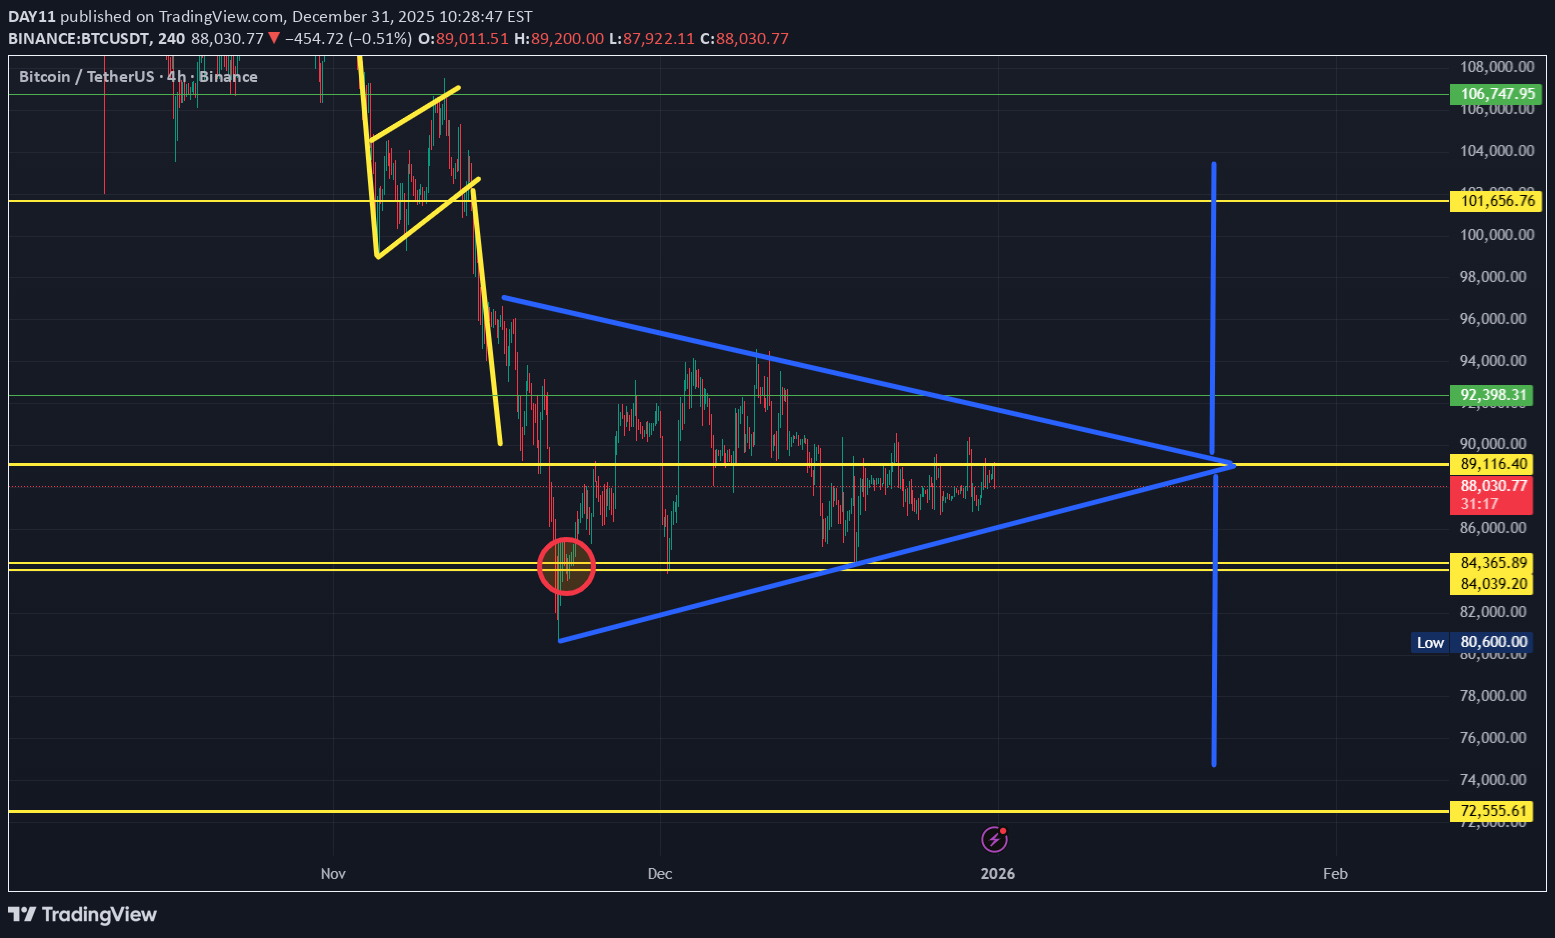
BITCOIN : CRITICAL ZONE - FORMED BEAR FLAG?
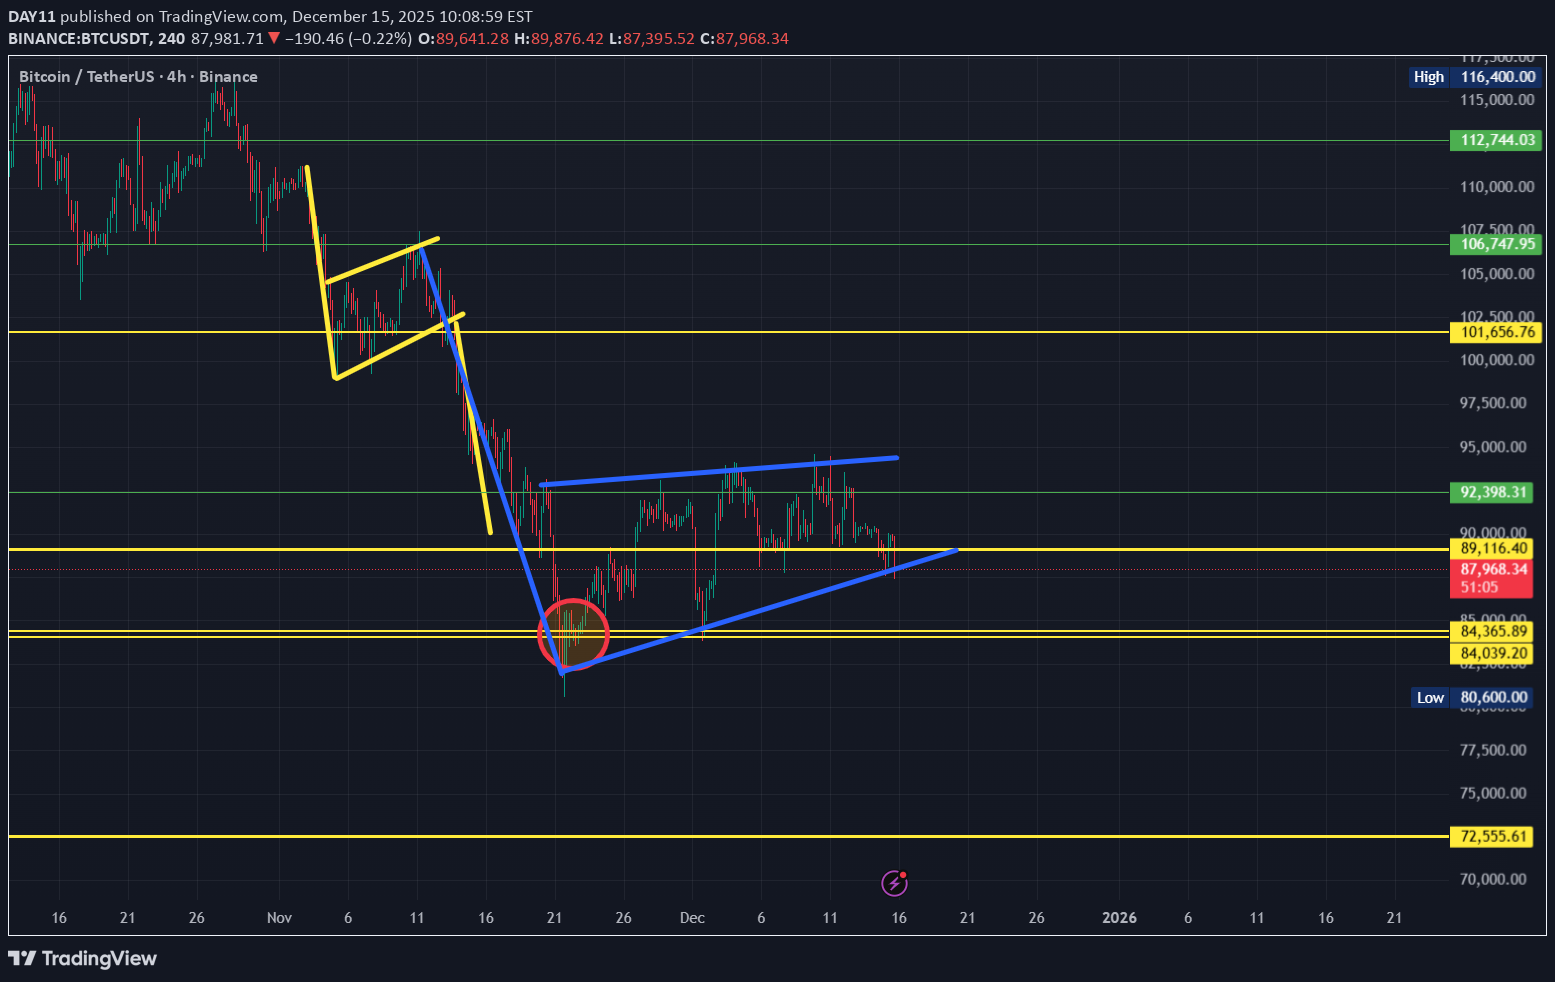
#btc BTC Lets talk about Bitcoin, We have 4h time frame chart, and BTC formed bear flag , BTC is dropping belove 89k which is support. Trade set up - Short- $88k Stop Loss- $91k Take profit 1- $84k Take Profit 2- $72k Confirmation is pending ,,, Bear flag pattern broke out but not yet confirmed . Do Your Own Research < #NFA
DAY11
DAY11
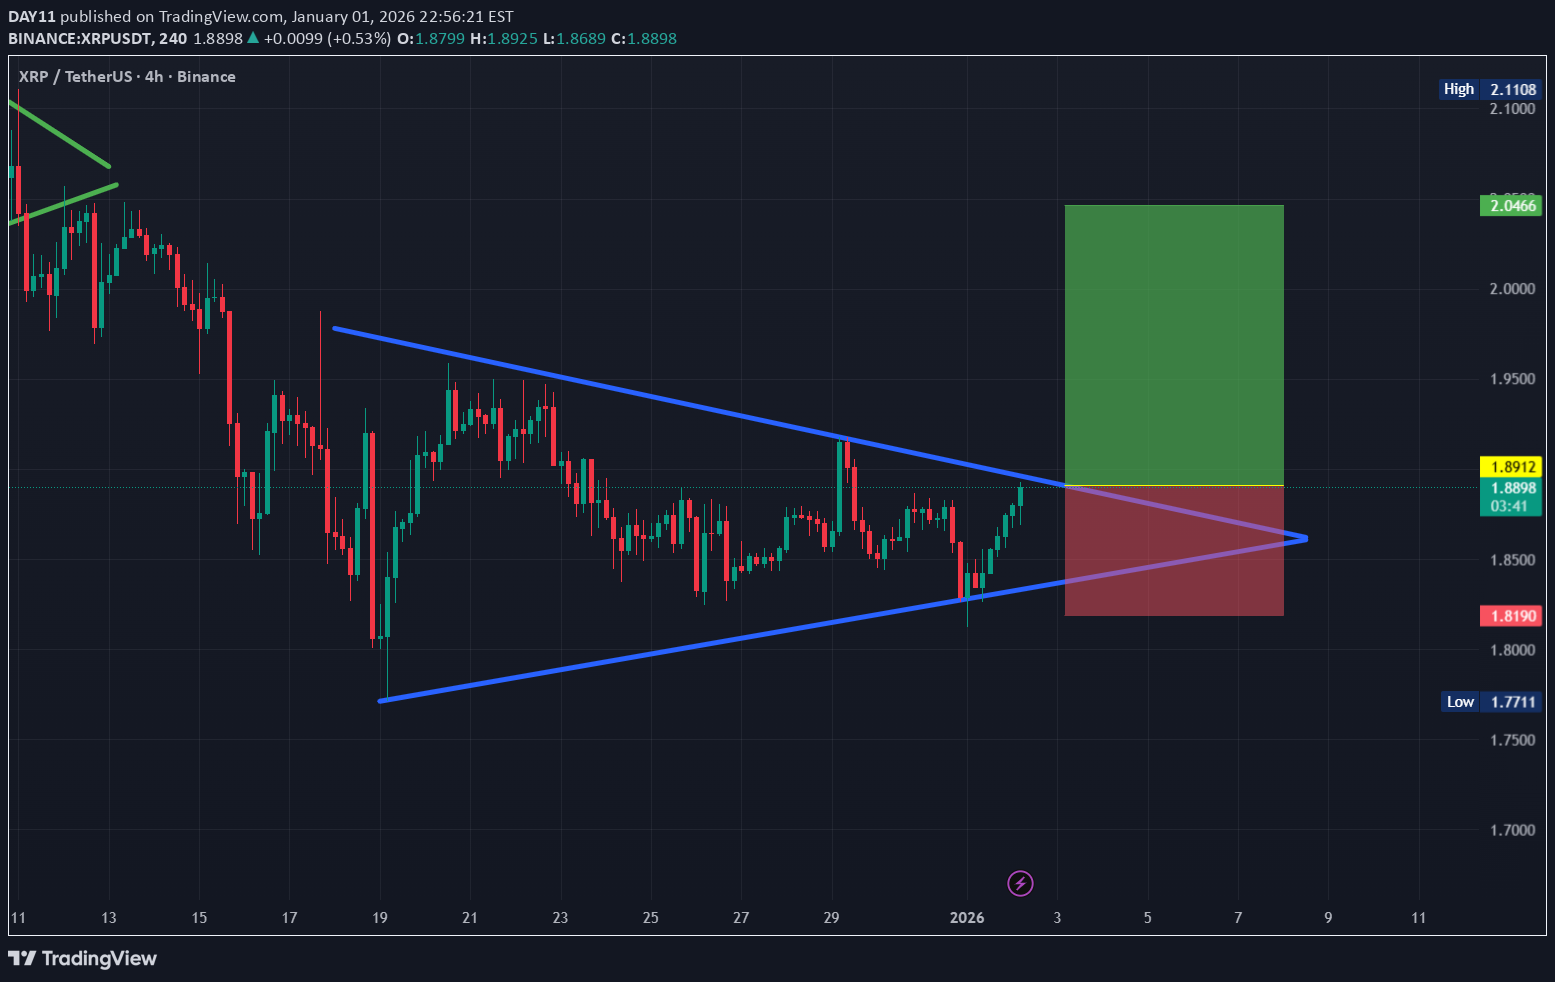
الگوی نزولی XRP: آیا ریزش در راه است یا وقت خرید است؟
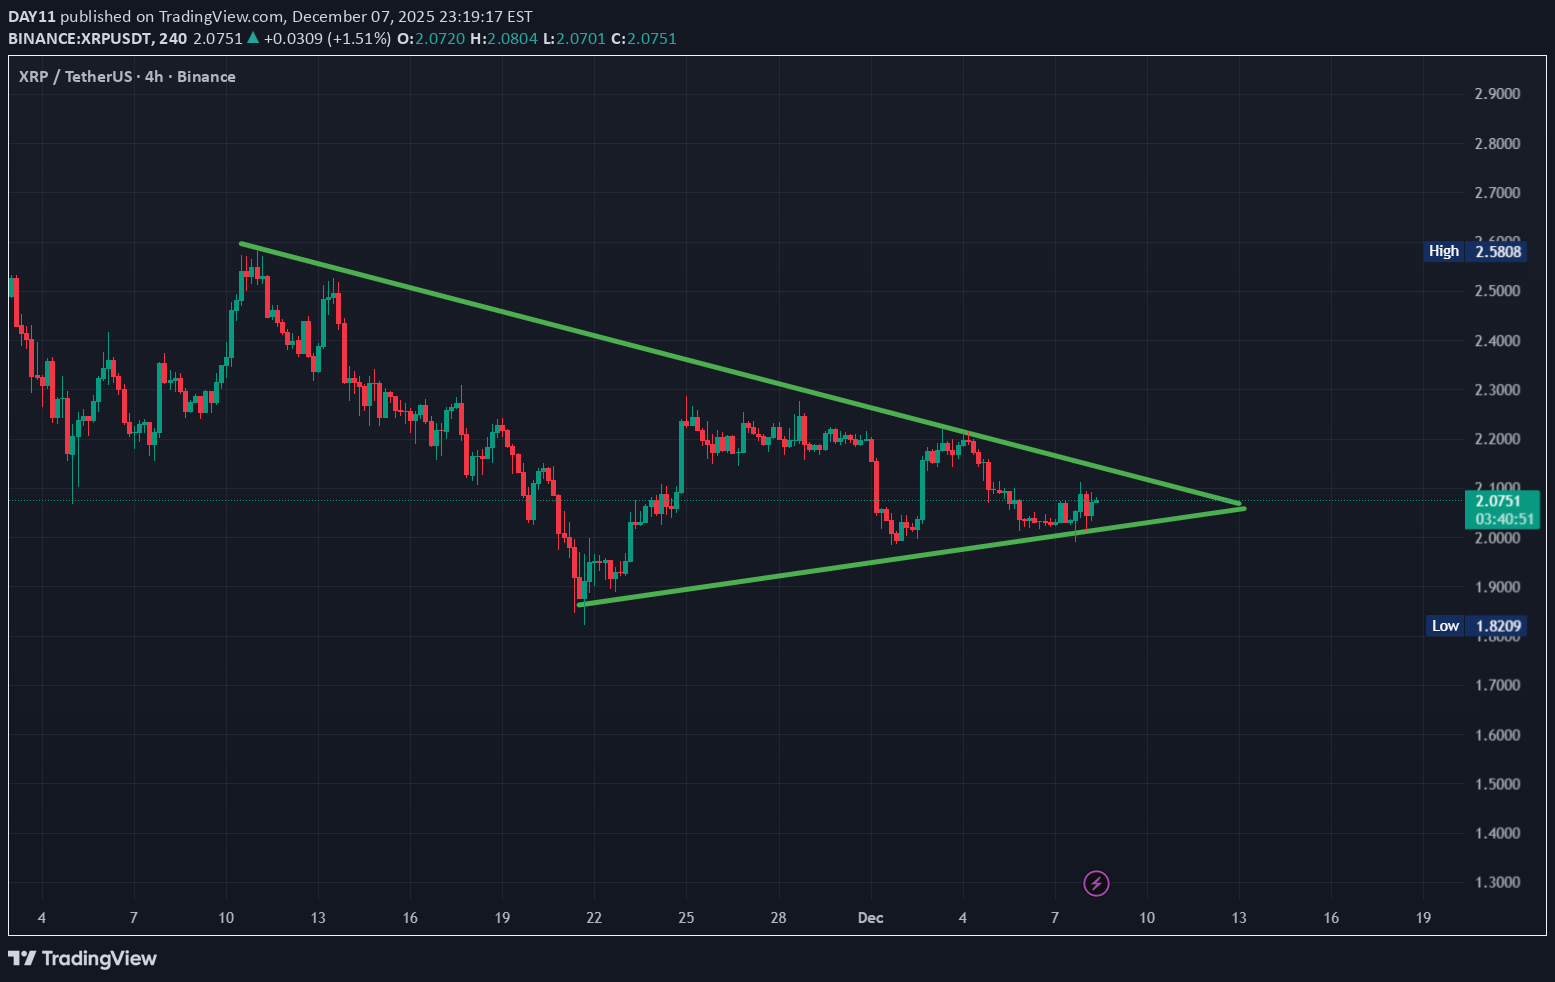
#xrp XRP XRP is framing descending pattern within the 4h time frame . Lets dive into, A downward-sloping upper trendline (the green line connecting the lower highs from around $2.58 down toward ~$2.07). A flat lower support line around $1.82–$1.90 (you can see price has repeatedly bounced from roughly that zone). IS a descending triangle bullish or bearish? Traditionally, a descending triangle is considered a bearish continuation pattern, especially when it appears during a downtrend (which XRP has been in since the high around $2.58). The logic is: Sellers are becoming more aggressive (pushing highs lower). Buyers are defending the same support level. Eventually the support usually breaks, leading to a continuation of the downtrend. Classic technical analysis, the pattern is bearish and suggests a likely breakdown below the horizontal support (~1.82–1.90 area) if it completes. XRP right now (December 2025)Descending triangles can sometimes fail and reverse, especially in crypto where sentiment can flip quickly. IF price instead breaks above the descending upper trendline (currently around 2.07–2.10), the bearish setup would be INVALIDATE and it could turn into a bullish reversal. Right now price is sitting right at $2.07, So this is the decisive moment ,either a breakdown or a breakout is coming soon. (DO YOUR OWN RESEARCH BEFORE TAKING ANY ACTION ) NOT A FINANCIAL ADVISE.
DAY11
الگوی دابل باتم بیت کوین در تایم 4 ساعته: آیا آماده انفجار صعودی است؟
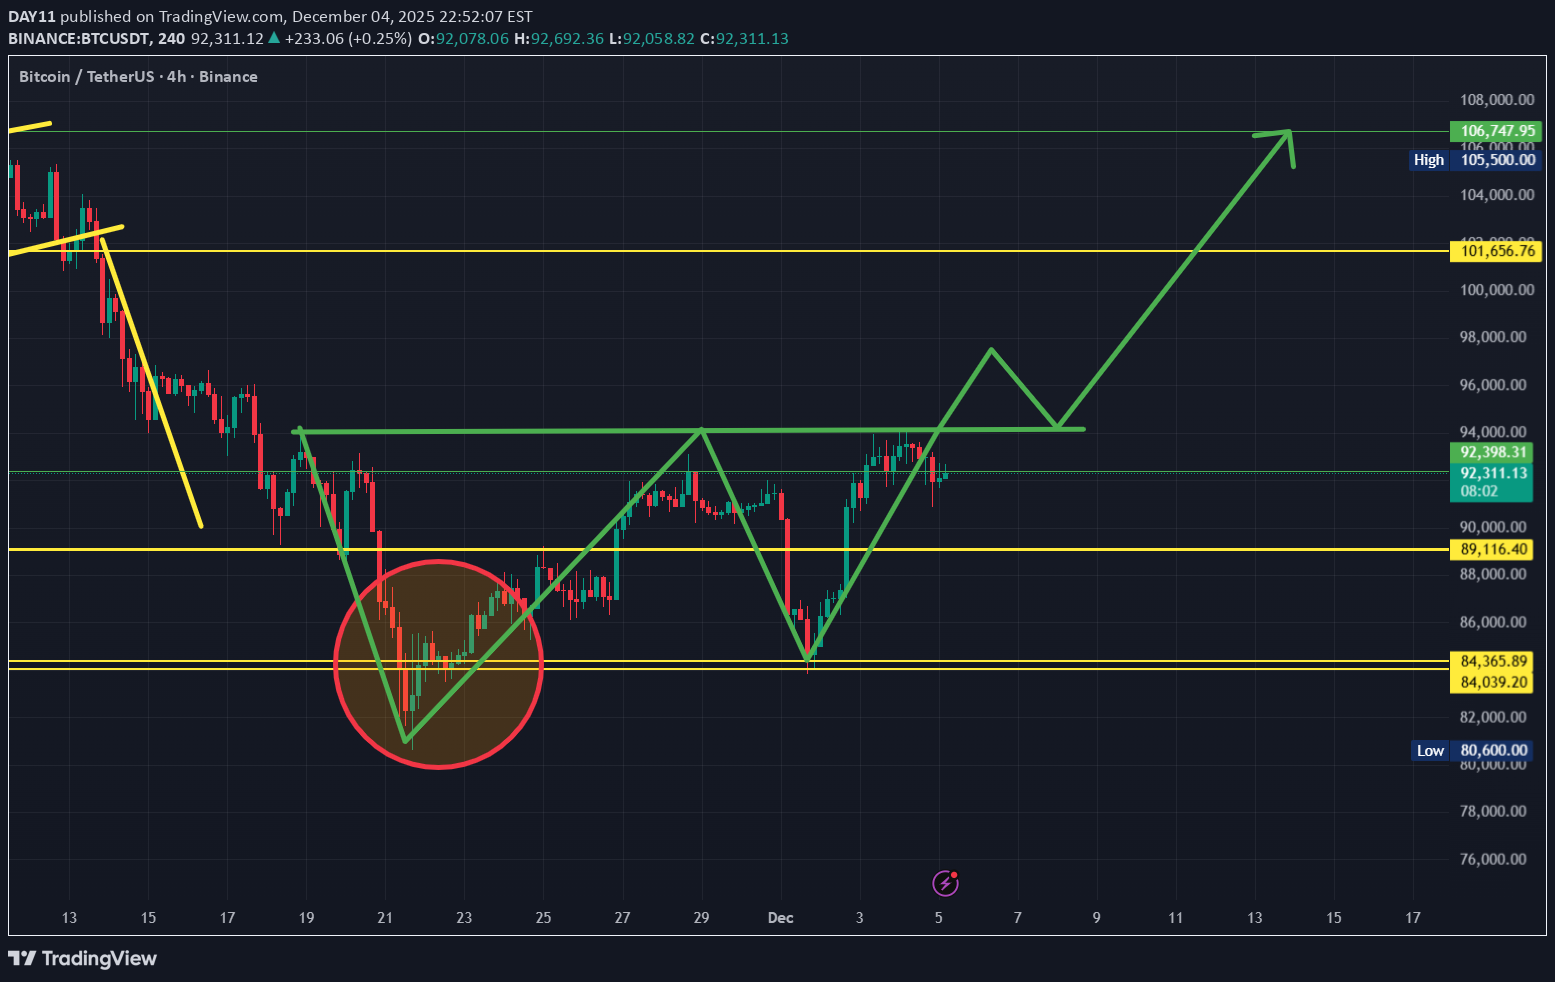
#BITCOIN BTC Exactly mentioned in the title $btcis preparing 'W' pattern or 'Double Bottom' pattern. Here I have 4h chart as per my strategy analysis , Now lets talk about this pattern . This is prediction and I am predicting this chart best of my knowledge, but one thing remember that this pattern is neither complete (break out) nor confirm , Without break out and confirmation don't Long here . If price don't moves in the direction of chart and price moves downside that mean pattern is invalid . The "W" pattern is bullish, signaling a potential reversal from a downtrend to an uptrend. Also called a double bottom, it indicates that sellers have lost momentum and buyers are starting to take control, which may lead to a price increase once the pattern breaks above a resistance level.
Disclaimer
Any content and materials included in Sahmeto's website and official communication channels are a compilation of personal opinions and analyses and are not binding. They do not constitute any recommendation for buying, selling, entering or exiting the stock market and cryptocurrency market. Also, all news and analyses included in the website and channels are merely republished information from official and unofficial domestic and foreign sources, and it is obvious that users of the said content are responsible for following up and ensuring the authenticity and accuracy of the materials. Therefore, while disclaiming responsibility, it is declared that the responsibility for any decision-making, action, and potential profit and loss in the capital market and cryptocurrency market lies with the trader.