Technical analysis by DAY11 about Symbol BTC on 12/31/2025

DAY11
BITCOIN: $103K OR 72K IN 2026
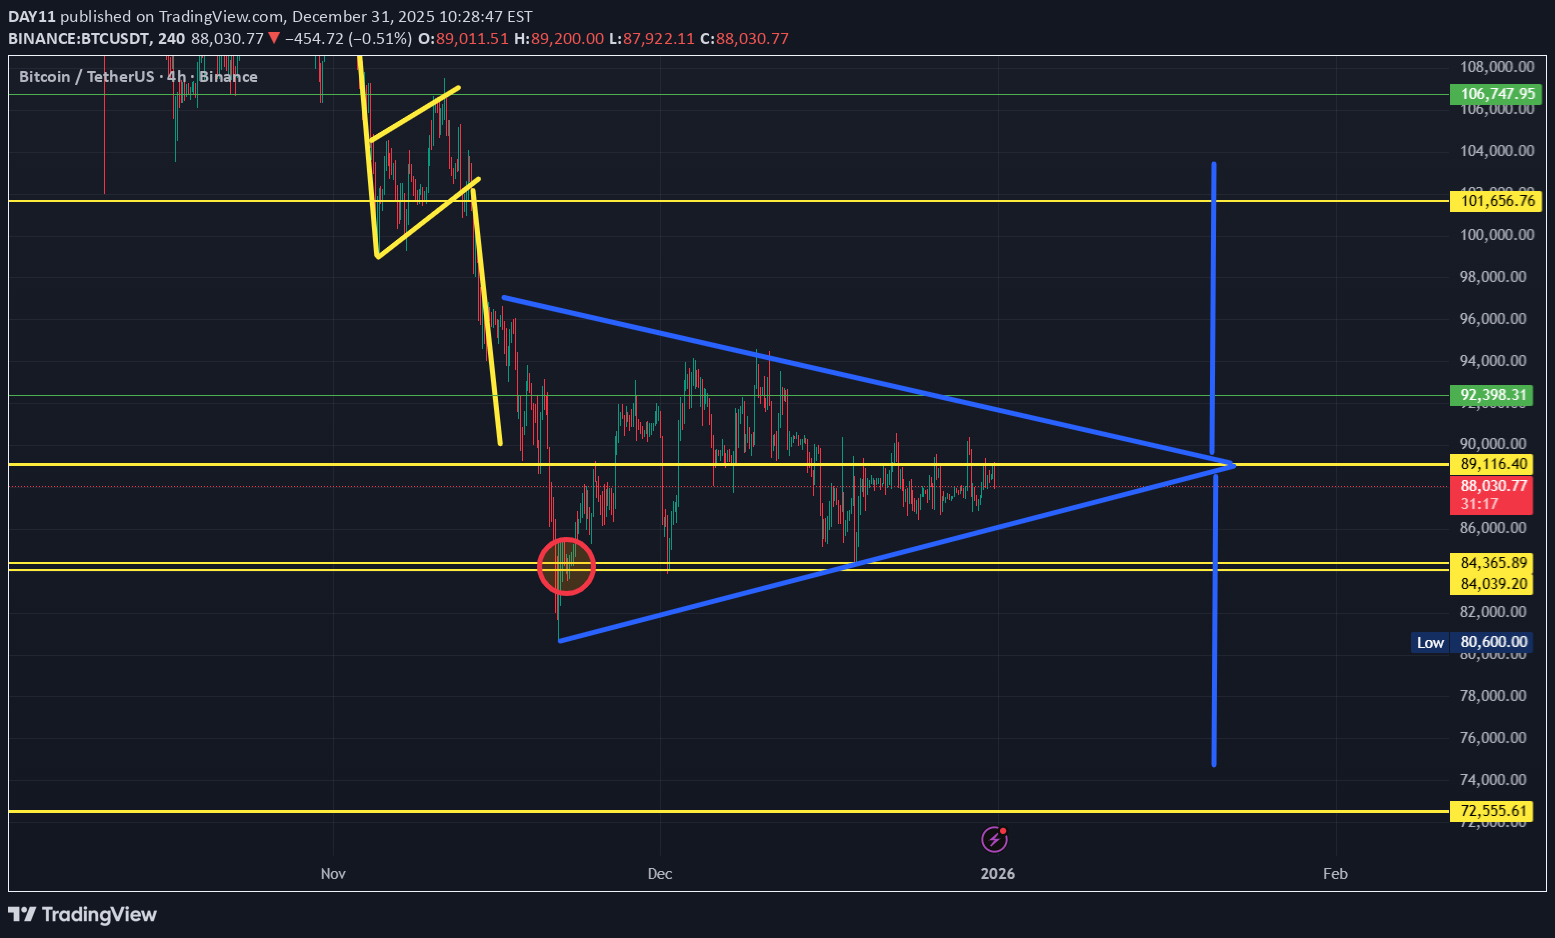
#bitcoin Read Carefully before any act . BTC is forming a SYMETRICAL TRIANGLE pattern ! We have 4h chart for the analysis , lets dive ..... A symmetrical triangle is a neutral chart pattern in technical analysis showing market consolidation, formed by converging trendlines (one is as a resistance, and another is as a support) connecting lower highs and higher lows, indicating indecision before a breakout in the direction of the prior trend . It signals decreasing volatility as buyers and sellers reach in equal state , with traders waiting for a decisive price move above resistance or below support, usually confirmed by increased trading volume, to determine the next trend. Key Characteristics: 1. Trendlines: An upper resistance line (downward sloping) meets a lower support line (upward sloping). 2.Lower Highs & Higher Lows: Price action creates a series of lower highs and higher lows. 3.Continuation Pattern: Often suggests the prior trend will resume after the breakout. How it Works? Formation: The price moves between the lines (Consolidation). Breakout: Wait for the price to the break through either the upper or lower trendline. Volume Confirmation: A real breakout is depend on a significant increase in trading volume. Price Target: Measure the height of the triangle at its widest point and project that distance from the breakout point to estimate the potential price target. Bullish: Breakout above the top line, often continuing an uptrend. Bearish: Breakout below the bottom line, often continuing a downtrend or signaling a reversal. Do Your Own Research , #NFA