
CryptoWhale100Billion
@t_CryptoWhale100Billion

What symbols does the trader recommend buying?
Purchase History
پیام های تریدر
Filter
CryptoWhale100Billion
پامپ بزرگ دوجکوین در راه است؟ هدف جدید: رسیدن به ۰.۳۸ دلار!
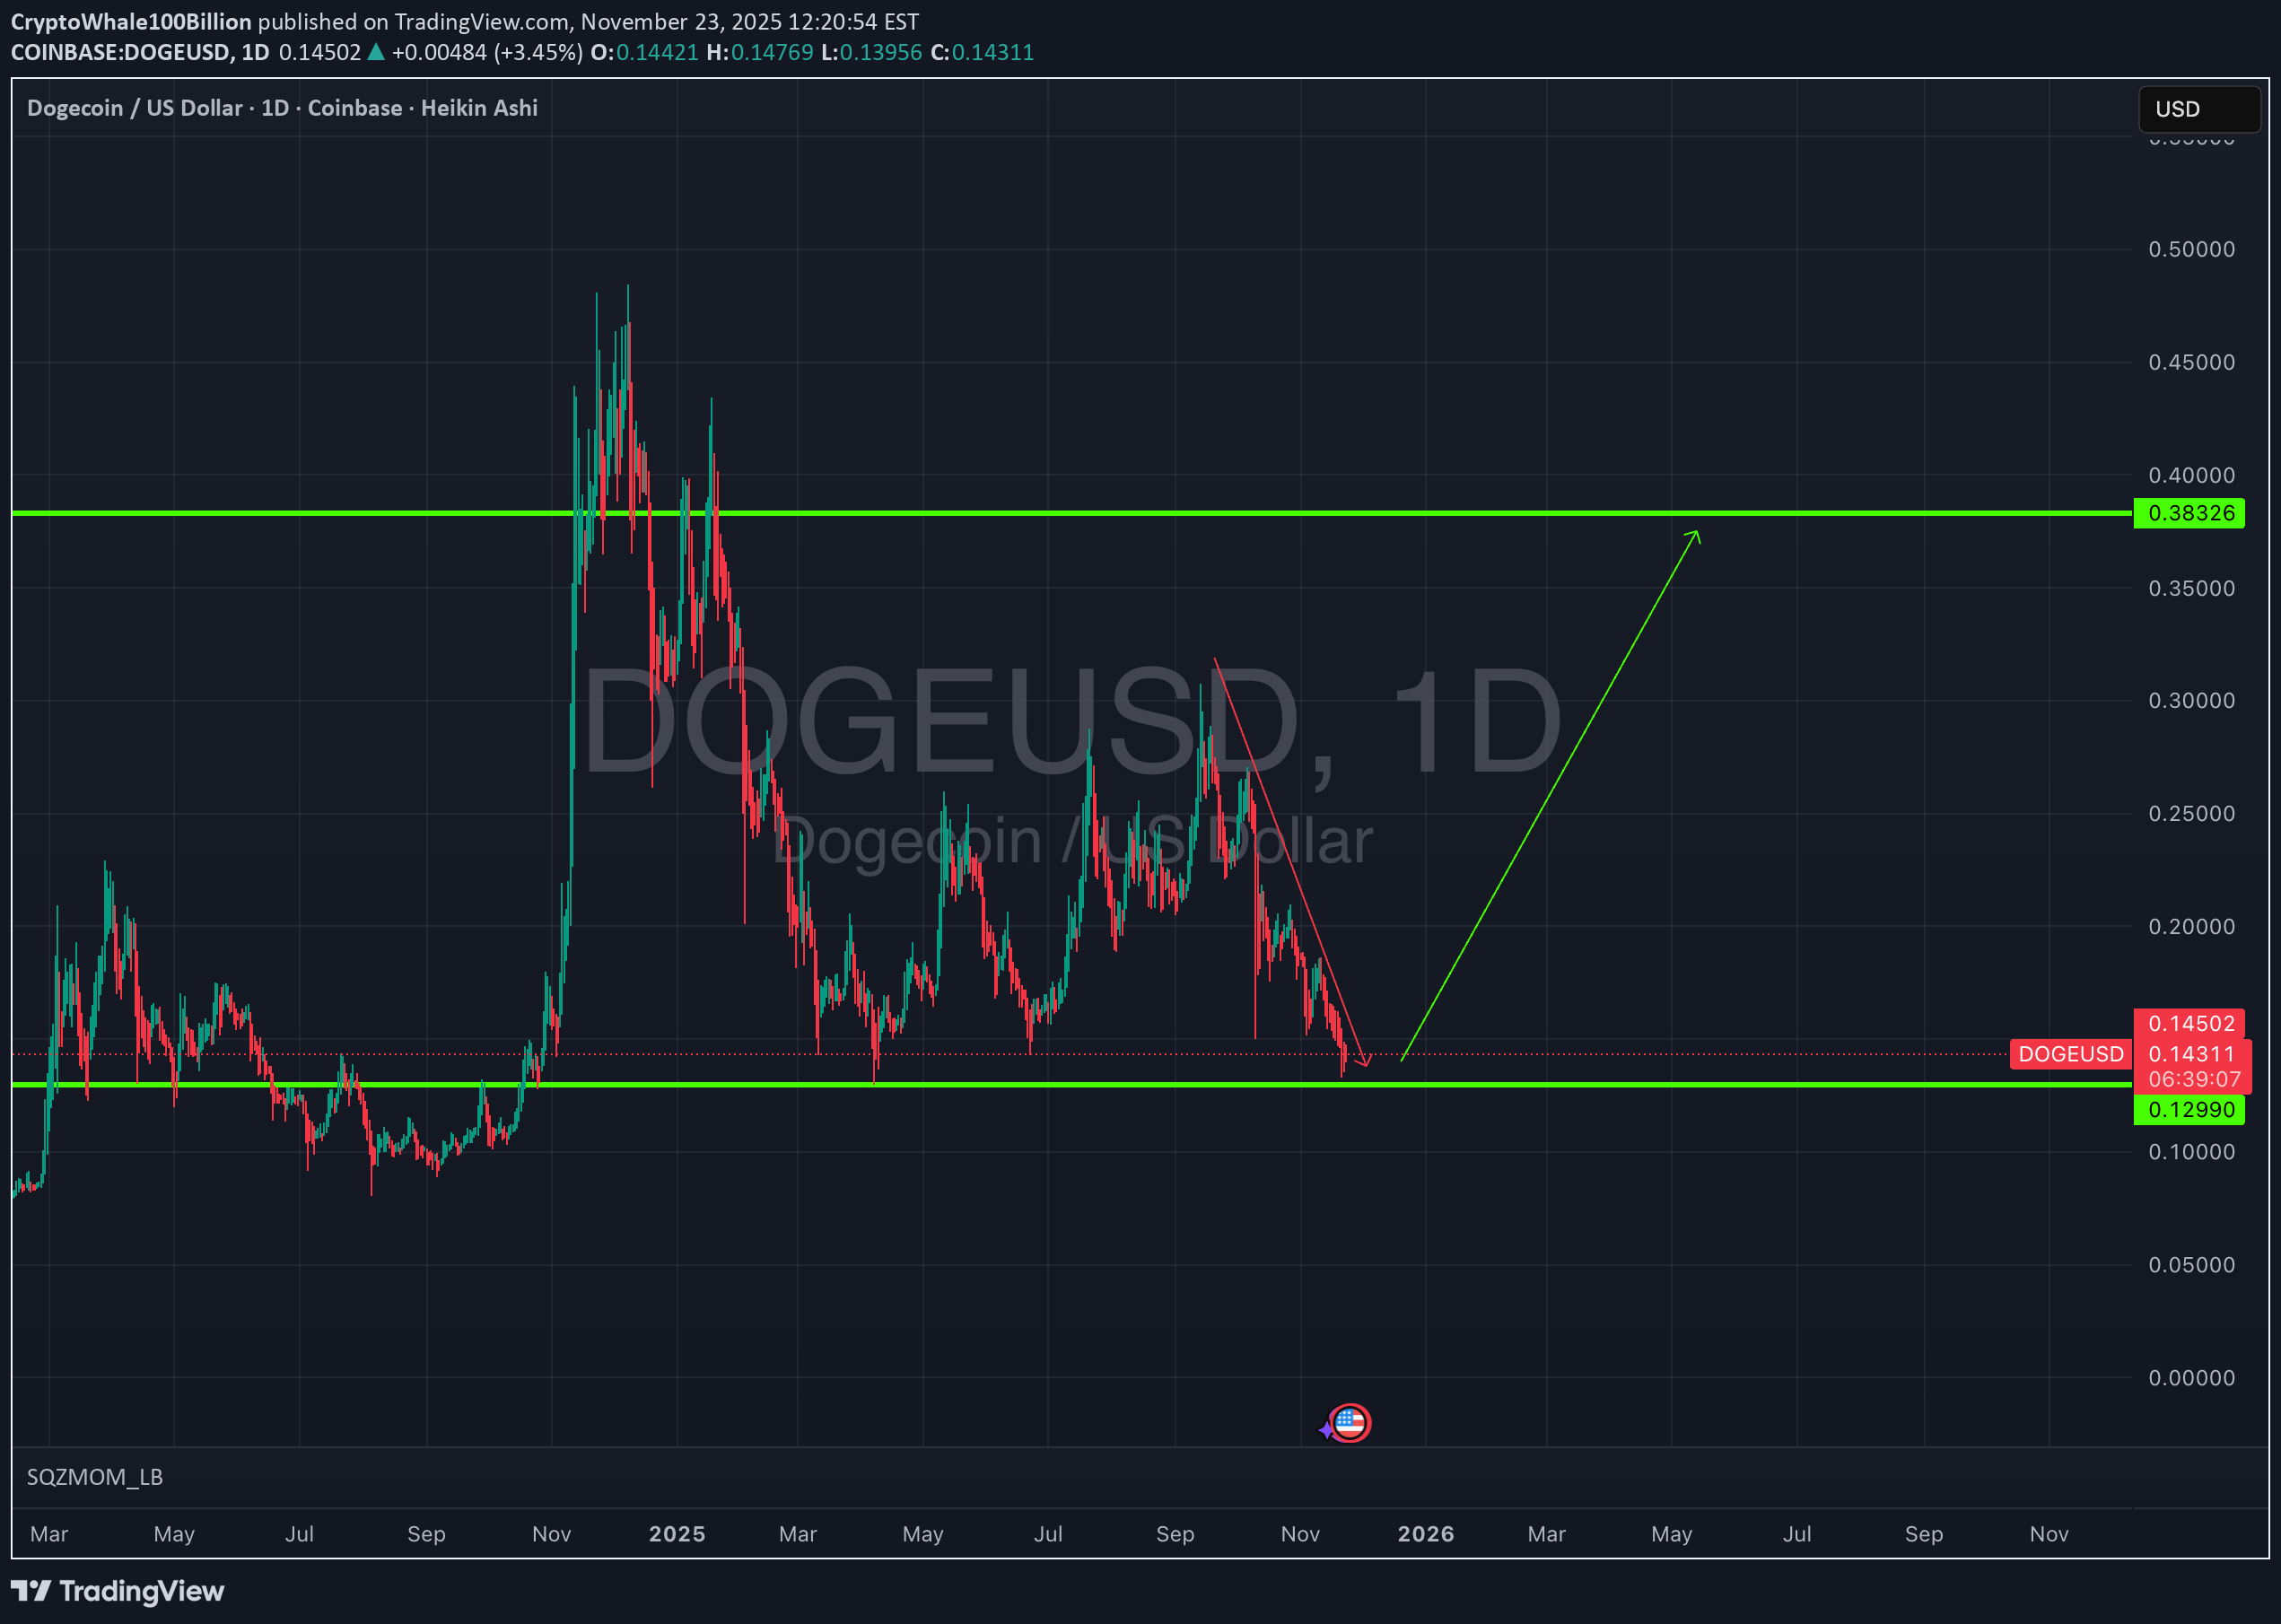
Dogecoin is showing serious signs of life after consolidating around $0.14 for what feels like an eternity. With the broader crypto market stabilizing and meme coins heating up (thanks to that Elon energy lingering in the air), I'm eyeing a classic DOGE pump incoming. Much wow, indeed! Quick TA Breakdown: Price Action: We've just bounced off the 200-day EMA at ~$0.135, flipping it into support. Volume is spiking on the upside, confirming buyers are stepping in. RSI (14): Bouncing from oversold territory at 35, now pushing 55 – room to run without overbought warnings yet. Key Levels: Resistance at $0.16 (50% Fib retrace from the 2021 ATH) is cracking. A clean break above here opens the floodgates to $0.22 (next Fib level), then straight to $0.38. MACD: Bullish crossover confirmed last week – histogram expanding positively. If we hold above $0.14, this could be the spark for a 2.5x leg up. Imagine DOGE flipping SHIB and reminding everyone why it's the OG meme king. To the moon? Nah, to $0.38 first! Trade Plan: Entry: Long above $0.16 (current: ~$0.140) Target: $0.38 (take partials at $0.22 & $0.30) Stop Loss: Tight below $0.135 (risk ~3-4%) R:R: 1:8 potential – juicy! What do you think, shibes? Loading up or waiting for confirmation? Drop your thoughts below, and let's ride this wave together. DYOR, NFA! #Dogecoin #DOGE #Crypto #MemeCoins #Bullish
CryptoWhale100Billion
آیا اتریوم به 6100 دلار میرسد؟ تحلیل مسیر صعودی ETH از 1780 دلار!
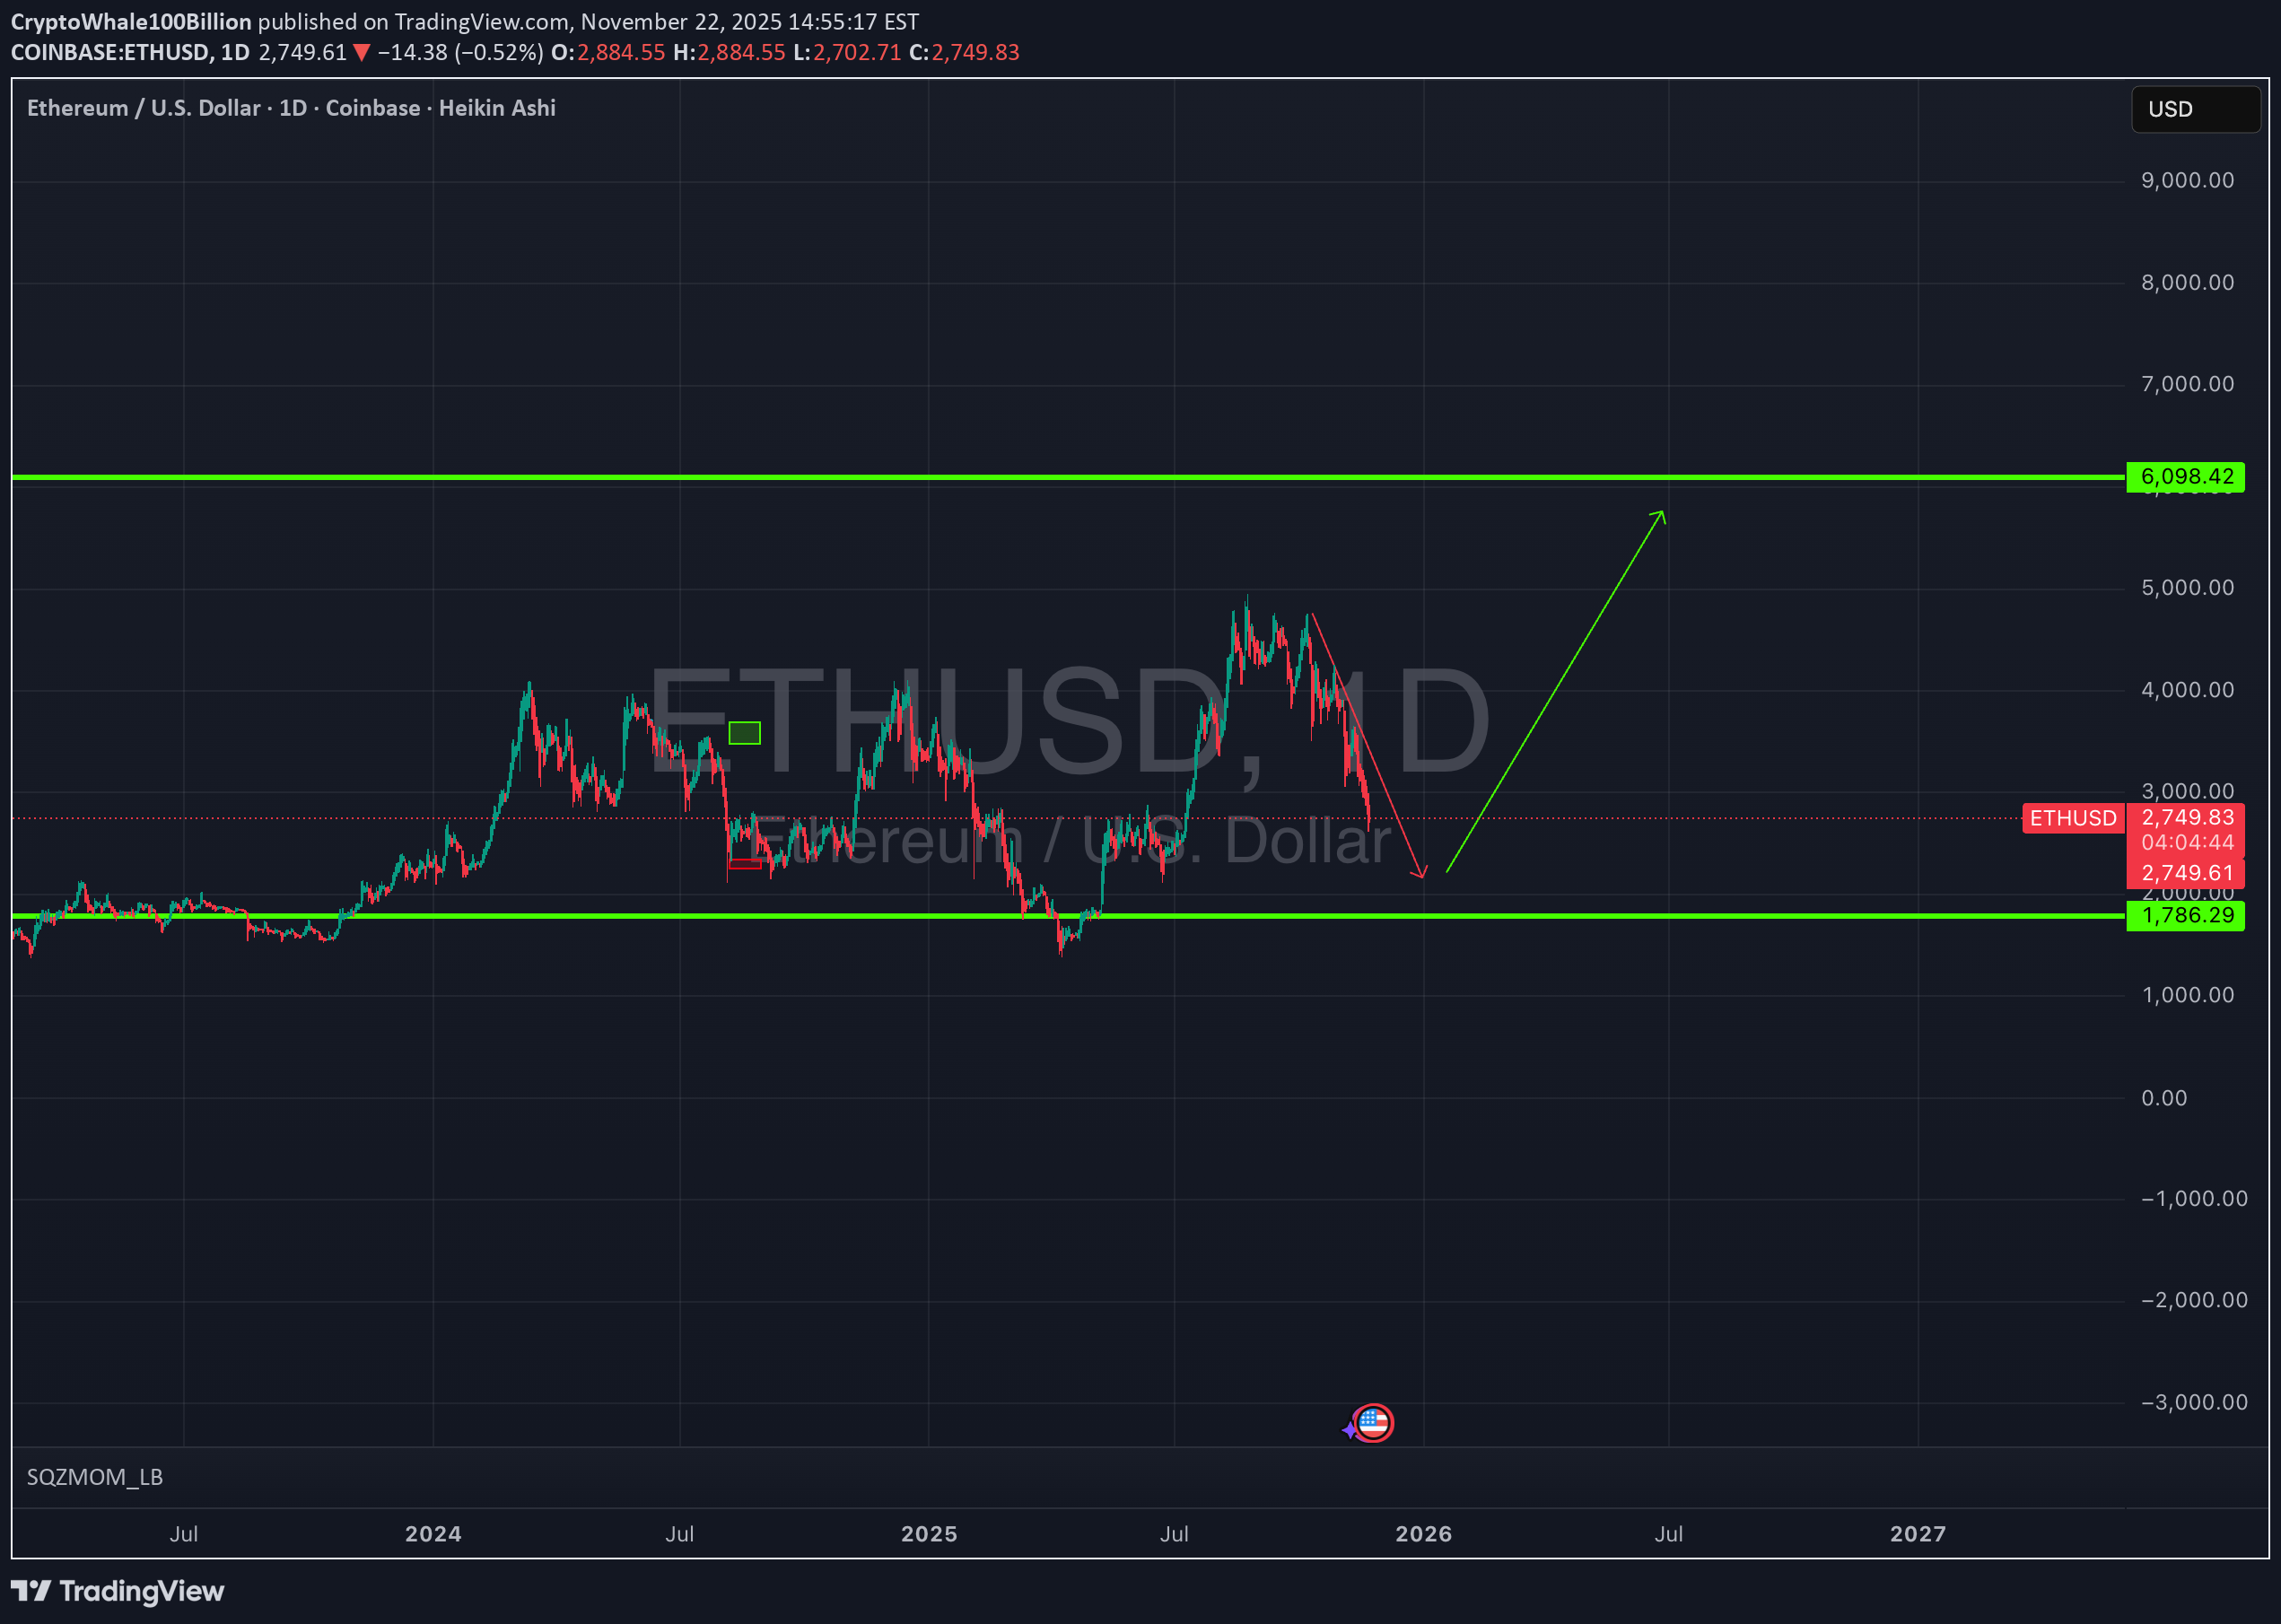
Hey traders and crypto fam! If you're grinding TradingView charts like me, you've probably eyed Ethereum's wild ride. Right now, ETH is hovering around $2,700 (as of Nov 22, 2025), but let's talk that dip you're mentioning—back to $1,780? That sounds like a throwback to those brutal 2022 lows or a potential retest if macro headwinds (think Fed hikes or BTC dominance spikes) hit hard. But here's the bullish thesis that's got me stacking: In this bull cycle, ETH ain't just recovering—it's primed to moon to $6,100+ by mid-2026. Why? Ethereum's ecosystem is firing on all cylinders: ETF inflows are pouring in, Layer-2 scaling (thanks to Dencun and Prague upgrades) is slashing fees, and DeFi TVL is exploding past $200B. Plus, restaking protocols like EigenLayer are locking up supply like never before. If BTC hits $150K Risks? Yeah, crypto's volatile AF. If BTC dumps below $80K or regs tighten (SEC eyeing staking?), we could wick back to $1,780. But with 42% of experts saying "buy now" and ETF flows at record highs, the risk/reward screams LONG ETH. What do you think—$6,100 too conservative, or am I dreaming? Drop your takes below, smash that follow button for daily updates, and let's turn this prediction into profits. To the moon! #ETH #CryptoBull #TradingView
CryptoWhale100Billion
بیت کوین به کجا میریزد؟ پولبک به ۷۸ هزار دلار و صعود تا ۱۴۳ هزار!
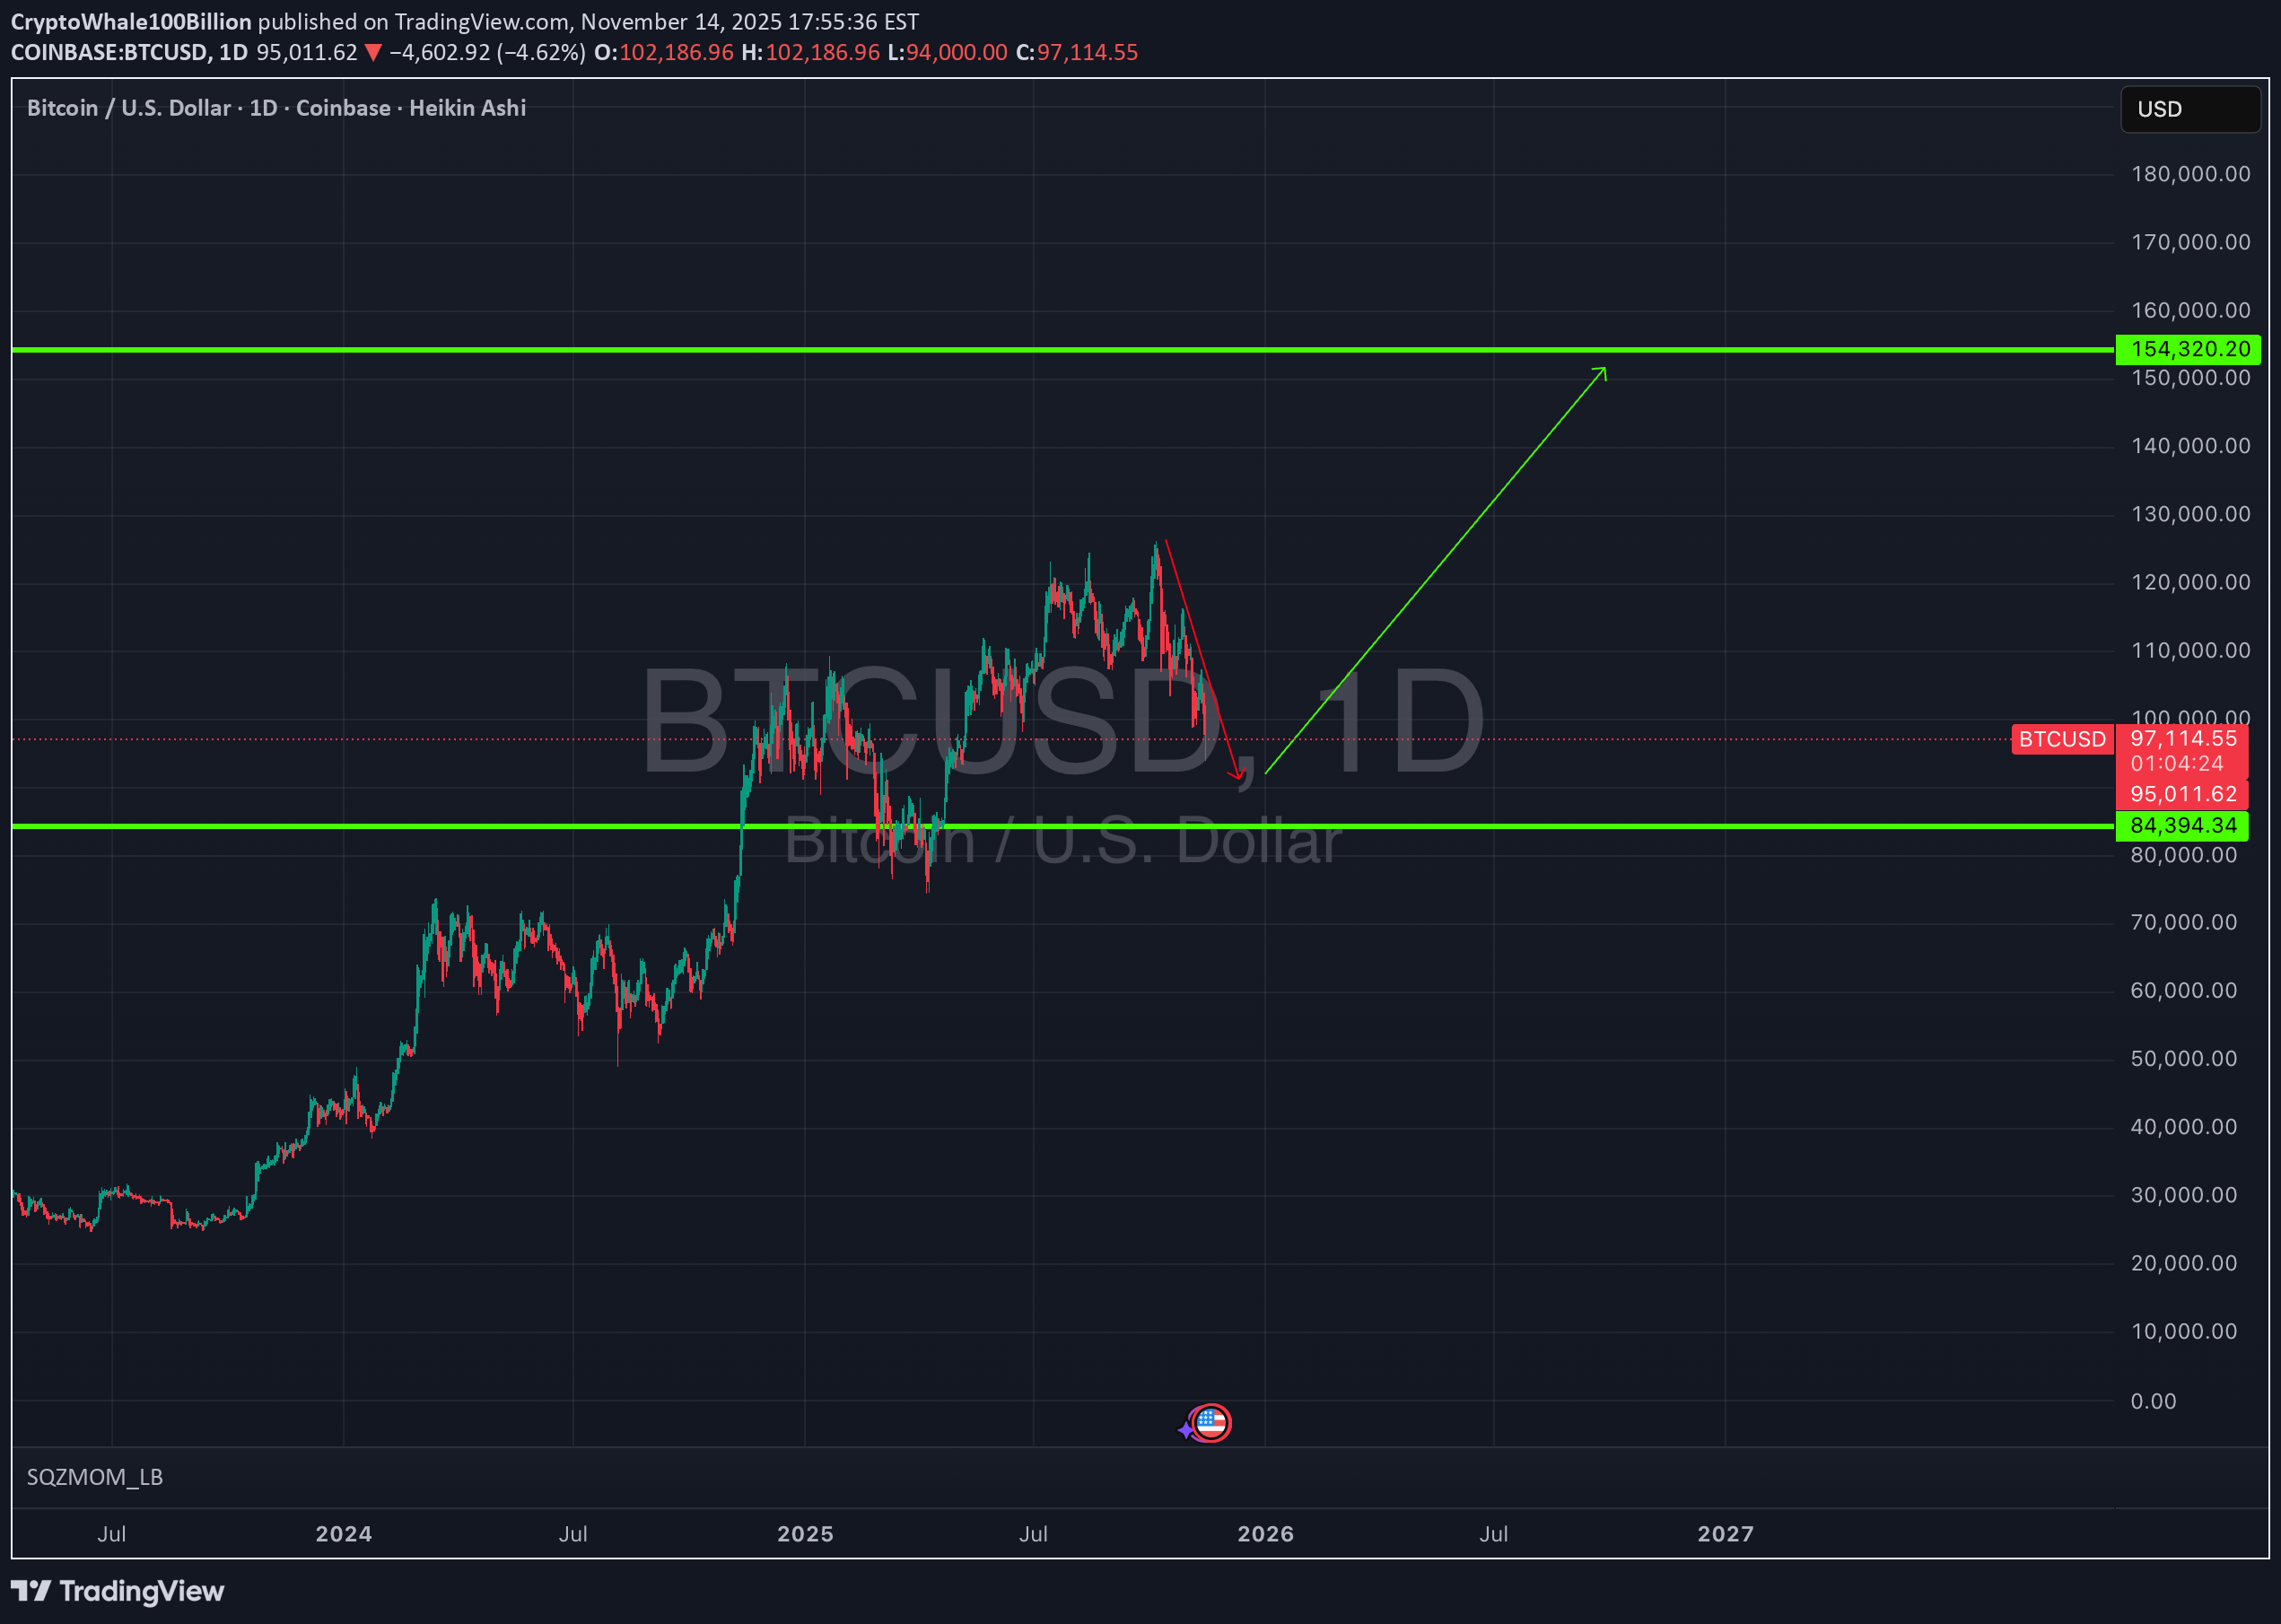
Hey traders, Bitcoin's been on a tear, grinding past 95K today amid AI-fueled risk-on vibes and ETF inflows hitting record highs. But let's not get FOMO-blind—overbought signals are flashing, and a healthy retrace could set the stage for the next leg up. Here's my take: expect a dip to the 78-84K support cluster for a quick shakeout, followed by a bullish bounce targeting 143-153K by Q1 2026. This isn't a bear trap; it's fuel for the moonshot. Quick Setup (Daily/ Chart)Current Price: ~95,200 Key Driver: $1.2B in spot ETF buys last week, but whale profit-taking (e.g., 10K+ BTC dumps on-chain) screams "pause before blast-off." Broader macro: Fed's dovish tilt keeps the floor high. The Dip: Why 78-84K?A classic ABC correction in this bull channel. We're likely in wave 4 of the grand Elliott impulse from the 2024 lows. Support confluence:78K: 0.618 Fib retrace from Oct ATH (92K) to recent low (68K); aligns with 200-day EMA (~77.5K). 84K: Psychological pivot + 50% Fib level; prior swing low from early Nov. If we breach 84K hard? Invalidates—watch for 70K retest (unlikely, <20% prob). Volume profile shows thin selling there—perfect for absorption. The Bounce: Bullish to 143-153KOnce we hold 78-84K, flip to longs. Expect a V-shaped reversal on capitulation volume, breaking the descending trendline from the mini-top at 98K.143K Target: 1.618 Fib extension of the dip wave; matches channel projection. 153K Upside: Measured move from 95K high—add 61.8% of the pullback range. Catalysts: Holiday liquidity + potential Canary MOG ETF approval spillover (meme risk-on). Altcoin rotation could amplify.
CryptoWhale100Billion
MOG replacing Other MEME???
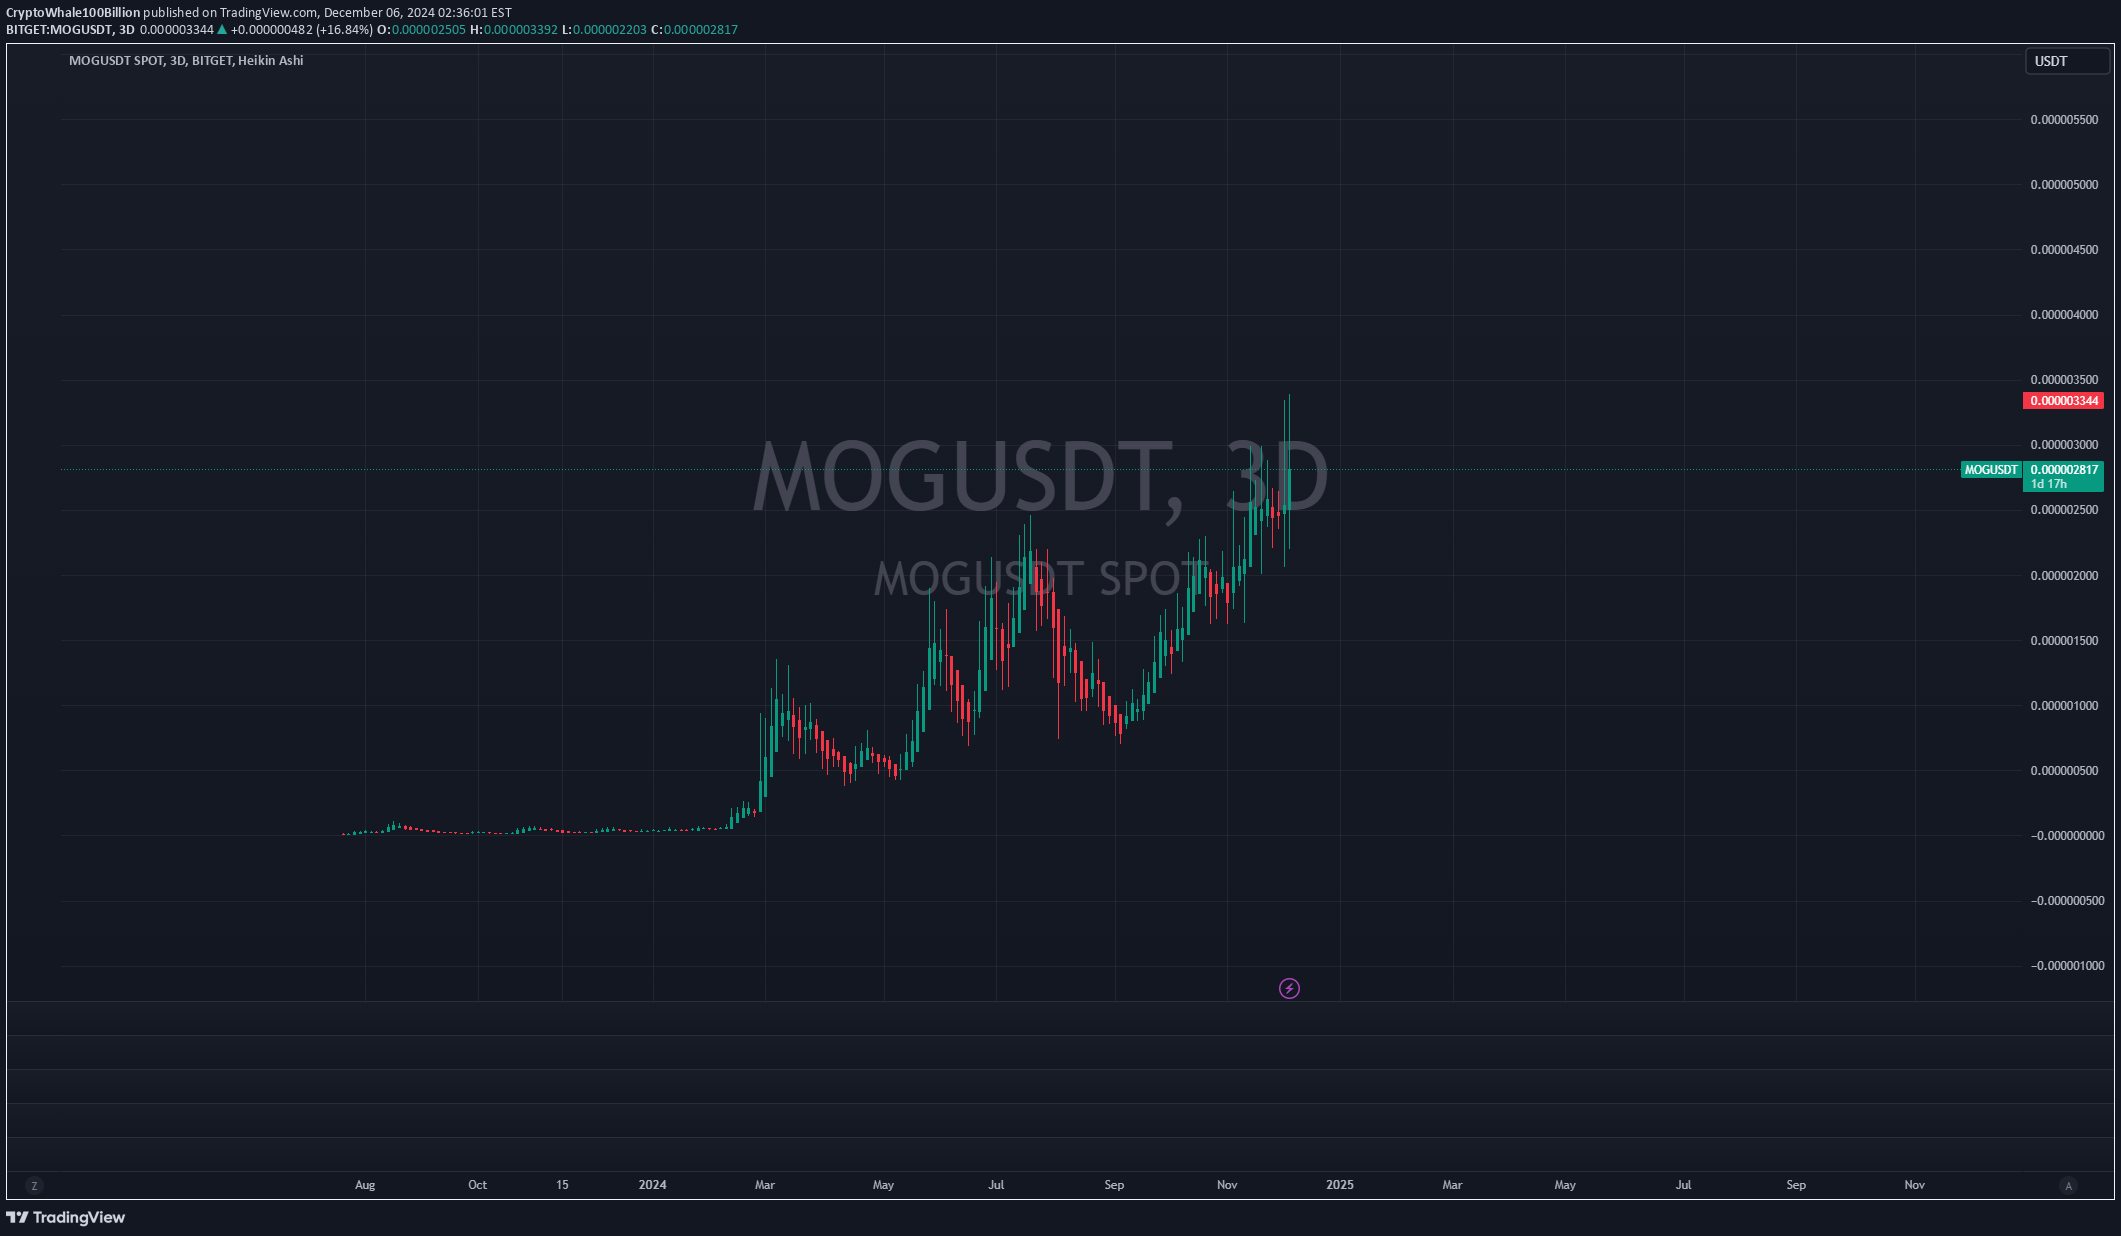
Here comes another insane Meme MOG! Where is this headed? 166x? Remove 2 zeros comment below what your prediction is.
CryptoWhale100Billion

CryptoWhale100Billion
BLZ Another bullish chart

BLZ looking for a 2x run. Simple indicators and moving average. Post below what your price target would be.
CryptoWhale100Billion
Bullish move on Auction

Another potential run for Auction is about to get cooking.
CryptoWhale100Billion

CryptoWhale100Billion
RAD potential coming

Bullish Signs for breaking out and beginning to head to the upside. Watch the $2 zone.
CryptoWhale100Billion
ETH Drama Alert!

So, what the heck happened with Ethereum yesterday? One minute we're riding high, and the next, it's like ETH decided to take a spontaneous bungee jump without the cord! 🎢 Picture this: ETH was chilling at a respectable $3,883, probably sipping on some digital mojitos, when suddenly, it remembered it had an appointment with gravity. Fast forward a few hours, and we're staring at $2,100, wondering if ETH just had a mid-life crisis. 😱 Was it the market? Was it the moon? Did someone forget to feed their crypto hamster? Who knows! But one thing's for sure, ETH gave us all a heart attack and a half. 💔 But hey, let's look on the bright side. At least now we have a great story to tell at the next crypto party. "Remember that time ETH decided to play 'How Low Can You Go'?" 😂 Bearish Scenario: ETH decided to take a nosedive below $2,200. It's like ETH saw a ghost and just ran for the hills! 👻💨 If it keeps this up, we might need to start a search party. 🕵️♂️ Bullish Scenario: On the flip side, if ETH can muster up the courage to break above $3,400, we might just see it soaring like an eagle! 🦅✨ It's like ETH is trying to win a high jump competition. 🏆 So, will ETH continue its spooky descent, or will it rise like a phoenix? 🔥 Only time will tell, but one thing's for sure – it's never a dull moment in the crypto world! 🌍💸 Stay strong, This rollercoaster isn't over yet. 🎢💪And ReachedEth breaks above $3,400 again!
Disclaimer
Any content and materials included in Sahmeto's website and official communication channels are a compilation of personal opinions and analyses and are not binding. They do not constitute any recommendation for buying, selling, entering or exiting the stock market and cryptocurrency market. Also, all news and analyses included in the website and channels are merely republished information from official and unofficial domestic and foreign sources, and it is obvious that users of the said content are responsible for following up and ensuring the authenticity and accuracy of the materials. Therefore, while disclaiming responsibility, it is declared that the responsibility for any decision-making, action, and potential profit and loss in the capital market and cryptocurrency market lies with the trader.