
YFI
یرن فایننس
| تریدر | نوع سیگنال | حد سود/ضرر | زمان انتشار | مشاهده پیام |
|---|---|---|---|---|
نتیجه ای یافت نشد. | ||||
نمودار قیمت یرن فایننس
سود ۳ ماهه :
سیگنالهای یرن فایننس
فیلتر
مرتب سازی پیام براساس
نوع پیام
نوع تریدر
فیلتر زمان

iMoneyTeam
YFI Buy/Long Setup (4H)

با توجه به اینکه ما یک 3 بعدی در پایین داریم و قیمت یک CH صعودی تشکیل داده است، در بازگشت به منطقه ارزان موج قبلی، میتوانیم به دنبال موقعیتهای خرید/لنگ باشیم. ما دو نقطه ورودی داریم که این نقاط را با استفاده از DCA وارد کنید. اهداف نیز در نمودار مشخص شده اند. بدون مدیریت سرمایه وارد موقعیت نشوید و تنظیم را متوقف کنید اگر سوالی دارید کامنت کنید متشکرم پس از رسیدن به منطقه ورودی، 6 درصد پمپاژ کرد و قیمت به اولین هدف رسید

noam_chom
ییرن فایننس (YFI) در برابر زدکش (ZEC): آیا تب دیفای داغتر میشود؟
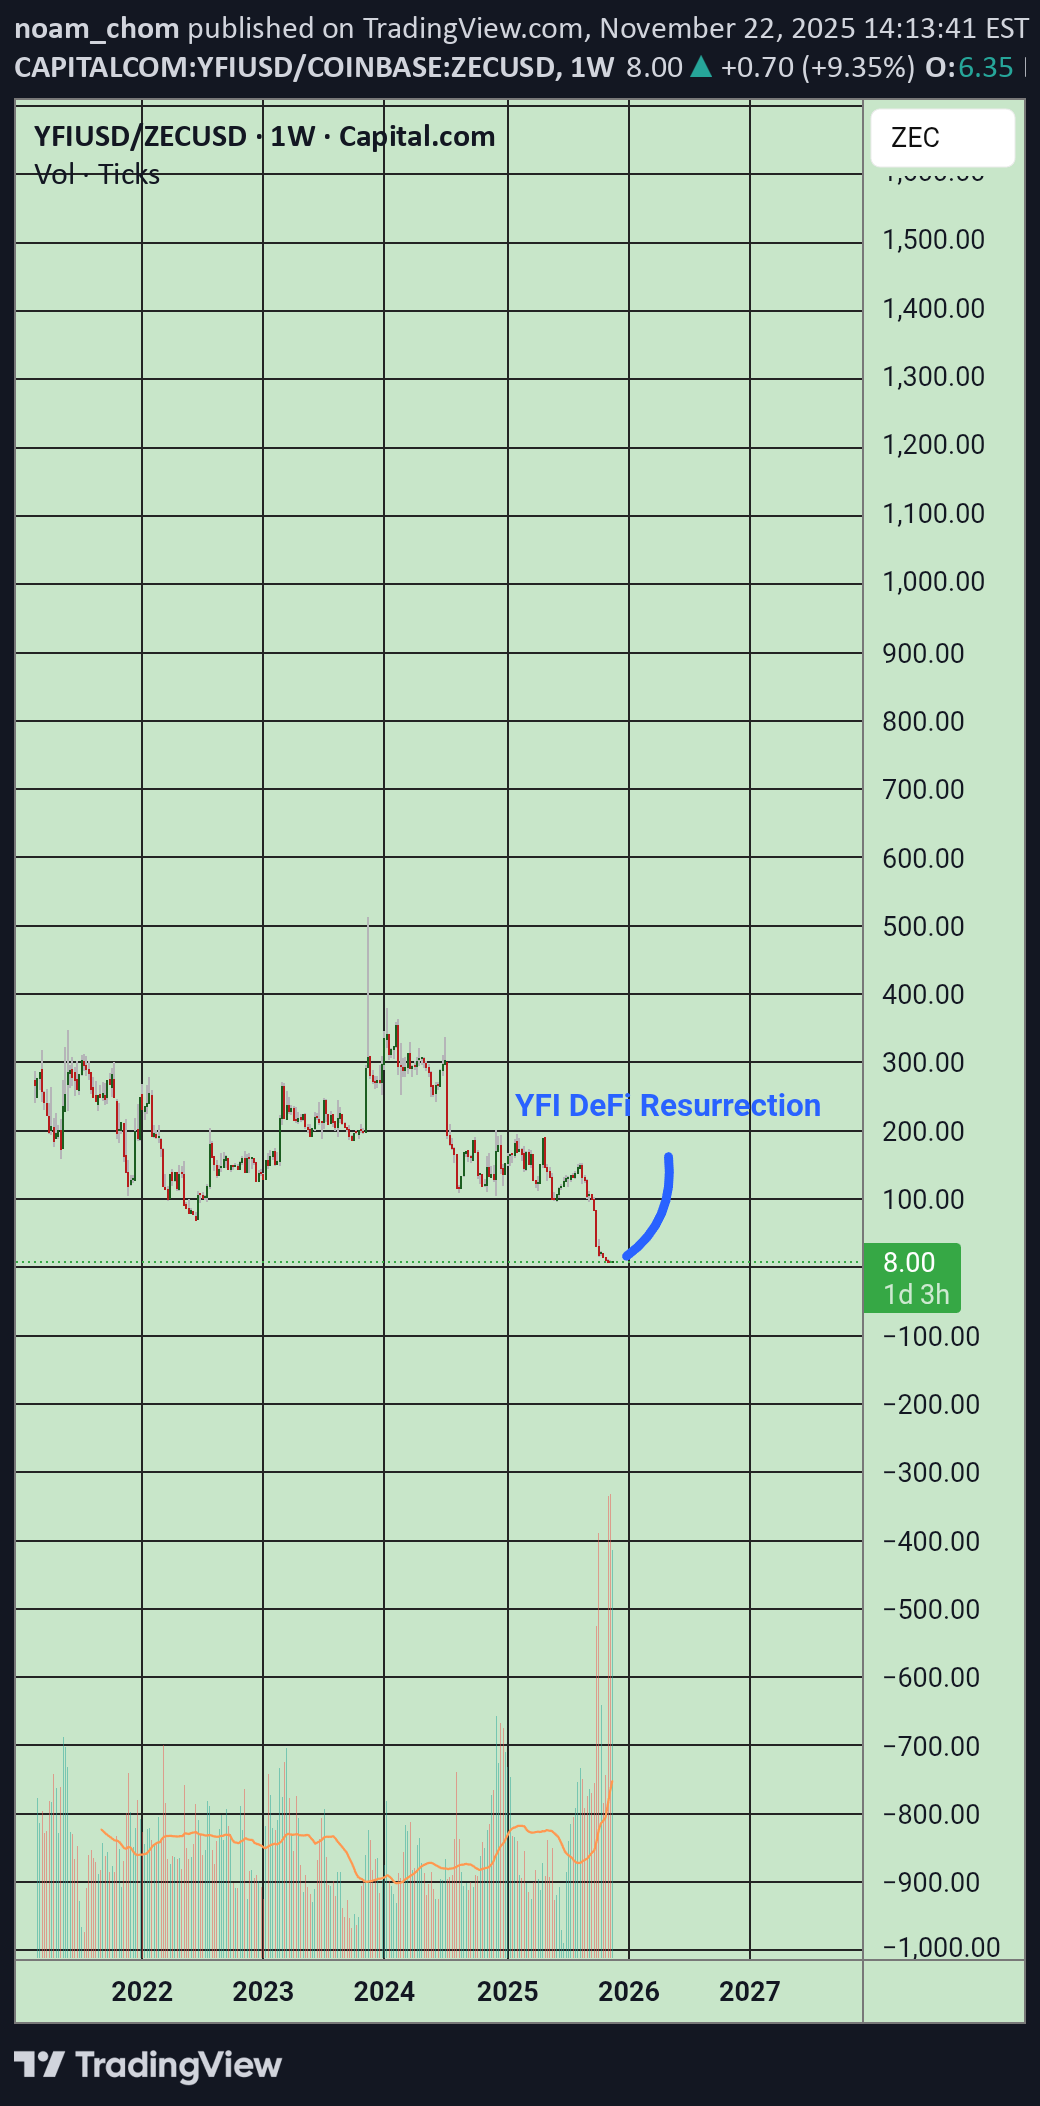
تبِ حریم خصوصی فروکش کرد، تبِ دیفای (مالی غیرمتمرکز) داغ شد. یِرن فایننس یک دارایی ممتاز (بلو چیپ) است.

BeerdHead
هیولای بازدهی دیفای اتریوم: راز رالی بزرگ YFI از کف قیمتی!
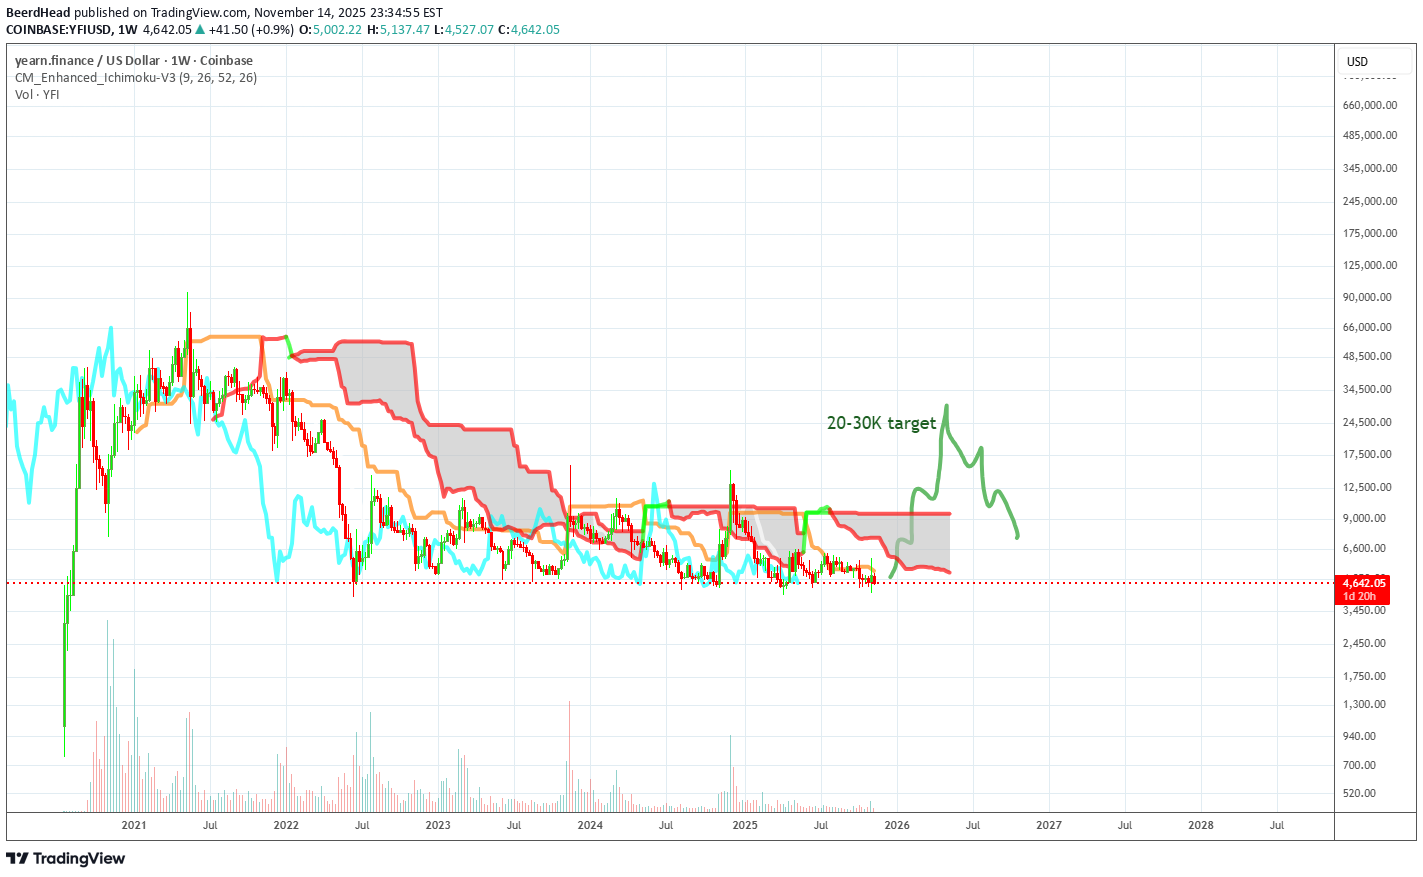
این مورد، مانند بسیاری از توکنهای ممتاز (blue chips) دیفایِ سال ۲۰۲۰، میتواند از این کفهای قیمتی یک رالی بزرگ را رقم بزند.
BeerdHead
ییلد فایننس (YFI): غول نهفته اتریوم؛ آیا زمان بازگشت فرارسیده است؟
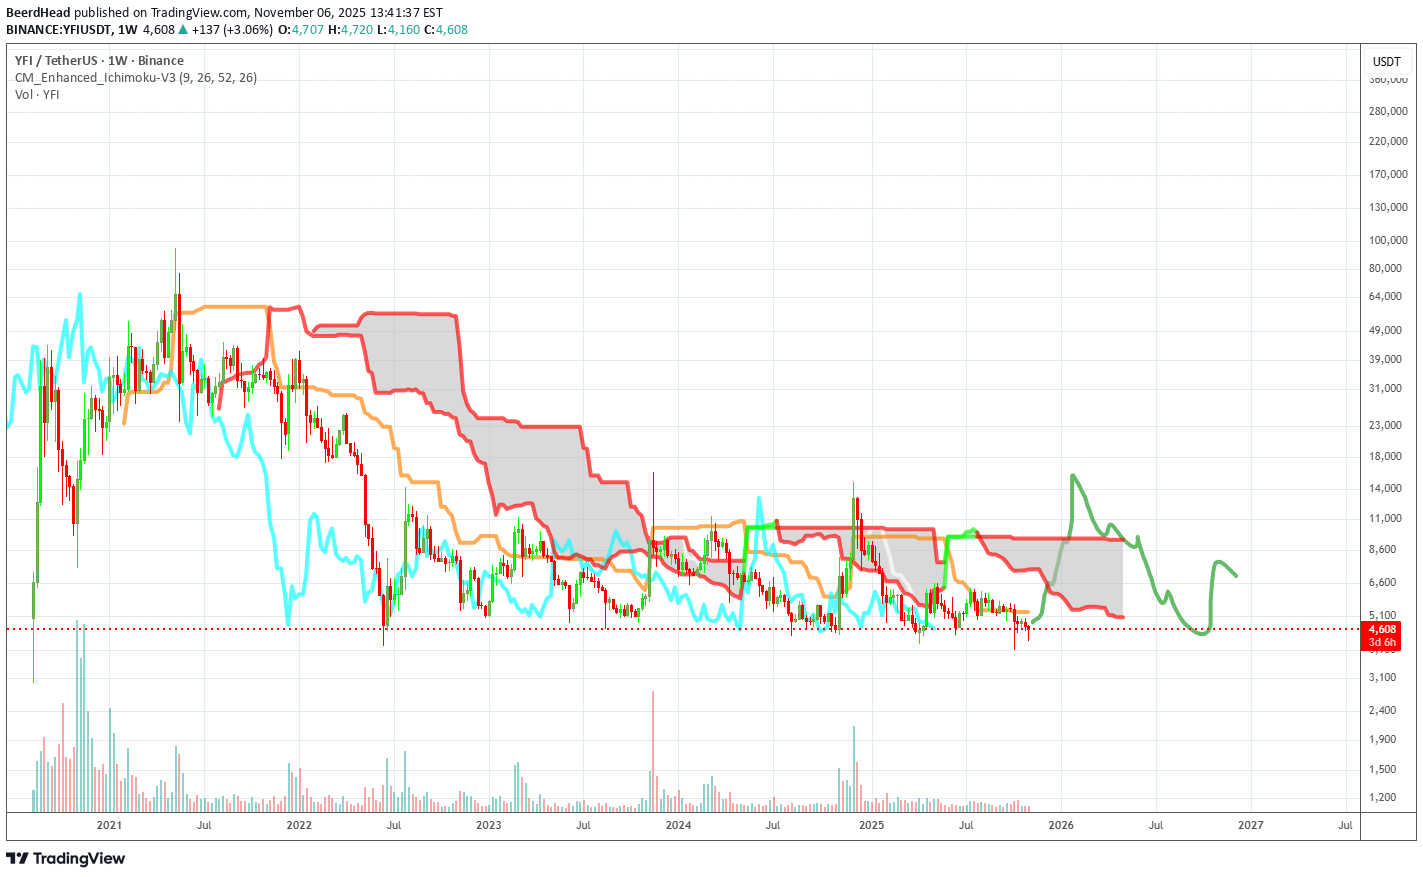
توکن کمیاب، TVL در مقابل ارزش بازار خوب به نظر می رسد جامد meme که بسیاری از سال 2021 memoryyfistory.org/thebluepil را داشت

CryptoAnalystSignal
پیشبینی انفجاری YFI/USDT: آماده شکستن کانال نزولی و جهش بزرگ!
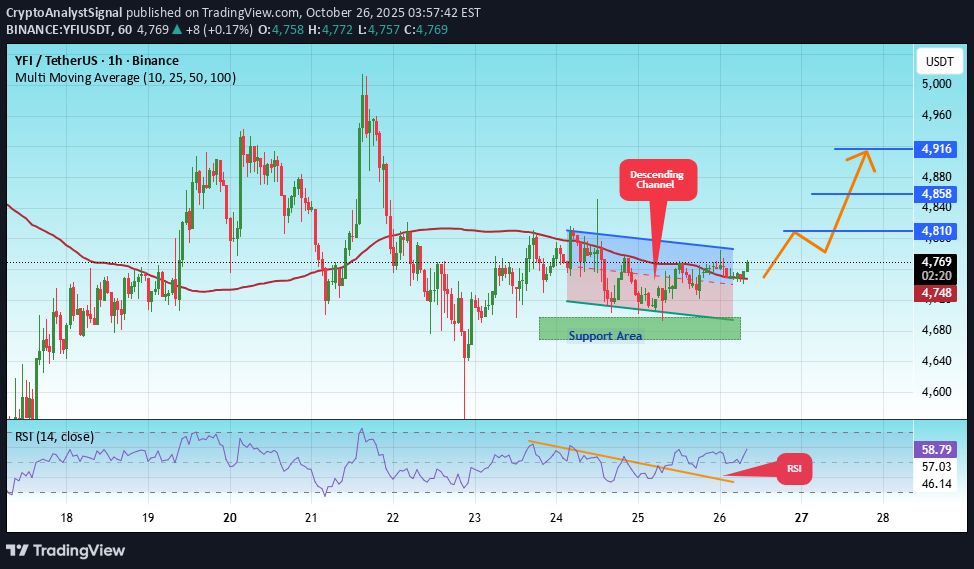
#YFI قیمت در یک کانال نزولی در فریم 1 ساعته حرکت می کند، به خوبی به آن پایبند است و به سمت شکست قوی و تست مجدد پیش می رود. ما یک روند نزولی در اندیکاتور RSI داریم که در شرف شکستن و آزمایش مجدد است، که از move صعودی پشتیبانی می کند. یک ناحیه پشتیبانی major به رنگ سبز در 4680 وجود دارد که نشان دهنده یک نقطه پشتیبانی قوی است. ما به سمت تثبیت بالای میانگین متحرک 100 حرکت می کنیم. قیمت ورودی: 4768 هدف اول: 4810 هدف دوم: 4858 هدف سوم: 4916 یک موضوع ساده را فراموش نکنید: مدیریت سرمایه. وقتی به اولین هدف رسیدید، مقداری پول پس انداز کنید و سپس دستور توقف ضرر خود را به دستور ورودی تغییر دهید. برای سوالات لطفا نظر بدهید ممنونم.#YFI هدف اول: 4810 رسیده است هدف دوم: 4858 رسیده است هدف سوم: 4916 به دست آمد

AloneTrader_
تحلیل تکنیکال YFIUSDT.P: فرصت خرید یا مقاومت پیش رو؟
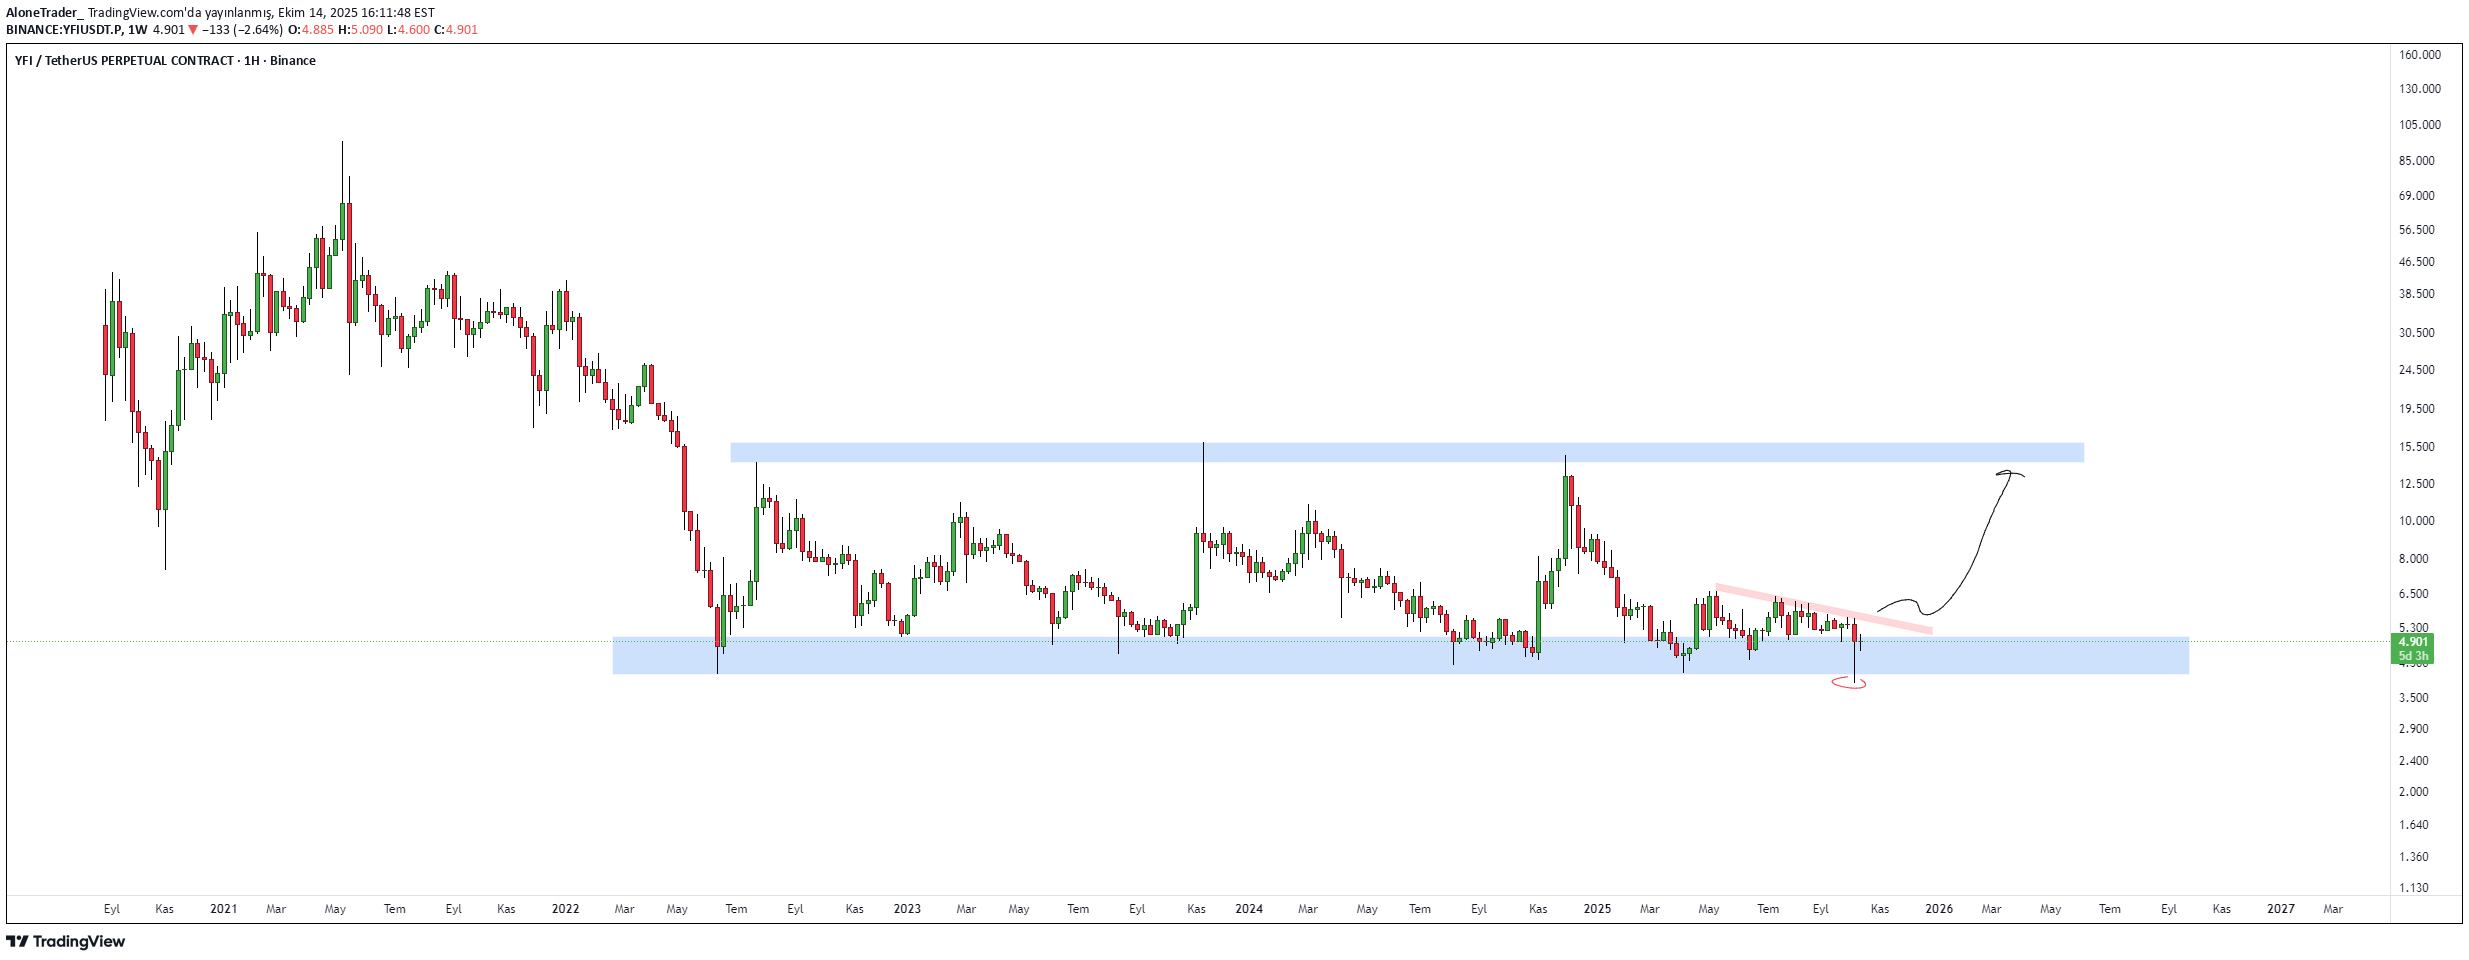
مشاهده میکنم که بر روی یک حمایت قوی باقی مانده است و به نظرم تا مقاومت بالادستی، حاشیه حرکت دارد.

BandForBands
پدر دیفای (YFI) آماده جهش؟ آیا برابری با بیت کوین تکرار میشود؟

۱۲۶۰ روز انباشت برای پدر دیفای، $YFI. فراموش نمیکنیم زمانی را که همارز با ۱ بیتکوین معامله میشد. تاریخ خود را تکرار میکند، و من فکر میکنم که آن سطح برابری میتواند دوباره امکانپذیر شود.

Worldofchartsfx
yfi looking very good

آماده شدن برای یک رالی بزرگ، Yfi باید این محدوده را رد کند، پس از آن می تواند به راحتی 2 برابر شود. بسته شدن قیمت زیر این خط روند + ناحیه افقی این تحلیل را باطل می کند. می تواند یک نقطه ورود با ریسک به ریوارد خوب باشد.

CryptoNuclear
YFI/USDT — Multi-Year Demand Zone: Rebound or Breakdown?
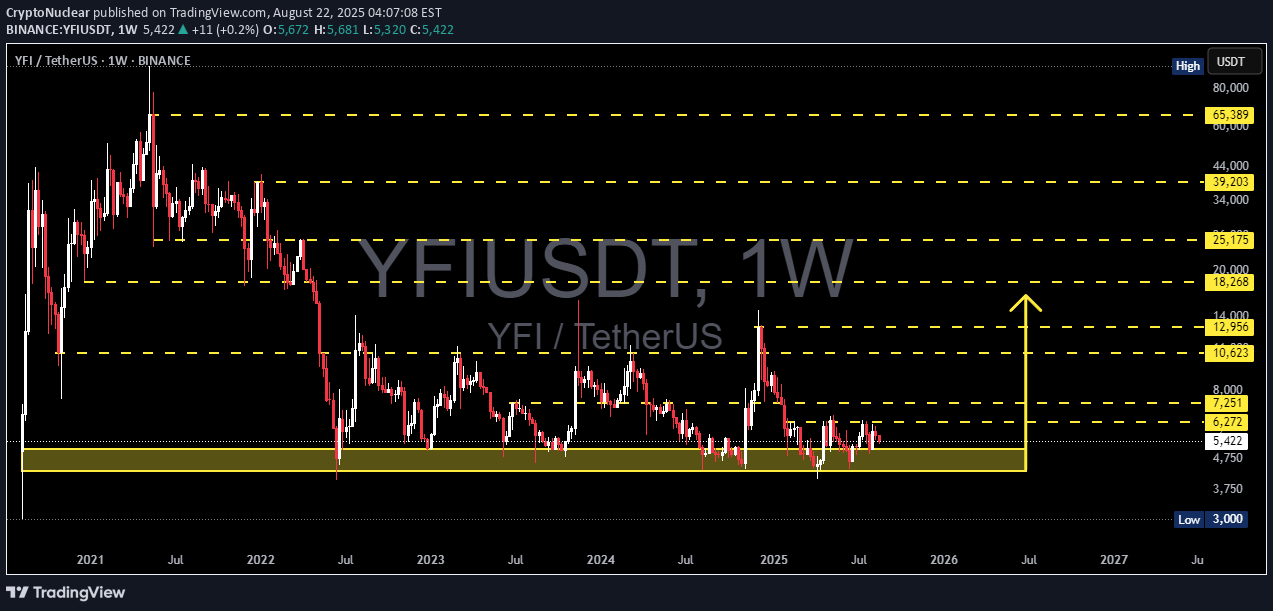
analysis تجزیه و تحلیل کامل در بازه زمانی هفتگی ، YFI/USDT درست بالاتر از منطقه تقاضای چند ساله در حدود 3،800 دلار-4،750 دلار (جعبه زرد) معامله می شود. این منطقه بارها از سال 2022 به عنوان یک پشتیبانی قوی عمل کرده است ، جایی که خریداران برای جلوگیری از کاهش عمیق تر قدم می زنند. پس از افت شدید از اوج 2021 خود ، عملکرد قیمت یک ساختار پایه/انباشت طولانی مدت را تشکیل داده است ، و نشان می دهد که در حالی که فشار فروش کند شده است ، هنوز هیچ حرکت صعودی شدید برای پیشبرد یک صعود پایدار وجود ندارد. با نگاه به سمت بالا ، ما می توانیم در صورت افزایش قیمت ، سطح مقاومت تاریخی را به عنوان موانع اصلی و اهداف بالقوه شناسایی کنیم: 6،272 دلار مقاومت کوتاه مدت مقاومت 7،251 → major مقاومت (تأیید صعودی در صورت شکسته شدن) 10،623 → 12،956 $ → 18،268 $ → 25،175 $ → اهداف اواسط تا طولانی 65،389 دلار → نهایی تاریخی بالا ، فقط واقع بینانه در یک چرخه گاو ماکرو قوی --- 🐂 سناریوی صعودی 1. بازگشت از تقاضا → تا زمانی که بسته های هفتگی بالاتر از 4،750 دلار باقی بمانند ، خریداران می توانند برای دفاع از این منطقه تلاش کنند. 2. اولین ماشه شکست → یک نزدیک هفتگی بالاتر از 6،272 دلار در را به سمت 7،251 دلار باز می کند. 3. ادامه حرکت → شکستن 7،251 دلار با حجم ممکن است تغییر در یک چرخه صعودی را تأیید کند و 10،623 دلار - 12،956 دلار - 18،268 دلار را هدف قرار دهد. 💡 استراتژی: بازرگانان نوسان ممکن است در منطقه تقاضا با توقف تنگ زیر 3800 دلار جمع شوند. بازرگانان محافظه کار ممکن است قبل از ورود ، منتظر یک شکست بالاتر از 6،272 دلار/7،251 دلار باشند. --- 🐻 سناریوی نزولی 1. شکست منطقه تقاضا → نزدیک هفتگی زیر 3،800 دلار-4،750 دلار پشتیبانی چند ساله را باطل می کند. 2. اهداف نزولی → پشتیبانی بعدی major در نزدیکی 3000 دلار قرار دارد و در صورت شتاب دادن ، روند نزولی بیشتر امکان پذیر است. 3. خطر شکست کاذب → یک تجمع به سمت 7K - 10K دلار و پس از آن یک رد شدید می تواند قیمت را به منطقه تقاضا بازگرداند و احتمال خرابی را افزایش می دهد. 💡 استراتژی: در صورت بروز خرابی ، تنظیمات کوتاه یا انتظار برای ورود به پشتیبانی پایین تر ممکن است خطر/پاداش بهتری را فراهم کند. --- struction ساختار الگوی پایه تجمع / دامنه بلند مدت → قیمت ادغام برای چندین سال بالاتر از یک منطقه تقاضای کلیدی. دامنه بازار محدوده → محدوده معاملات فعلی بین 3،800 دلار-7،251 دلار باقی مانده است. نقطه تصمیم گیری → هرچه ادغام طولانی تر باشد ، احتمالاً برک آوت قدرتمندتر بود. --- 🔑 غذای اصلی YFI در یک نقطه تصمیم گیری مهم قرار دارد: بالاتر از تقاضا نگه دارید یا به پایین ترین پایین بروید. مورد صخره ای: شکست بالاتر از 6،272 → تأیید با 7،251 دلار → تجمع بالقوه به 10K دلار - 12K $+. مورد Bearish: شکست زیر 3،800 دلار - 4،750 دلار → به احتمال زیاد move به 3000 دلار یا پایین تر. منطقه زرد = میدان نبرد که روند چند ماهه YFI را تعریف می کند. --- 📝 یادداشت مهم این تجزیه و تحلیل مبتنی بر عملکرد قیمت و سطح تاریخی است. همیشه با شاخص ها (RSI ، MACD ، Volume) ترکیب کنید و به احساسات بازار توجه کنید (BTC تسلط ، شرایط کلان). این مشاوره مالی نیست - قبل از تصمیم گیری در مورد تجارت ، تحقیقات خود را انجام دهید. #YFI #yfiusdt #yearnfinance #crypto #technalanalysis #supportresistance #PriceAction #swingtrading #altcoin

andrewdresselhaus12345
YFI LONG RISING WEDGE

ما در یک روند صعودی a خوبی قرار داریم. دلیلی نمی بینم که چرا این روند در کوتاه مدت یا بالای میانگین متحرک 204 ساعته در بازه زمانی 15 دقیقه ای نتواند ادامه پیدا نکند. ما بالاتر از میانگین متحرک 200 روزه در بازه زمانی 15 دقیقه ای و همچنین در بازه زمانی four ساعته قرار داریم، و این همان زمانی است که من دوست دارم در هر دارایی، موقعیت خرید باز کنم.
سلب مسئولیت
هر محتوا و مطالب مندرج در سایت و کانالهای رسمی ارتباطی سهمتو، جمعبندی نظرات و تحلیلهای شخصی و غیر تعهد آور بوده و هیچگونه توصیهای مبنی بر خرید، فروش، ورود و یا خروج از بازارهای مالی نمی باشد. همچنین کلیه اخبار و تحلیلهای مندرج در سایت و کانالها، صرفا بازنشر اطلاعات از منابع رسمی و غیر رسمی داخلی و خارجی است و بدیهی است استفاده کنندگان محتوای مذکور، مسئول پیگیری و حصول اطمینان از اصالت و درستی مطالب هستند. از این رو ضمن سلب مسئولیت اعلام میدارد مسئولیت هرنوع تصمیم گیری و اقدام و سود و زیان احتمالی در بازار سرمایه و ارز دیجیتال، با شخص معامله گر است.