
CoreCrypto1
@t_CoreCrypto1

What symbols does the trader recommend buying?
Purchase History
پیام های تریدر
Filter
CoreCrypto1
AVAX/USDT – Major Breakout on the Daily Timeframe!
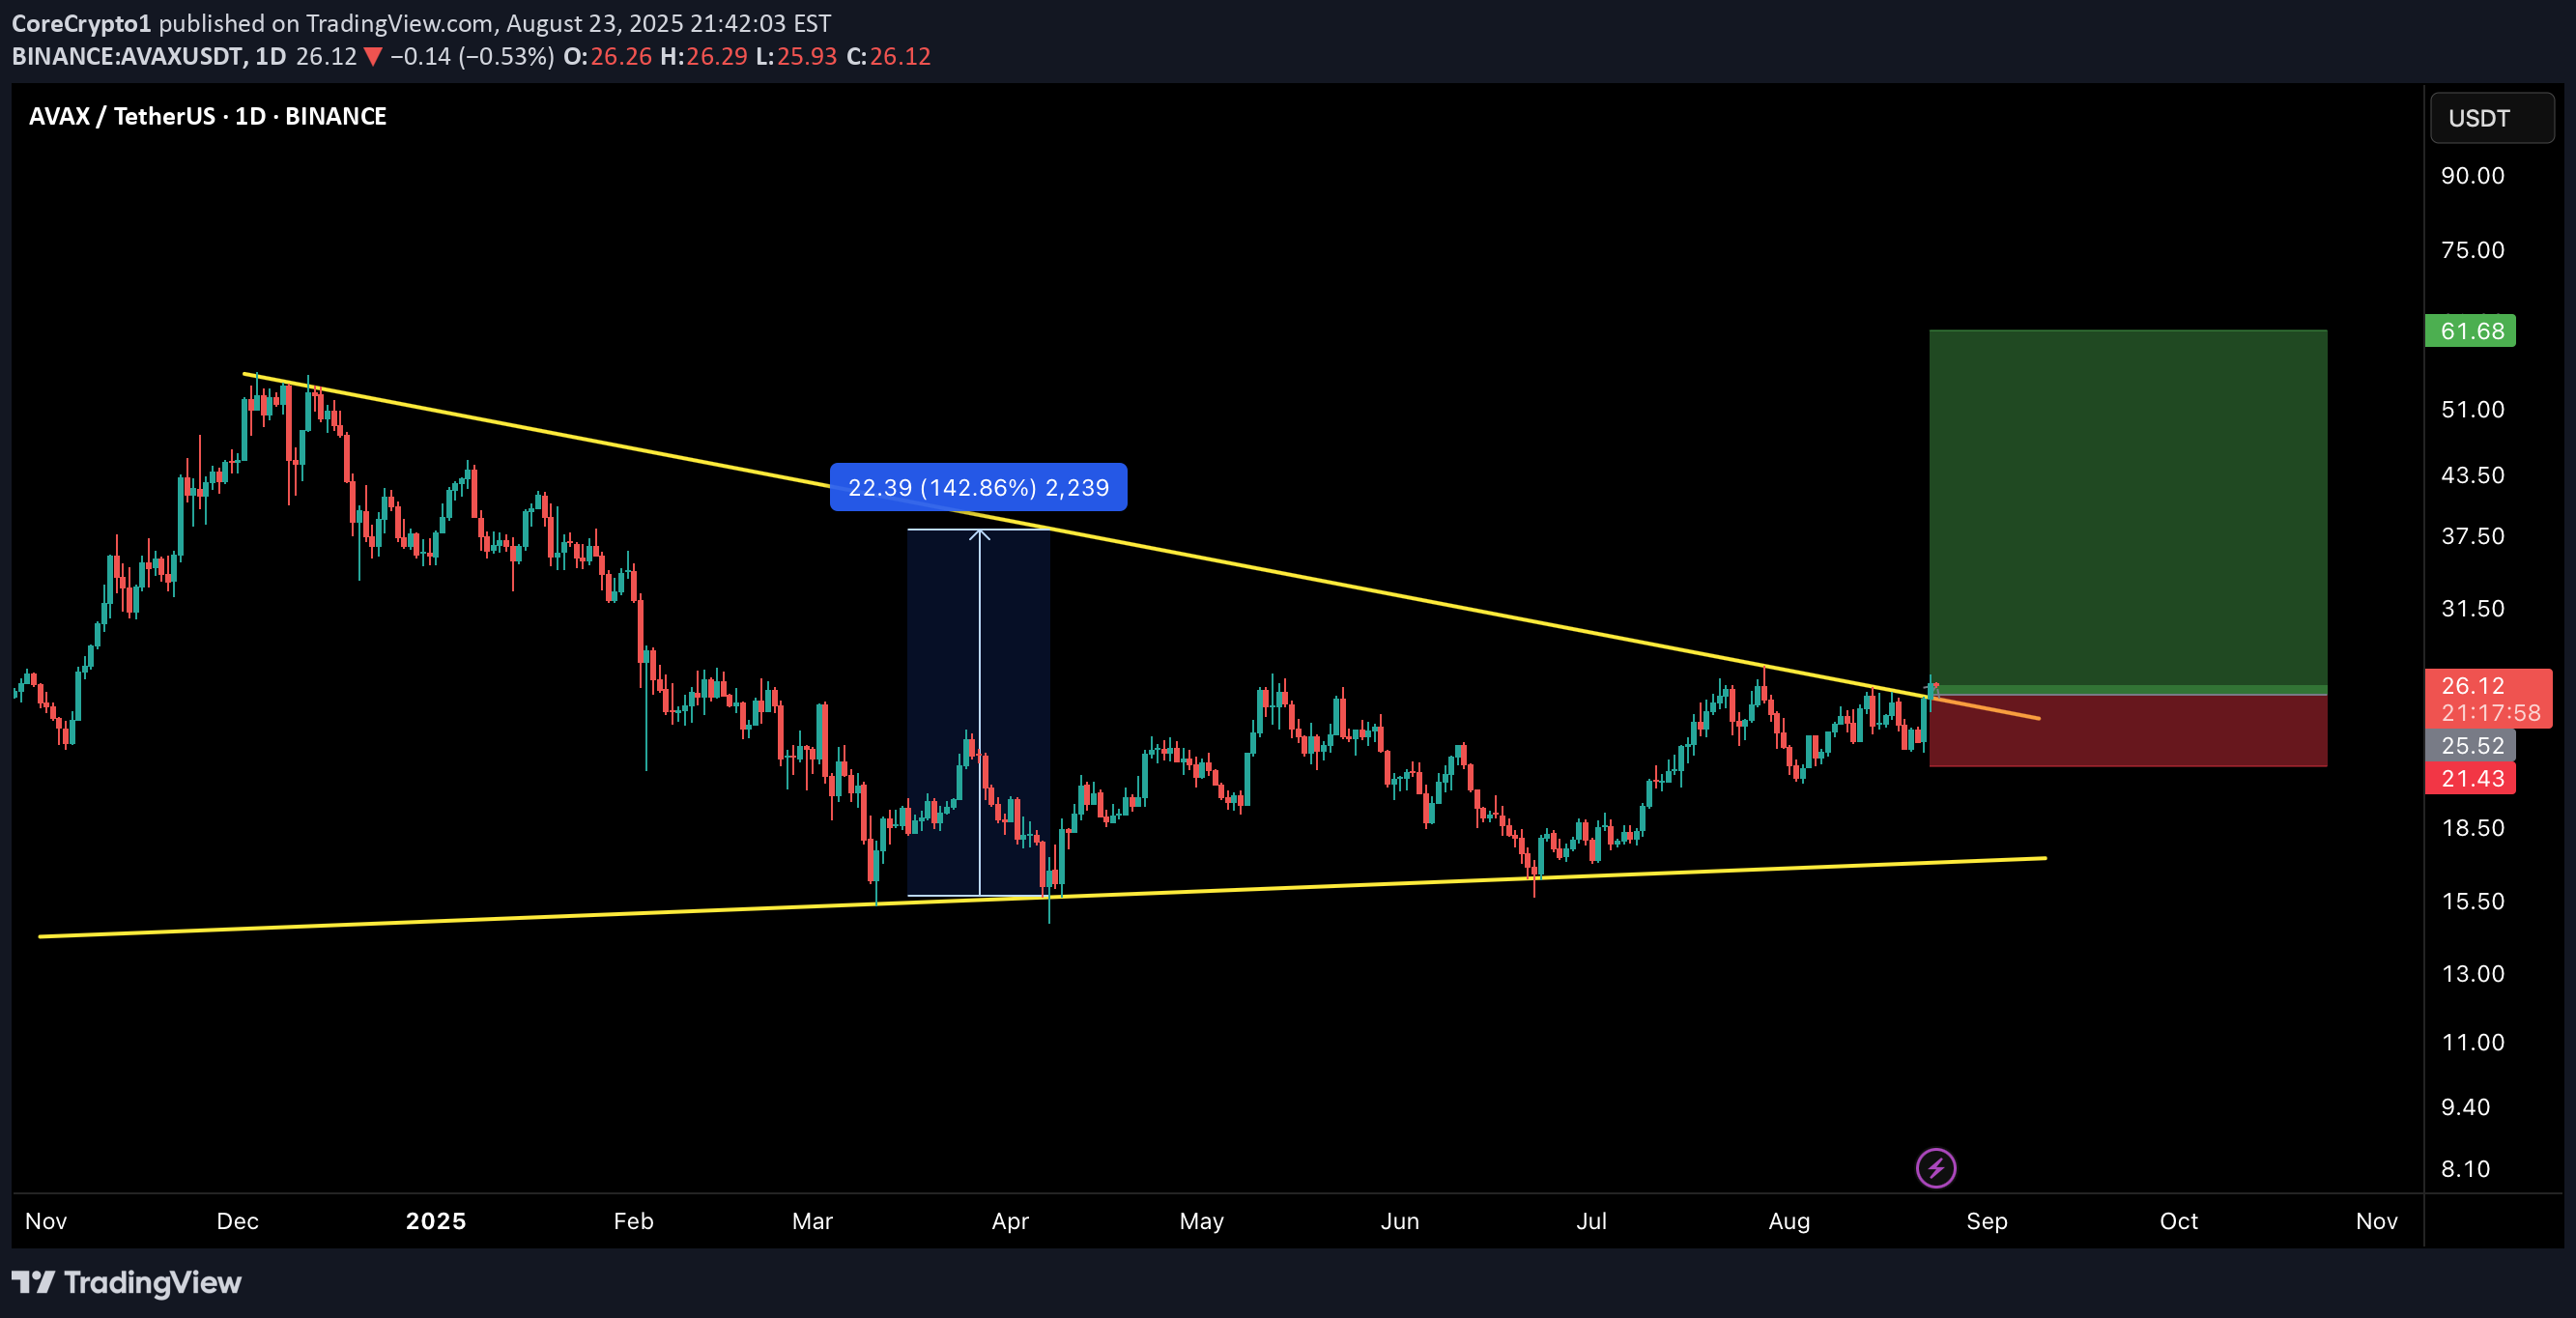
AVAX has finally broken out from its long-term descending trendline, signaling the potential start of a powerful bullish move. Let’s break down the setup: 🔎 Chart Analysis: Pattern: Falling Wedge on the Daily timeframe. Breakout Zone: Price has successfully closed above the resistance trendline around $25–26. Support Zone: Strong accumulation support around $24–26 🎯 Trade Setup: Entry Zone: $24–26 (current breakout retest levels) Targets: TP1: $35 TP2: $48 TP3: $60+ Stop Loss: $21 (below wedge & accumulation box) 📊 Risk/Reward: R/R ratio: ~5:1 High conviction setup with breakout confirmation. ⚡ Key Takeaway: If AVAX holds above the breakout zone, it could deliver a 2x–3x run in this cycle. Watch closely for volume confirmation on daily candles to strengthen the breakout signal. 🔥 Conclusion: AVAX looks primed for a strong bullish rally after months of consolidation. Accumulation zones are done — breakout traders could be rewarded big here!
CoreCrypto1
ETH/USDT – Mega Breakout on Higher Timeframe!
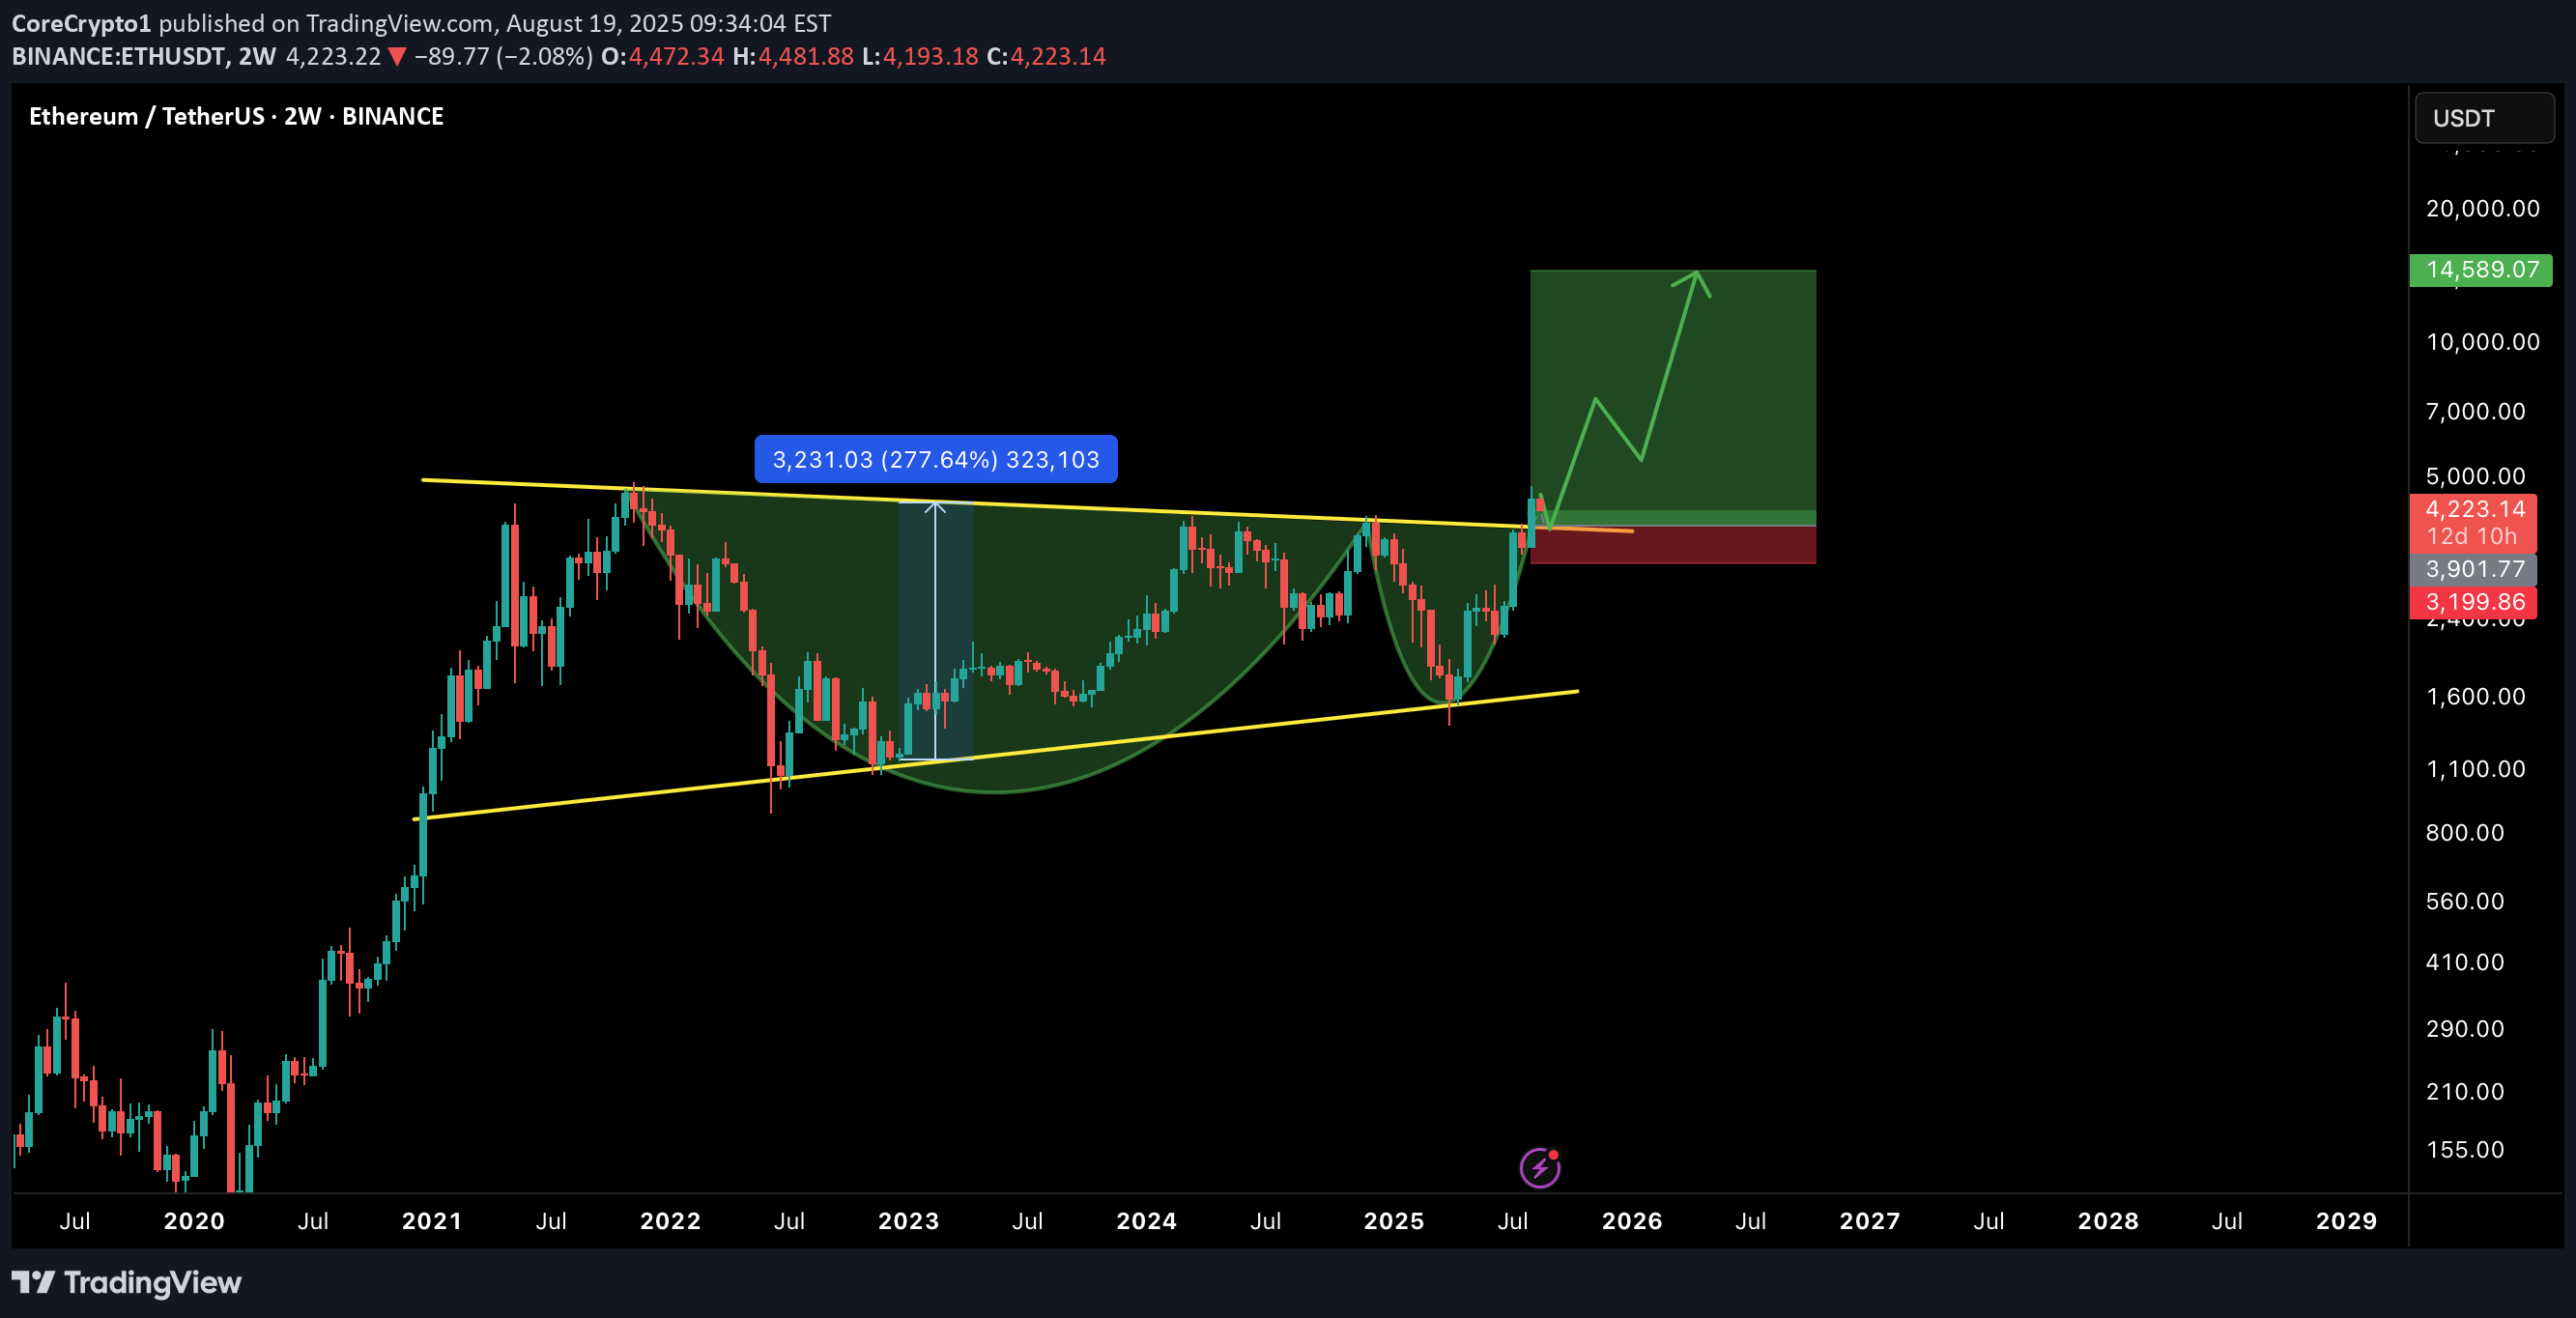
Ethereum has confirmed a massive breakout on the 2W timeframe, breaking through a multi-year cup & handle and also ascending triangle formation. This is one of the strongest bullish continuation patterns and could fuel ETH into a new long-term rally. 🚀 📊 Chart Analysis Pattern: Cup & Handle on the 2W chart. Breakout Zone: Around $4,000–$4,300, now acting as support. Measured Move Target: ~$14,500 (based on cup depth). Stop Loss Zone: ~$3,200 (below major support). ✅ Bullish Factors Multi-Year Accumulation: ETH has spent years consolidating below $4K, and this breakout confirms strength. High R:R Setup: Risk is limited while the potential upside is ~3x from current levels. Market Cycle Timing: BTC dominance topping out + potential altseason rotation favors ETH’s outperformance. Strong Structure: Break above resistance aligns with long-term moving averages flipping bullish. ⚠️ Risk Factors Macro events (FOMC, inflation data) could cause temporary retracements. A weekly close back below $4K would invalidate the breakout. BTC volatility may suppress ETH in the short term before altseason kicks in. 🎯 Targets TP1: $6,500 TP2: $9,500 TP3: $14,500 (full measured move target) 📌 Conclusion ETH is showing one of the strongest technical breakouts in years. If $4K+ holds as support, the path to new ATHs and beyond looks wide open. This setup could define the next phase of the bull market. Bulls are in control — it’s ETH’s time to shine. 🌟 🔔 What’s your target for ETH in this cycle? $10K or higher? Let me know in the comments
CoreCrypto1
MANTA/USDT – Long Setup Alert!
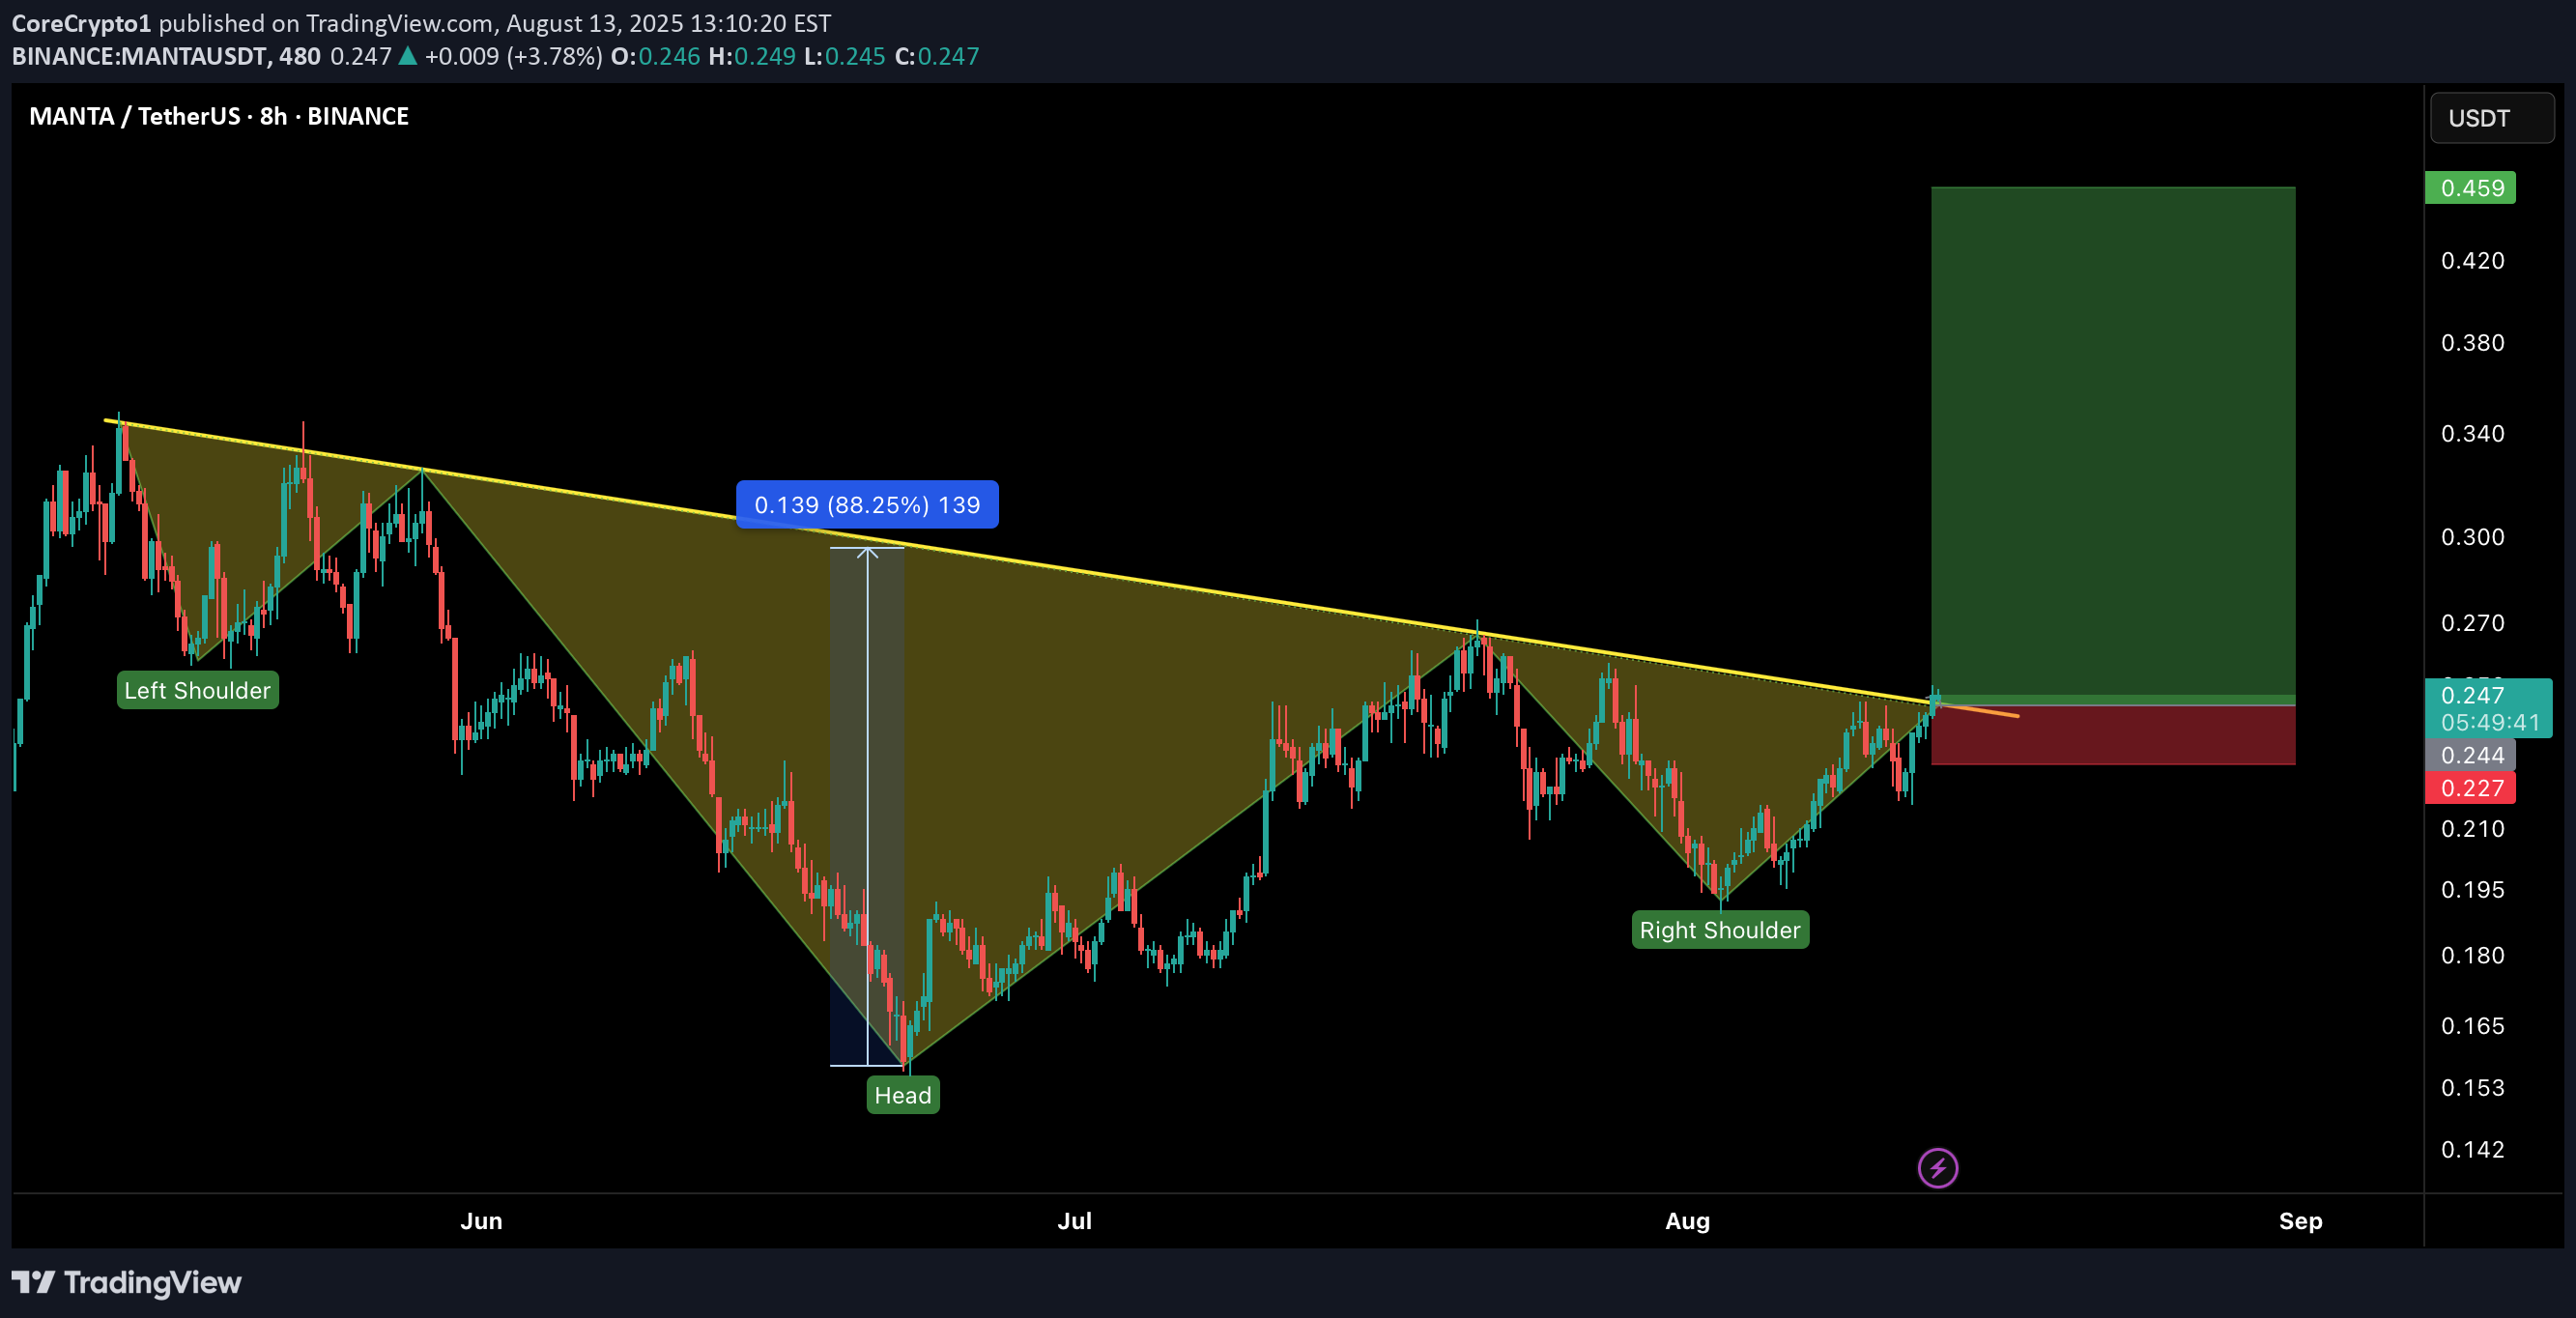
MANTA has just broken out of a massive Inverse Head & Shoulders pattern on the 8H chart — a bullish reversal signal that could ignite a strong upside rally. 📈 Setup Details: Entry: CMP – 0.248 Stop Loss: 0.227 (below neckline retest) Targets: 🎯 TP1: 0.34 🎯 TP2: 0.42 🎯 TP3: 0.459 Leverage: 5x max (adjust risk accordingly) Why This Setup? ✅ Clean breakout above neckline after weeks of consolidation ✅ Volume supporting the breakout ✅ Pattern target aligns with strong resistance zone above ⚠️ Risk Management: Stick to your SL. A failed retest can trap late entries. Bulls are in control — let’s ride this momentum!
CoreCrypto1
#BTCUSDT – Healthy Correction, Not the End!

Bitcoin is currently experiencing a healthy pullback after an impressive run, testing the neckline of the Inverse Head & Shoulders breakout on the 1D timeframe. 🔹 Current Market View: BTC is retesting the neckline of the IHS pattern, which now acts as a strong support zone. Price is holding near $113K–$115K, which is crucial for maintaining bullish momentum. This dip is a healthy correction, flushing out over-leveraged positions and preparing for the next leg up. 🔹 Key Levels: Support Zone: $113,000 – $115,000 Immediate Resistance: $120,000 – $122,500 Breakout Target: $165,000+ on the next bullish wave 🔹 Market Sentiment: Holding above the neckline keeps the bullish structure intact. If the support holds, we can expect continuation to new highs once buying pressure returns. A daily close below $112K would signal caution and delay the next rally. 💡 Tip: Don’t panic on these red candles. Healthy corrections are part of a sustainable uptrend.
CoreCrypto1
BTC/USDT – Bullish Pennant Setting Up for the Next Leg!

Bitcoin is currently forming a bullish pennant — a classic continuation pattern — right after a strong 14% impulse move. This type of structure often leads to a breakout followed by another powerful rally. And it’s coiling up nicely. 🧠 Technical Breakdown: 🟢 Bullish pennant formation in progress 🔽 Support zone: $115.5K – $116.5K 📏 Flagpole projection targets $135K+ on breakout ⚠️ Currently consolidating with lower volatility — breakout could be near 🔍 What to Watch For: Clean breakout above pennant = breakout confirmation Daily close below $115K = invalidation zone Volume spike will likely signal the next move 📢 Final Take: BTC is showing healthy consolidation after a strong move, and this pennant could launch us toward $135K and beyond. Keep your eyes on the breakout and manage risk wisely. 💬 Share your thoughts below & smash that ❤️ if you’re watching this move!
CoreCrypto1
$LTC READY FOR EXPLOSION! THE COMEBACK OF THE OG?
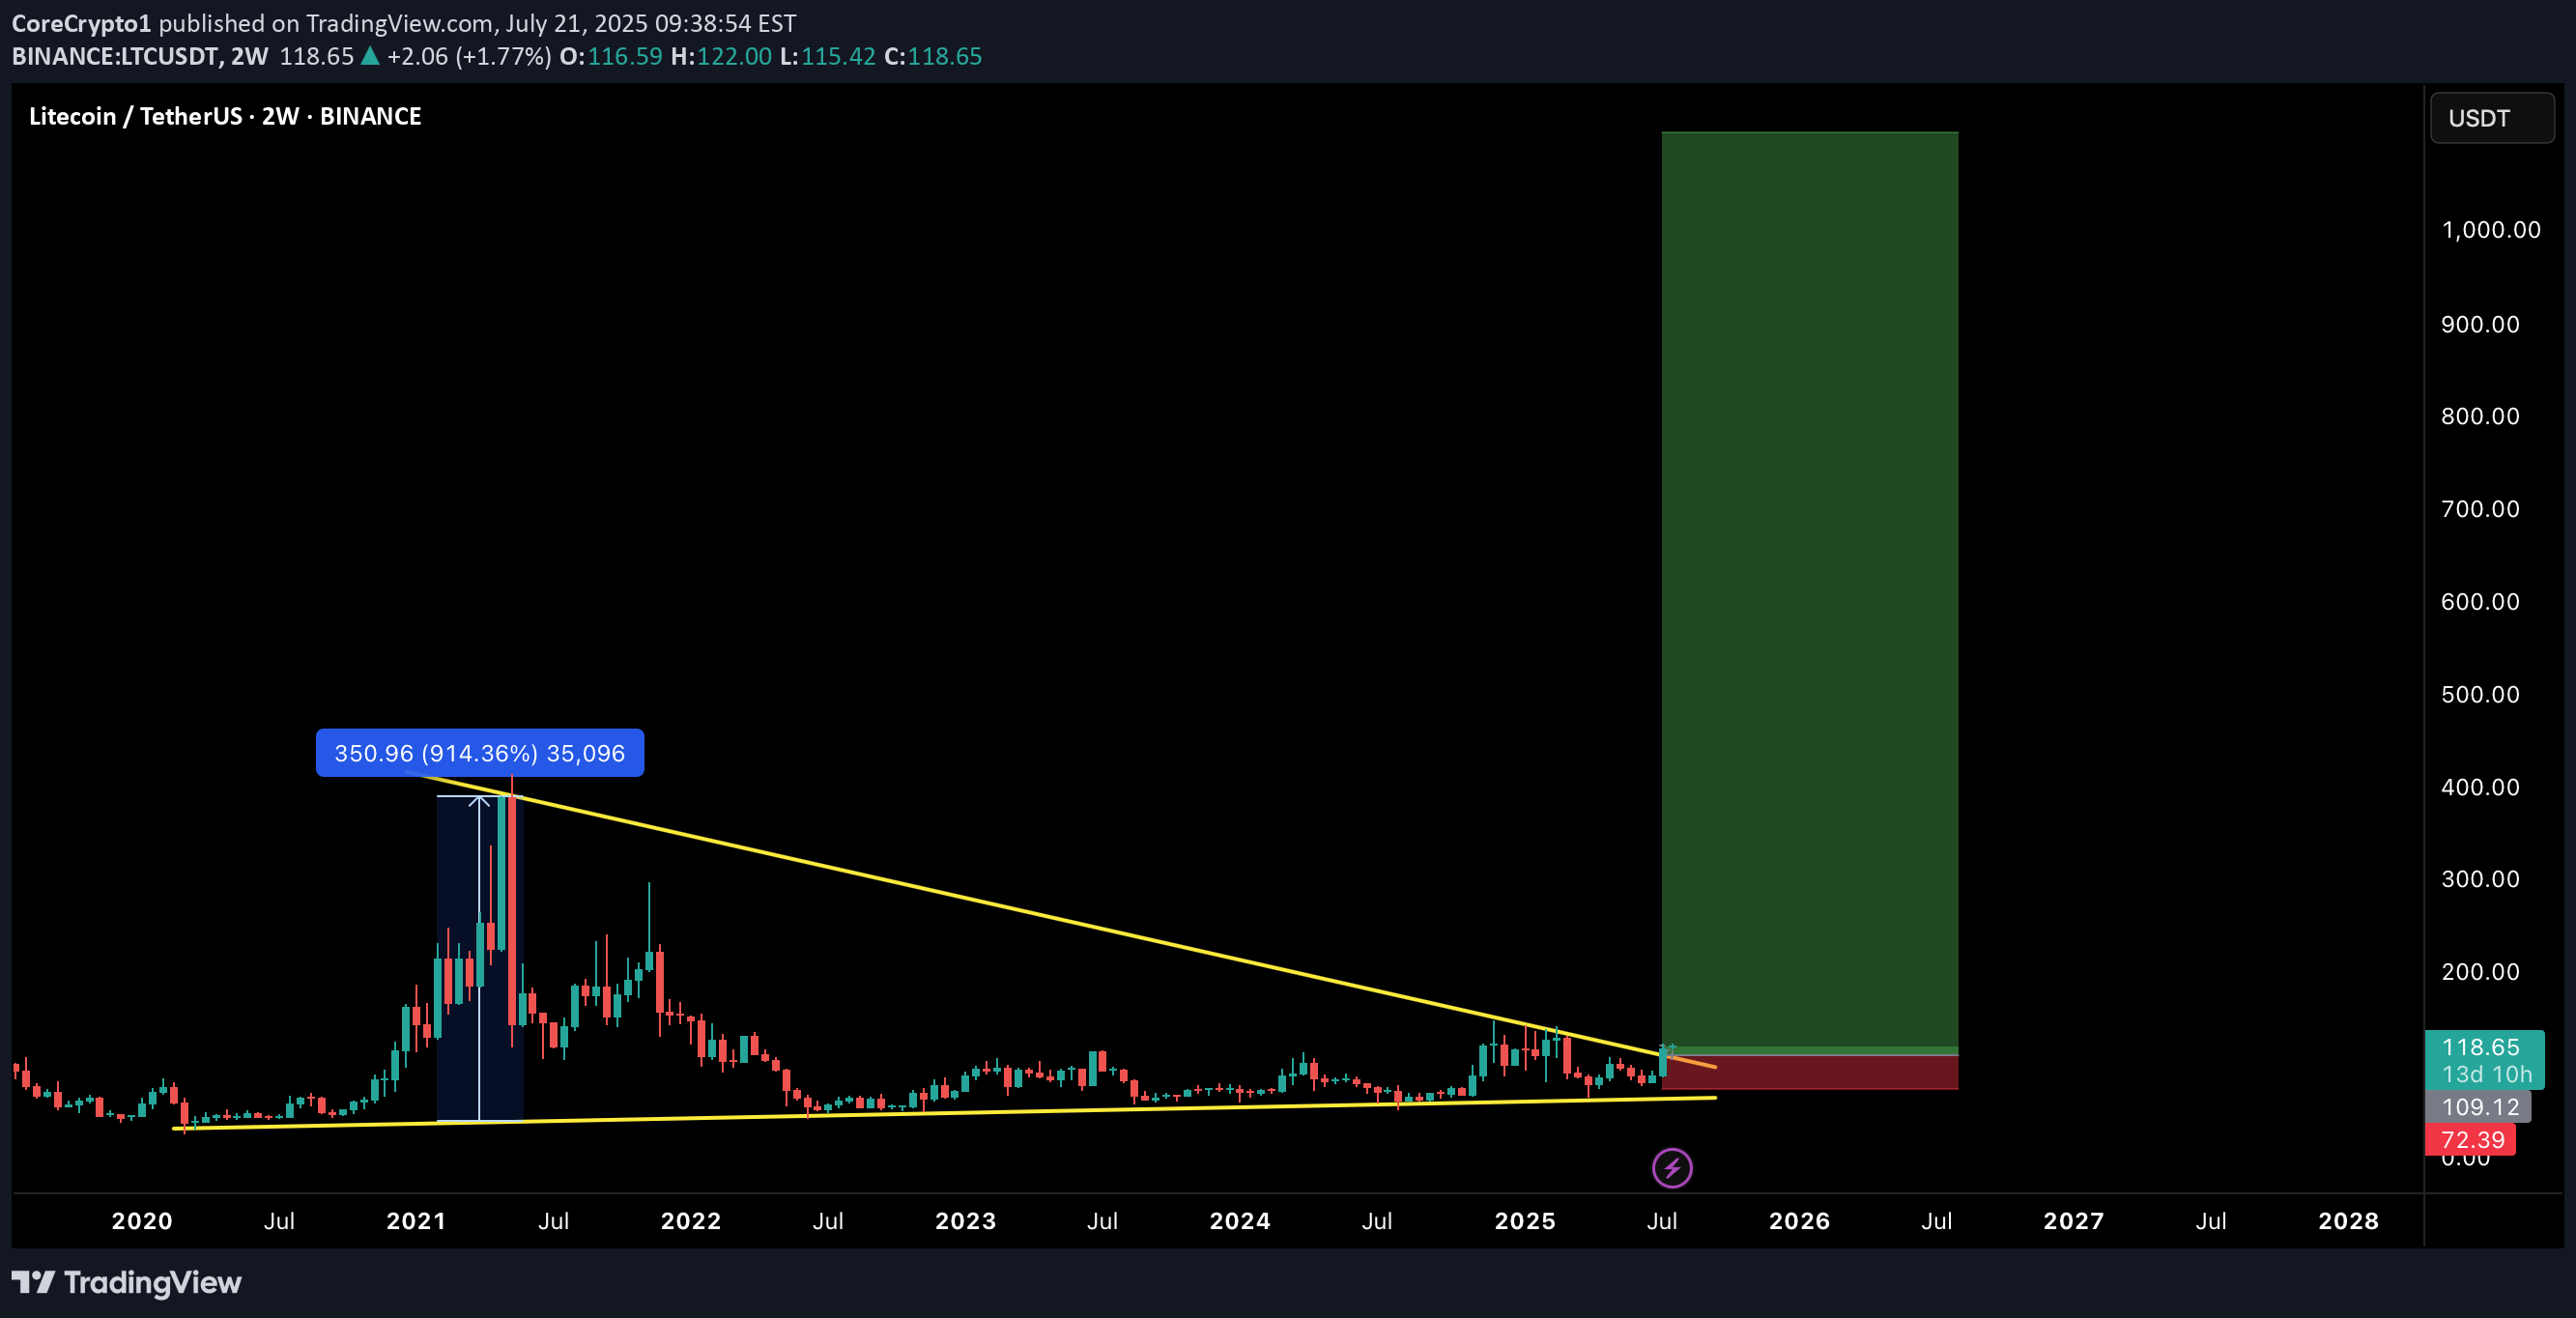
Litecoin has quietly formed one of the most massive macro structures in the market — a multi-year falling wedge on the 2-week timeframe, now breaking out with early confirmation. This could be the start of a generational move, similar to the 2020 breakout. Let's break it down: 🧠 Technical Breakdown: ✅ Falling wedge forming since 2021 — 4 years of compression ✅ Volume and structure support breakout ✅ LTC already gave a 914% rally last time it broke a similar level 📏 Target zone extends above $900–$1000 🛒 Entry Zone: Current Price: $118 🟢 Buy on breakout or dips near $105–$110 for safer entries 🎯 Target Zones: TP1: $280 TP2: $400 TP3: $650 TP4: $950+ 🛑 Stop-loss: Breakdown below $72 (last higher low & wedge base) ⚖️ Risk-to-Reward: High timeframe structure = High conviction play. Potential R:R > 8x — Rare macro opportunities like this don’t come often. 🧩 Final Thoughts: LTC may not be the flashiest alt anymore, but this setup is technically undeniable. If BTC enters full bull cycle, LTC could ride the wave explosively. 🔥 This could be a "buy and forget" macro play for 6–12 months. 💬 Let me know your thoughts in the comments & hit that ❤️ if you like macro setups like these!
CoreCrypto1
ARB/USDT – Weekly Breakout Setup!

Hey Traders! If you’re finding value in this analysis, smash that 👍 and hit Follow for high-accuracy trade setups that actually deliver! Massive Falling Wedge Breakout in Play! ARB just confirmed a breakout from a long-term falling wedge pattern on the weekly timeframe, which has historically been one of the most reliable bullish reversal structures in technical analysis. 🧠 Why this setup matters: The falling wedge has been forming for over a year, indicating long-term accumulation and compression. Price has clearly broken above the descending resistance, suggesting a potential shift in momentum. The structure resembles previous explosive moves, and this could just be the start of a multi-month rally. 🟢 Trade Setup: Entry: CMP ($0.49) & accumulate on any dips Targets: 🎯 $0.85 🎯 $1.30 🎯 $2.10+ (Full wedge target) Stop-loss: 🔴 Close below $0.30 Timeframe: Mid to long term (6–12 weeks or more) 🚀 Bullish Signals: Weekly breakout candle with strong volume (confirmation pending close). Market-wide sentiment is gradually turning, and ARB may become one of the leaders. 📌 Final Thoughts: This is a high-conviction swing setup with a strong reward-to-risk ratio. Keep an eye on weekly close confirmation and market sentiment for better entries. 💬 Let me know your thoughts or if you’re riding this setup too!
CoreCrypto1
FET/USDT – Head & Shoulders Breakout!

Hey Traders — if you're into high-conviction setups with real momentum, this one’s for you. ONDO is trading inside a falling wedge on the daily chart — a classic bullish structure that often leads to explosive breakouts. 📈 FET just broke out of a classic inverse head & shoulders pattern — a strong bullish reversal structure! The breakout looks clean with a confirmed close above the neckline and volume starting to pick up. 💼 Entry: CMP ($0.75) 🎯 Targets: $0.85 / $0.95 / $1.09 🛑 Stop-loss: $0.705 📈 Risk-Reward: Favorable 🧠 Why it matters: Clean breakout above resistance Strong trend reversal structure Potential for 40%+ move ahead. 💬 Are you in this breakout play or watching from the sidelines? Let’s talk below! 👉 Smash that LIKE and FOLLOW for more real-time setups!
CoreCrypto1
DOGE/USDT – Is Dogecoin About to Ignite Altseason Again?

Hey Traders! If you’re finding value in this analysis, smash that 👍 and hit Follow for high-accuracy trade setups that actually deliver! Dogecoin just broke out of a multi-month descending wedge — and history tells us to pay close attention when this meme king wakes up. Let’s dive into why this setup could be the start of something massive. 📈 Chart Pattern DOGE has been consolidating for months inside a falling wedge — a classic bullish reversal structure. It’s now finally broken out with strong volume confirmation, holding above the 50 EMA and showing signs of momentum building up. 🔍 Historical Clue Remember what happened in the previous bull markets? ✅ 2021: DOGE exploded 2000%+ and triggered the craziest altseason ever. ✅ 2017: DOGE moved first, followed by hundreds of altcoins rallying massively. Now, in 2025 — it looks eerily similar. Every time DOGE wakes up, it signals that retail and meme sentiment is heating up, a classic altseason ignition. 🎯 Trade Setup Entry: $0.198 (Already triggered) Targets: TP1: $0.28 TP2: $0.42 TP3: $0.64 Stoploss: $0.162 Risk-Reward: Massive upside potential, with clearly defined invalidation. 💡 Final Thoughts Altcoins are starting to follow. ETH has broken out. XRP is running. BTC dominance has rejected trendline resistance. Everything is aligning. If history repeats, this breakout in DOGE could mark the official start of Altseason 2025. 👉 Don’t sleep on DOGE. This might just be the trigger we’ve been waiting for. 📌 Follow for more setups & insights. Stay tuned!
CoreCrypto1
ETHEREUM BREAKOUT CONFIRMED!

Hey Traders!If you’re finding value in this analysis, smash that 👍 and hit Follow for high-accuracy trade setups that actually deliver!After months of consolidation inside this massive symmetrical triangle, ETH finally breaks out on the daily chart—and this could be the spark for the next major rally! 🔥📈 Structure: Symmetrical Triangle✅ Breakout Confirmed📍 CMP: ~$2,760🎯 Next Major Target: $5,000+This is the breakout bulls have been waiting for! If momentum sustains, ETH could enter price discovery territory soon. Buckle up—the real move might just be beginning. 🚀Let’s see how far it runs from here!Drop your targets in the comments 👇
Disclaimer
Any content and materials included in Sahmeto's website and official communication channels are a compilation of personal opinions and analyses and are not binding. They do not constitute any recommendation for buying, selling, entering or exiting the stock market and cryptocurrency market. Also, all news and analyses included in the website and channels are merely republished information from official and unofficial domestic and foreign sources, and it is obvious that users of the said content are responsible for following up and ensuring the authenticity and accuracy of the materials. Therefore, while disclaiming responsibility, it is declared that the responsibility for any decision-making, action, and potential profit and loss in the capital market and cryptocurrency market lies with the trader.