
FET
ای فچ ایآی
| تریدر | نوع سیگنال | حد سود/ضرر | زمان انتشار | مشاهده پیام |
|---|---|---|---|---|
 Infamousmoneotرتبه: 1506 | خرید | حد سود: تعیین نشده حد ضرر: تعیین نشده | ۱۴۰۴/۹/۱۹ | |
 SaykoCryptoرتبه: 5353 | خرید | حد سود: تعیین نشده حد ضرر: تعیین نشده | ۱۴۰۴/۹/۱۵ | |
 CryptoAnalystSignalرتبه: 30903 | خرید | حد سود: تعیین نشده حد ضرر: تعیین نشده | ۱۴۰۴/۹/۱۷ | |
 ahmadarzرتبه: 295 | خرید | حد سود: تعیین نشده حد ضرر: تعیین نشده | ۱۴۰۴/۹/۹ | |
 TradeWithMkyرتبه: 1253 | خرید | حد سود: تعیین نشده حد ضرر: تعیین نشده | ۱۴۰۴/۸/۲۸ |
نمودار قیمت ای فچ ایآی
سود ۳ ماهه :
خلاصه سیگنالهای ای فچ ایآی
سیگنالهای ای فچ ایآی
فیلتر
مرتب سازی پیام براساس
نوع پیام
نوع تریدر
فیلتر زمان

Infamousmoneot
تحلیل شوکهکننده FET: آیا این آلتکوین به ۱ دلار میرسد؟ (اهداف قیمتی جدید)
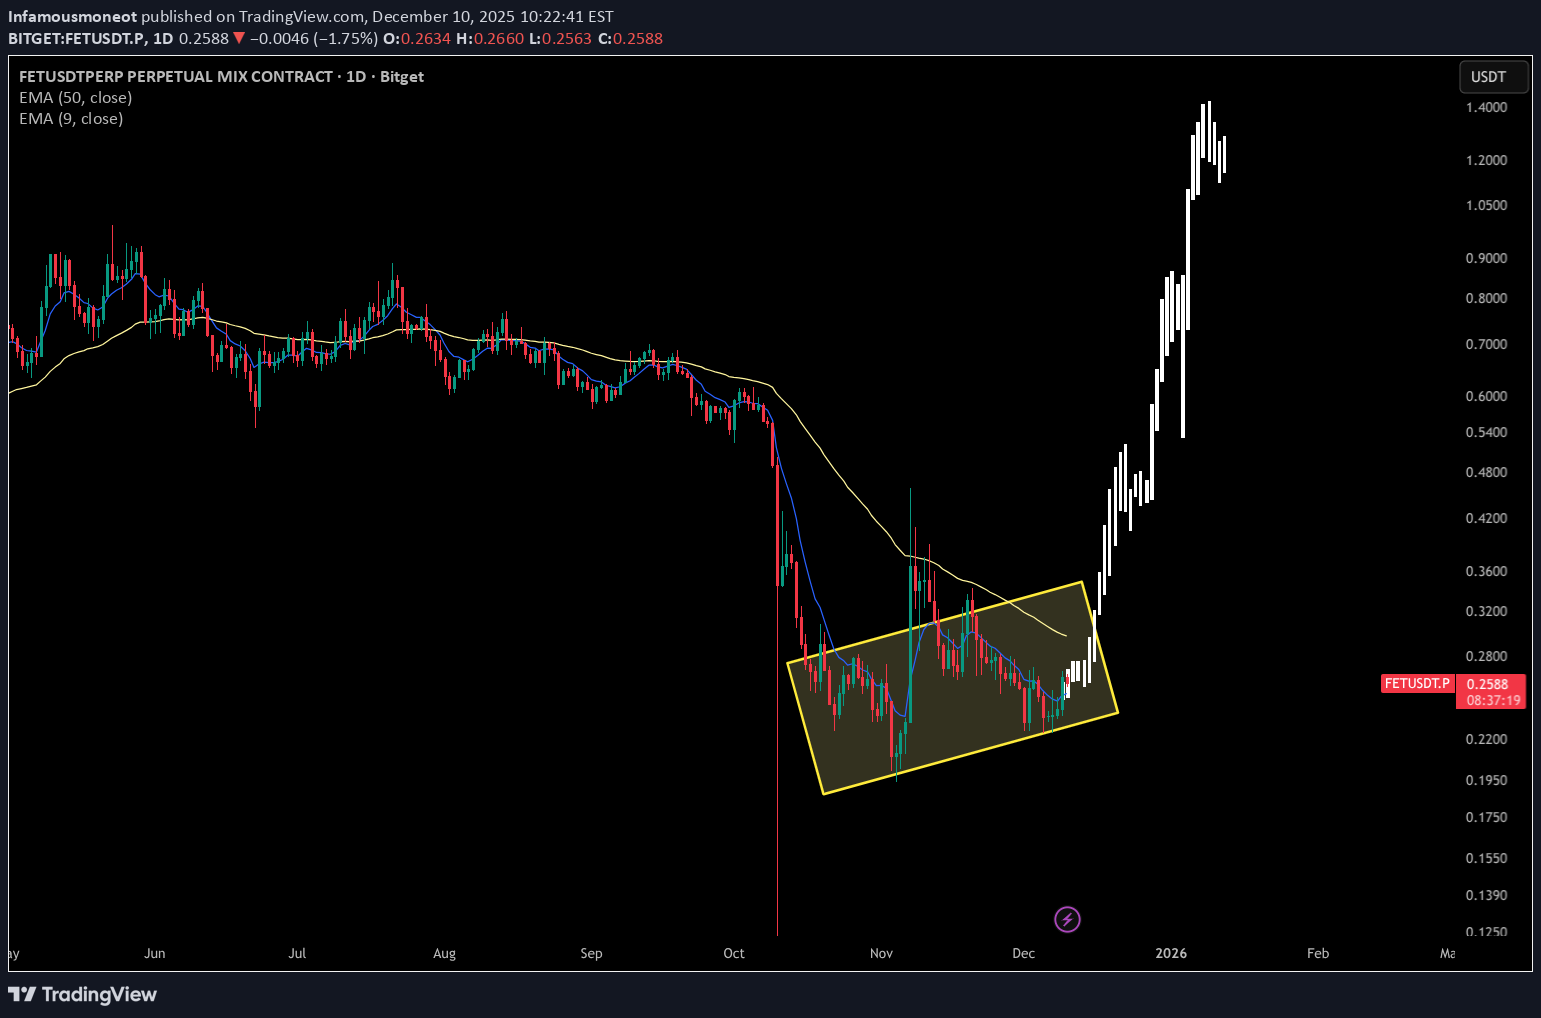
ای تاجران، امروز حالم خوب است و دومین تحلیل روز را برایتان میآورم. آخرین باری که در موردش صحبت کردم FET من اشتباه کردم و قیمت به شدت کاهش یافت. این بار، با پشتوانه تحلیل قبلی من در مورد تسلط Ethereum، معتقدم Fetch می تواند در ماه های آینده عملکرد بسیار خوبی داشته باشد. با پشت سر گذاشتن مسائل حقوقی پروتکل Ocean، به نظر می رسد این پروژه در شرف احیای مجدد است. طی چند هفته گذشته به پایینترین سطح خود رسیده است و من متوجه تجمع بسیار جالبی در زنجیره شدهام. به همین دلیل، من فکر می کنم که ممکن است در چند ماه آینده وارد یک تجمع کوچک شود: هدف اول → 0.50 دلار هدف دوم → 0.80 دلار هدف سوم → 1.00 دلار همانطور که همیشه می گویم - باهوش بمان و آرام بمان!
پیشبینی جسورانه تحلیلگر: آینده قیمت Fetch.ai (FET) در آستانه شکاف بزرگ!
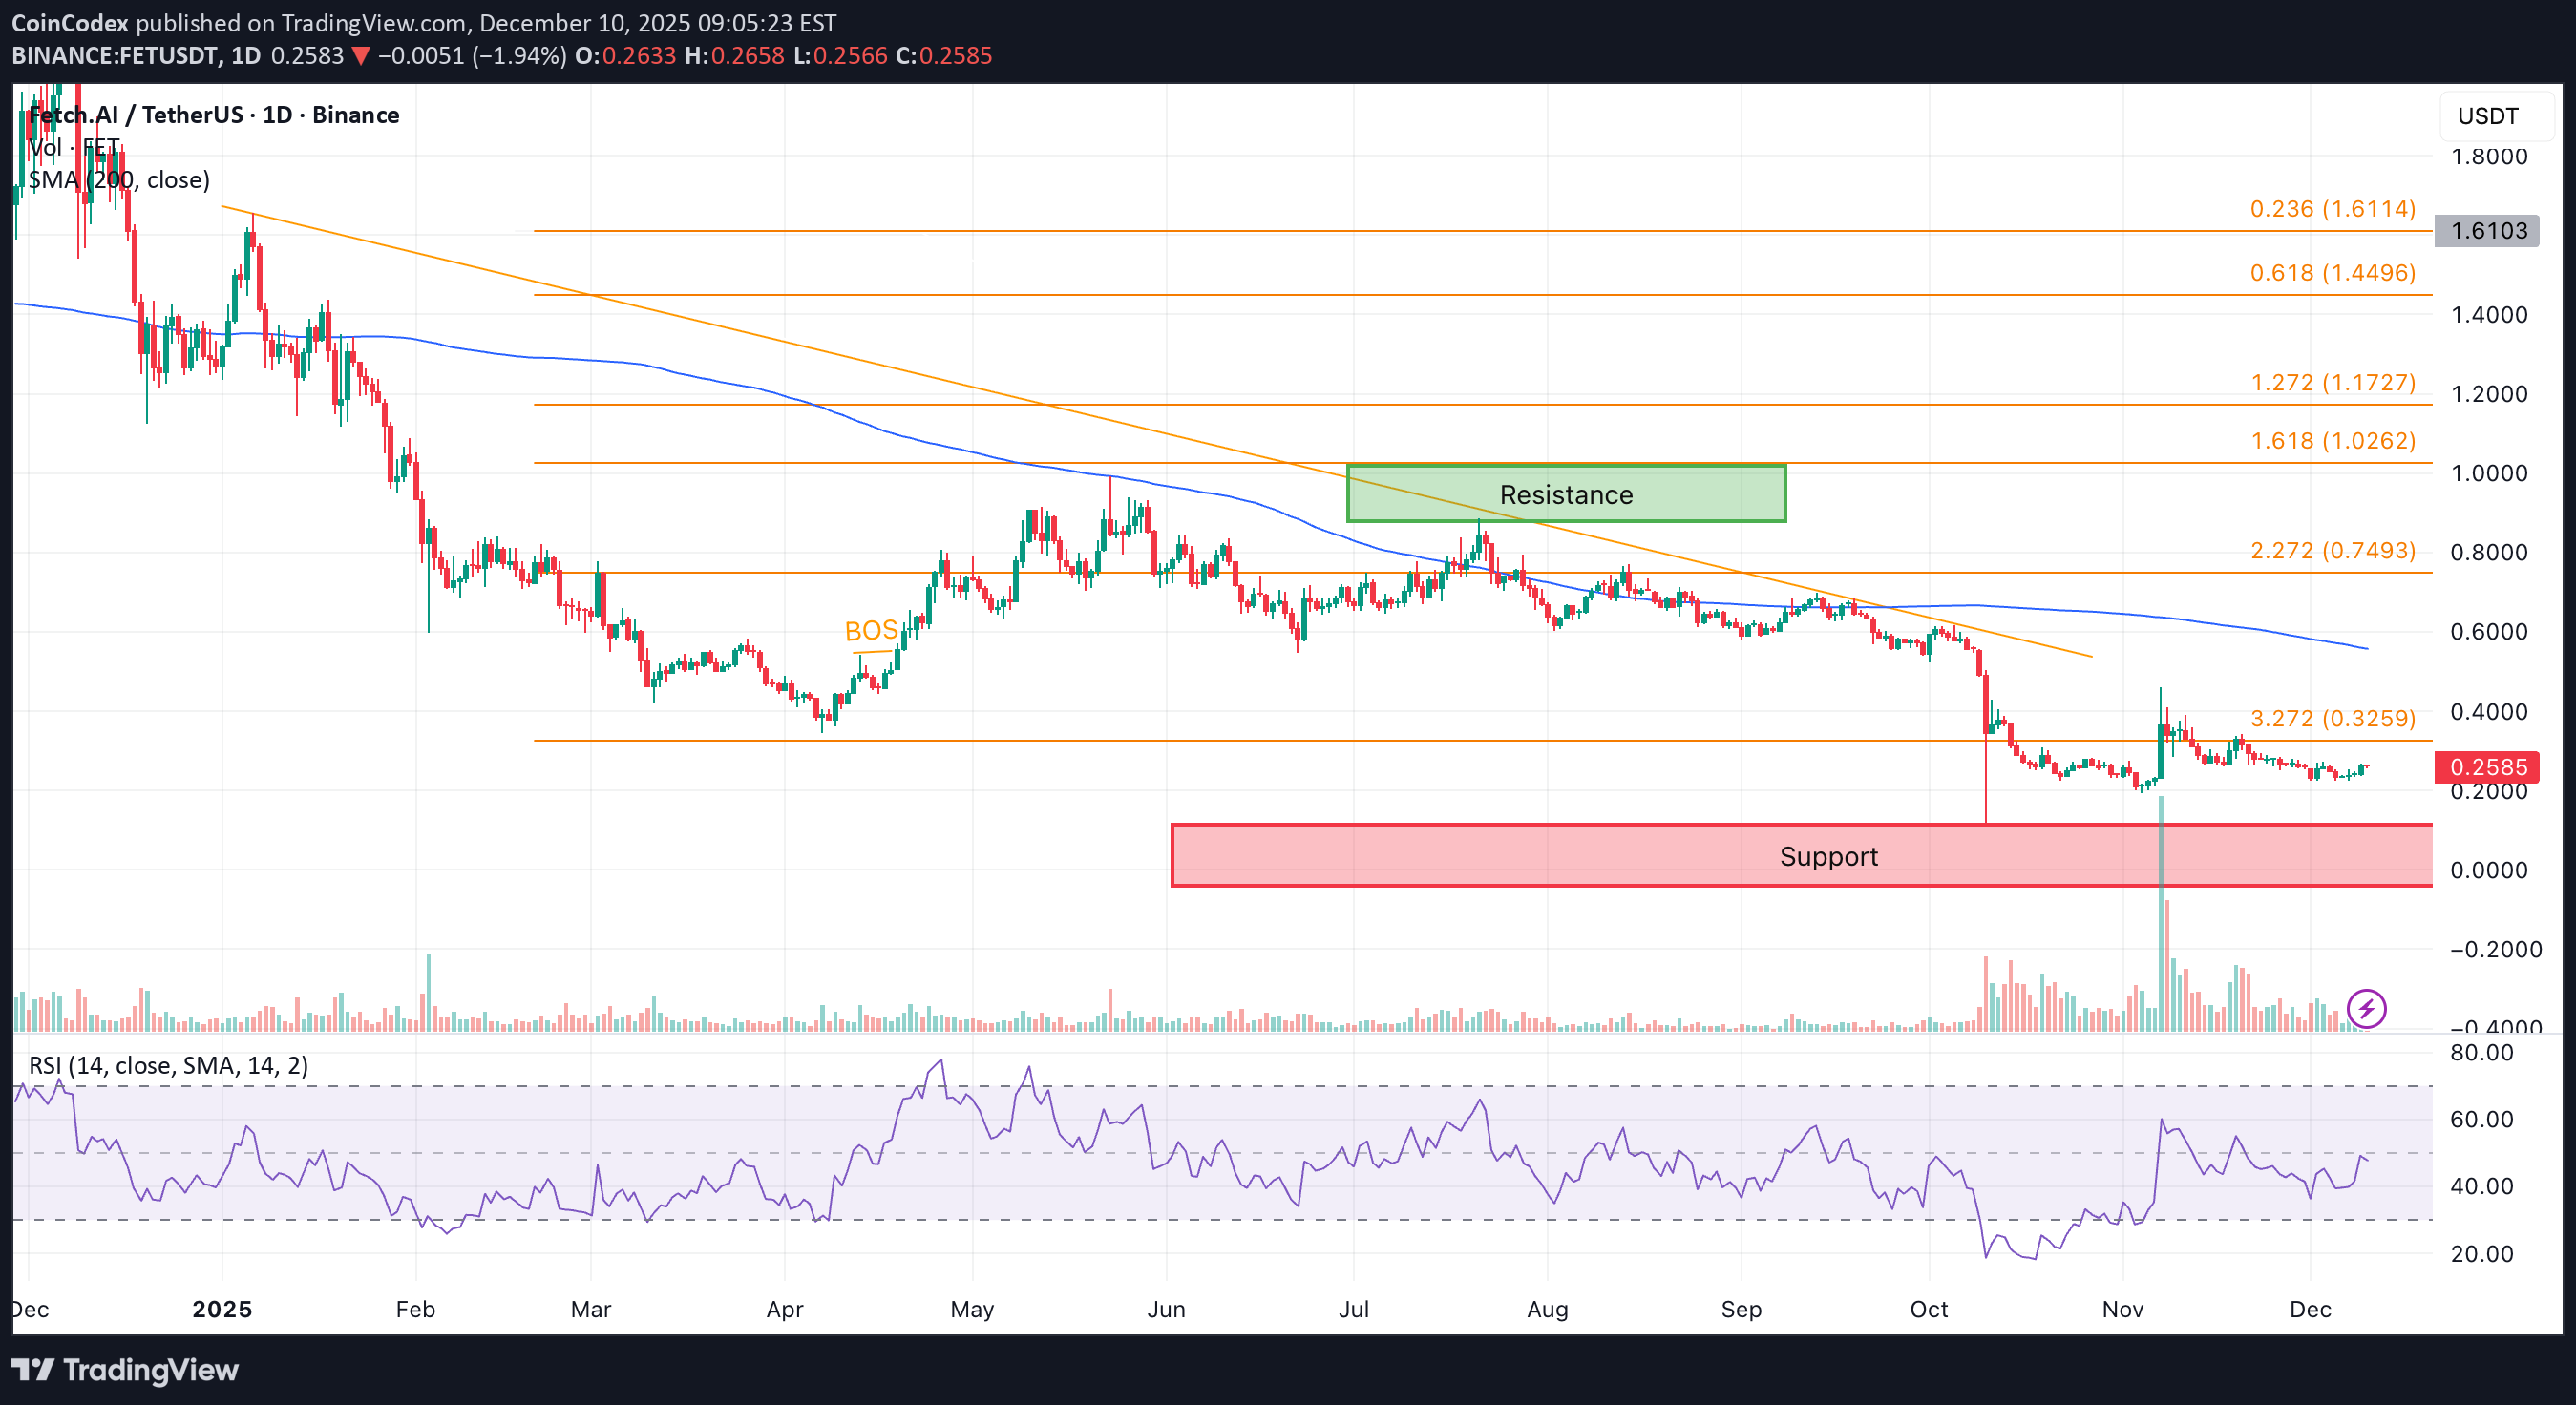
* قیمت FET در نزدیکی منطقه حیاتی 0.28 تا 0.30 دلار در حال کاهش است و شکستن آن می تواند شتاب را به سمت خریداران متمایل کند. * روی زنجیره data فعالیت رو به رشد را نشان میدهد، که نشان میدهد حتی زمانی که قیمت در محدوده محدود باقی میماند، علاقه دوباره در حال افزایش است. * پس از یک دوره صعود از پایین ترین سطح خود، نمودار FET برای اولین بار در یک دوره بسیار طولانی، موقعیت بهتری به نظر می رسد. هنگامی که به اقدامات اخیر قیمت FET نگاه می کنید، کاملاً واضح است که بازار ماه ها را در یک محدوده کند و آسیاب گیر کرده است. برای مدت طولانی، توکن در حدود 0.20 تا 0.22 دلار ثابت ماند تا در نهایت به منطقه 0.24 تا 0.26 دلار برسد. همه اینها درست در زیر یک خط روند نزولی سرسخت اتفاق افتاده است که امسال همه تلاشهای شکست را متوقف کرده است. با این حال، طی دو هفته گذشته، همه چیز شروع به تغییر کرده است. خریداران در هر شیب وارد عمل شدند، RSI به بالای 50 برگشت و شمعها به گونهای شروع به سفت شدن کردند که معمولاً به بازگشت قدرت اشاره دارد. می بینید که بازار مانند گذشته فروش نمی کند و این به تنهایی این تست مقاومت را جالب تر می کند. اما نبرد واقعی هنوز در پیش است. FET قبلاً به این خط روند برخورد کرده است و شکست خورده است، و هر رد قیمت را مستقیماً به محدوده پایینتر خود بازگرداند. به همین دلیل است که معامله گران اکنون توجه بیشتری دارند، اگر قیمت FET در نهایت بتواند از منطقه 0.28 تا 0.30 دلار عبور کند، این اولین نشانه محکمی است که روند نزولی در حال از دست دادن کنترل خود است. شکست تایید شده به قیمت FET فضای واقعی برای move می دهد. مقاومت زیادی بین 0.30 دلار و منطقه 0.40 تا 0.44 دلار که WorldOfCharts برجسته کرده است وجود ندارد، و data روی زنجیره موافق است. ارزش بازار دوباره در حال افزایش است، آدرسهای فعال در حال بهبود هستند، و فعالیت انتقال افزایش یافته است، که معمولاً نشانهای از این است که انباشت بیصدا در پسزمینه اتفاق میافتد. اگر FET در اینجا شکست بخورد، همه چیز کمی هیجان انگیزتر می شود. قیمت FET ممکن است به 0.24 تا 0.25 دلار برگردد و هر آزمایش اضافی در طول زمان این پشتیبانی را ضعیف می کند. این باعث می شود FET در همان ساختار جانبی که در بیشتر سال 2025 در آن گیر افتاده است، گیر کند. بنابراین FET از اینجا چقدر می تواند بالا رود؟ در حال حاضر، همه چیز به این بستگی دارد که آیا این شکست در نهایت باقی می ماند یا خیر. این ساختار نسبت به ماههای گذشته بهتر به نظر میرسد، اما تا زمانی که خط روند به پشتیبانی تبدیل نشود، هنوز هم فقط بالقوه است. پیشبینی سه ماهه CoinCodex FET را نزدیک به 0.4468 دلار قرار میدهد، اما این تنها زمانی واقع بینانه میشود که قیمت واقعاً به بالای 0.30 دلار برسد و در آنجا بماند. برای جزئیات کامل و نمای فنی، می توانید مقاله را با تجزیه و تحلیل کامل در CoinCodex بررسی کنید: coincodex.com/article/78306/fetch-ai-fet-price-analysis-analyst-makes-ford-prediction/
Infamousmoneot
تحلیل صعودی FET: آیا هدف ۱ دلار در دسترس است؟
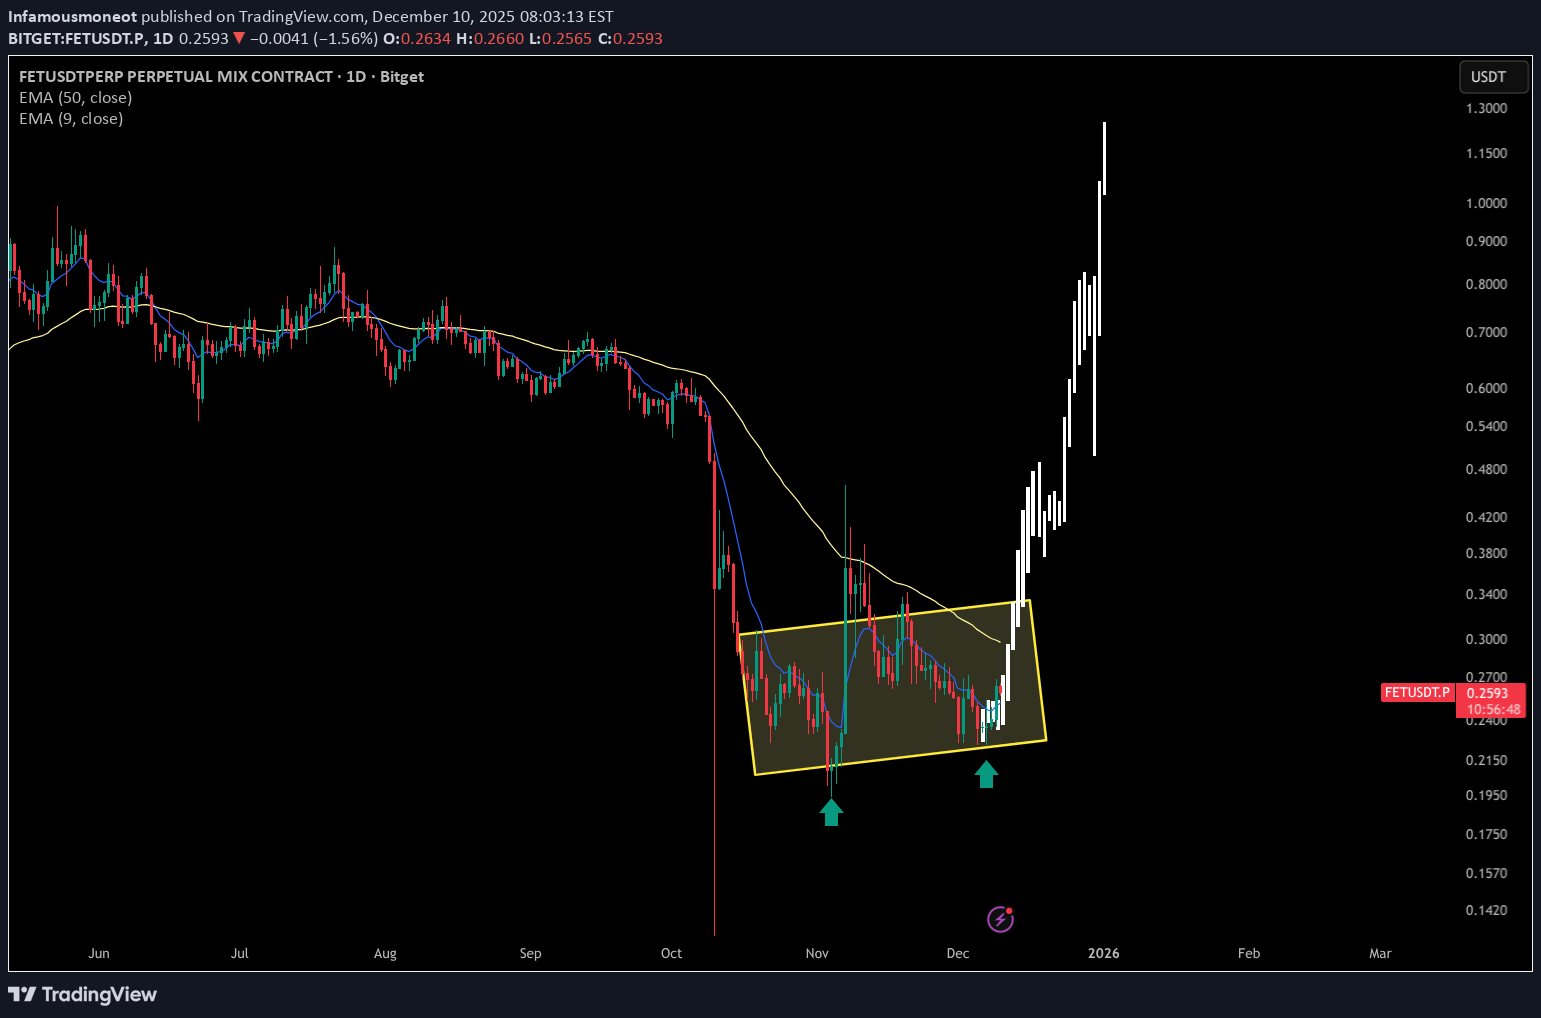
هی معامله گران، امروز حالم خوب است و دومین تحلیل روز را برایتان میآورم. آخرین باری که در موردش صحبت کردم FET ، من اشتباه کردم و قیمت به شدت کاهش یافت. این بار، با پشتوانه تحلیل قبلی من در مورد تسلط Ethereum، معتقدم Fetch می تواند در ماه های آینده عملکرد بسیار خوبی داشته باشد. با پشت سر گذاشتن مسائل حقوقی پروتکل Ocean، به نظر می رسد این پروژه در شرف احیای مجدد است. طی چند هفته گذشته به پایینترین سطح خود رسیده است و من متوجه تجمع بسیار جالبی در زنجیره شدهام. به همین دلیل، من فکر می کنم که ممکن است در چند ماه آینده وارد یک تجمع کوچک شود: هدف اول → 0.50 دلار هدف دوم → 0.80 دلار هدف سوم → 1.00 دلار همانطور که همیشه می گویم - باهوش بمان و آرام بمان! ------ Esto para los que habláis Español. او یک وب را ایجاد کرد و در آن تجارت آزاد را به صورت رایگان انجام داد - > https://latortugadeltrading.myshopify.com/
CryptoAnalystSignal
#FET/USDT bullish momentum
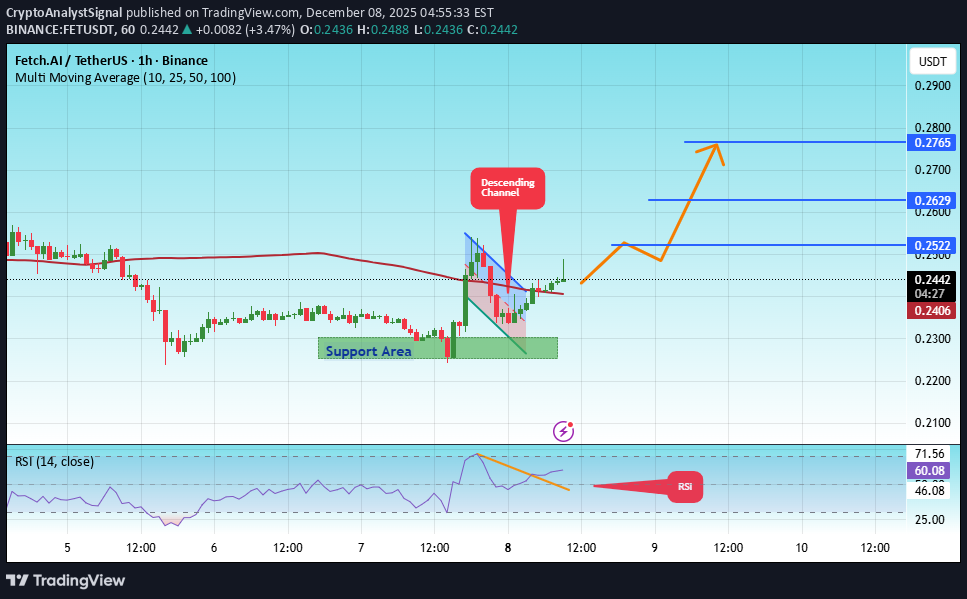
#FET قیمت در یک کانال نزولی در بازه زمانی 1 ساعته در حال حرکت است. به مرز پایینی رسیده است و در حال حرکت به سمت شکستن بالای آن است و انتظار میرود که مرز بالایی آزمایش مجدد شود. ما یک روند نزولی در اندیکاتور RSI داریم که نزدیک به مرز پایینی رسیده است و انتظار می رود یک بازگشت صعودی داشته باشد. یک منطقه حمایت کلیدی به رنگ سبز در 0.2280 وجود دارد. قیمت چندین بار از این سطح جهش کرده است و انتظار می رود دوباره افزایش یابد. ما یک روند به سمت تثبیت بالاتر از میانگین متحرک 100 دوره ای داریم، زیرا به آن نزدیک می شویم، که از movement صعودی پشتیبانی می کند. قیمت ورودی: 0.2440 هدف اول: 0.2522 هدف دوم: 0.2630 هدف سوم: 0.2765 یک اصل ساده را فراموش نکنید: مدیریت پول. سفارش توقف ضرر خود را در زیر ناحیه پشتیبانی به رنگ سبز قرار دهید. برای هر گونه سوال لطفا نظر بدهید. متشکرم.
SaykoCrypto
تحلیل جدید FET/USDT: اهداف صعودی جدید پس از شکست الگوی کنج!
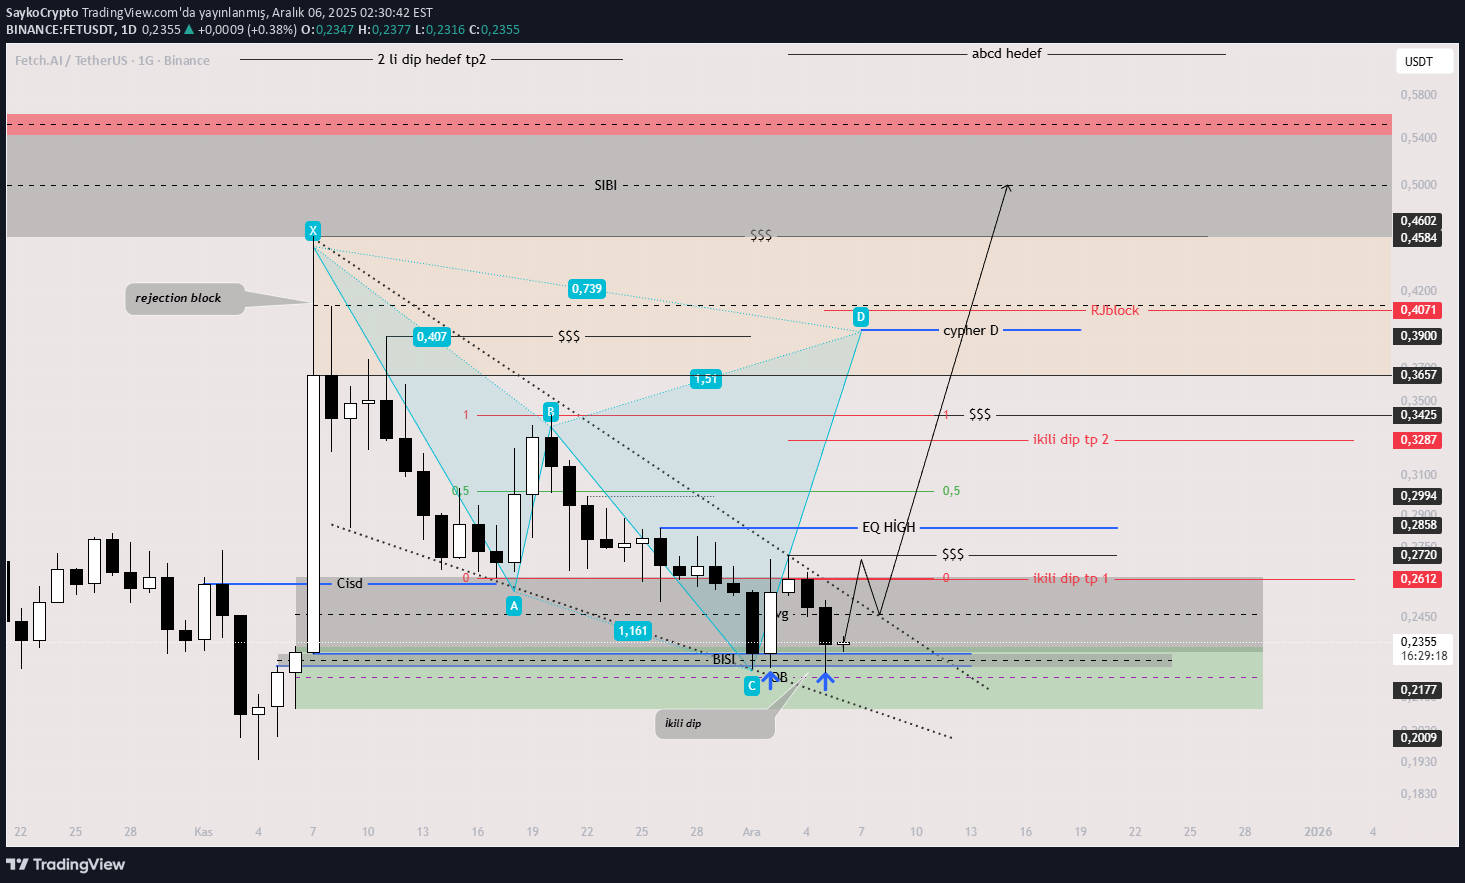
من بهروزرسانیهایی را در نمودار انجام دادم و اهداف دو کفی مطابق با آخرین حرکات قیمت تغییر کردهاند. معامله با شکست گوه و تست مجدد را می توان در نظر گرفت. من اهداف و مناطق مایع را در نمودار نشان داده ام. نمودار برای اهداف ردیابی است. این شامل توصیه های سرمایه گذاری نیست. من فکر می کنم که بسته شدن روزانه بالای 0.2612 به قیمت شتاب صعودی می دهد. سود فراوان. اهداف WEDGE عبارتند از TP1: 0.3657 TP2: 0.5311. هدف TP 1 دو ته گرفته شده است و شکستن گوه فرا رسیده است. موفق باشید

CryptoNuclear
منطقه سرنوشتساز FET/USDT: آیا قیمت در محدوده ۰.۱۴ تا ۰.۲۱ نگه میدارد یا سقوط میکند؟
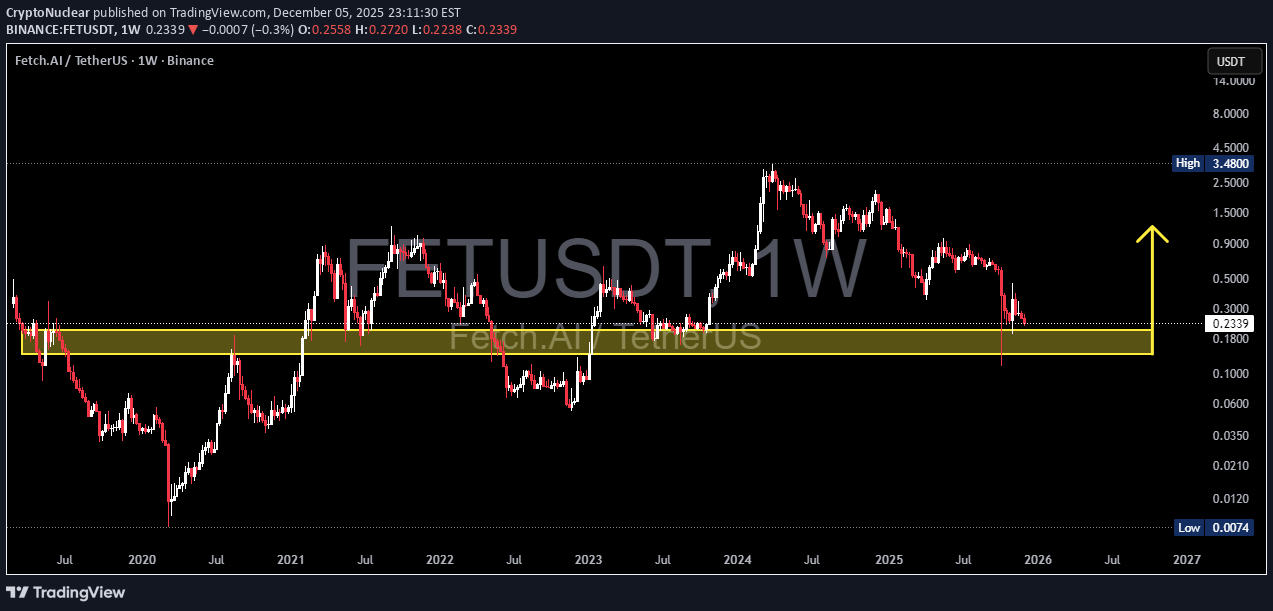
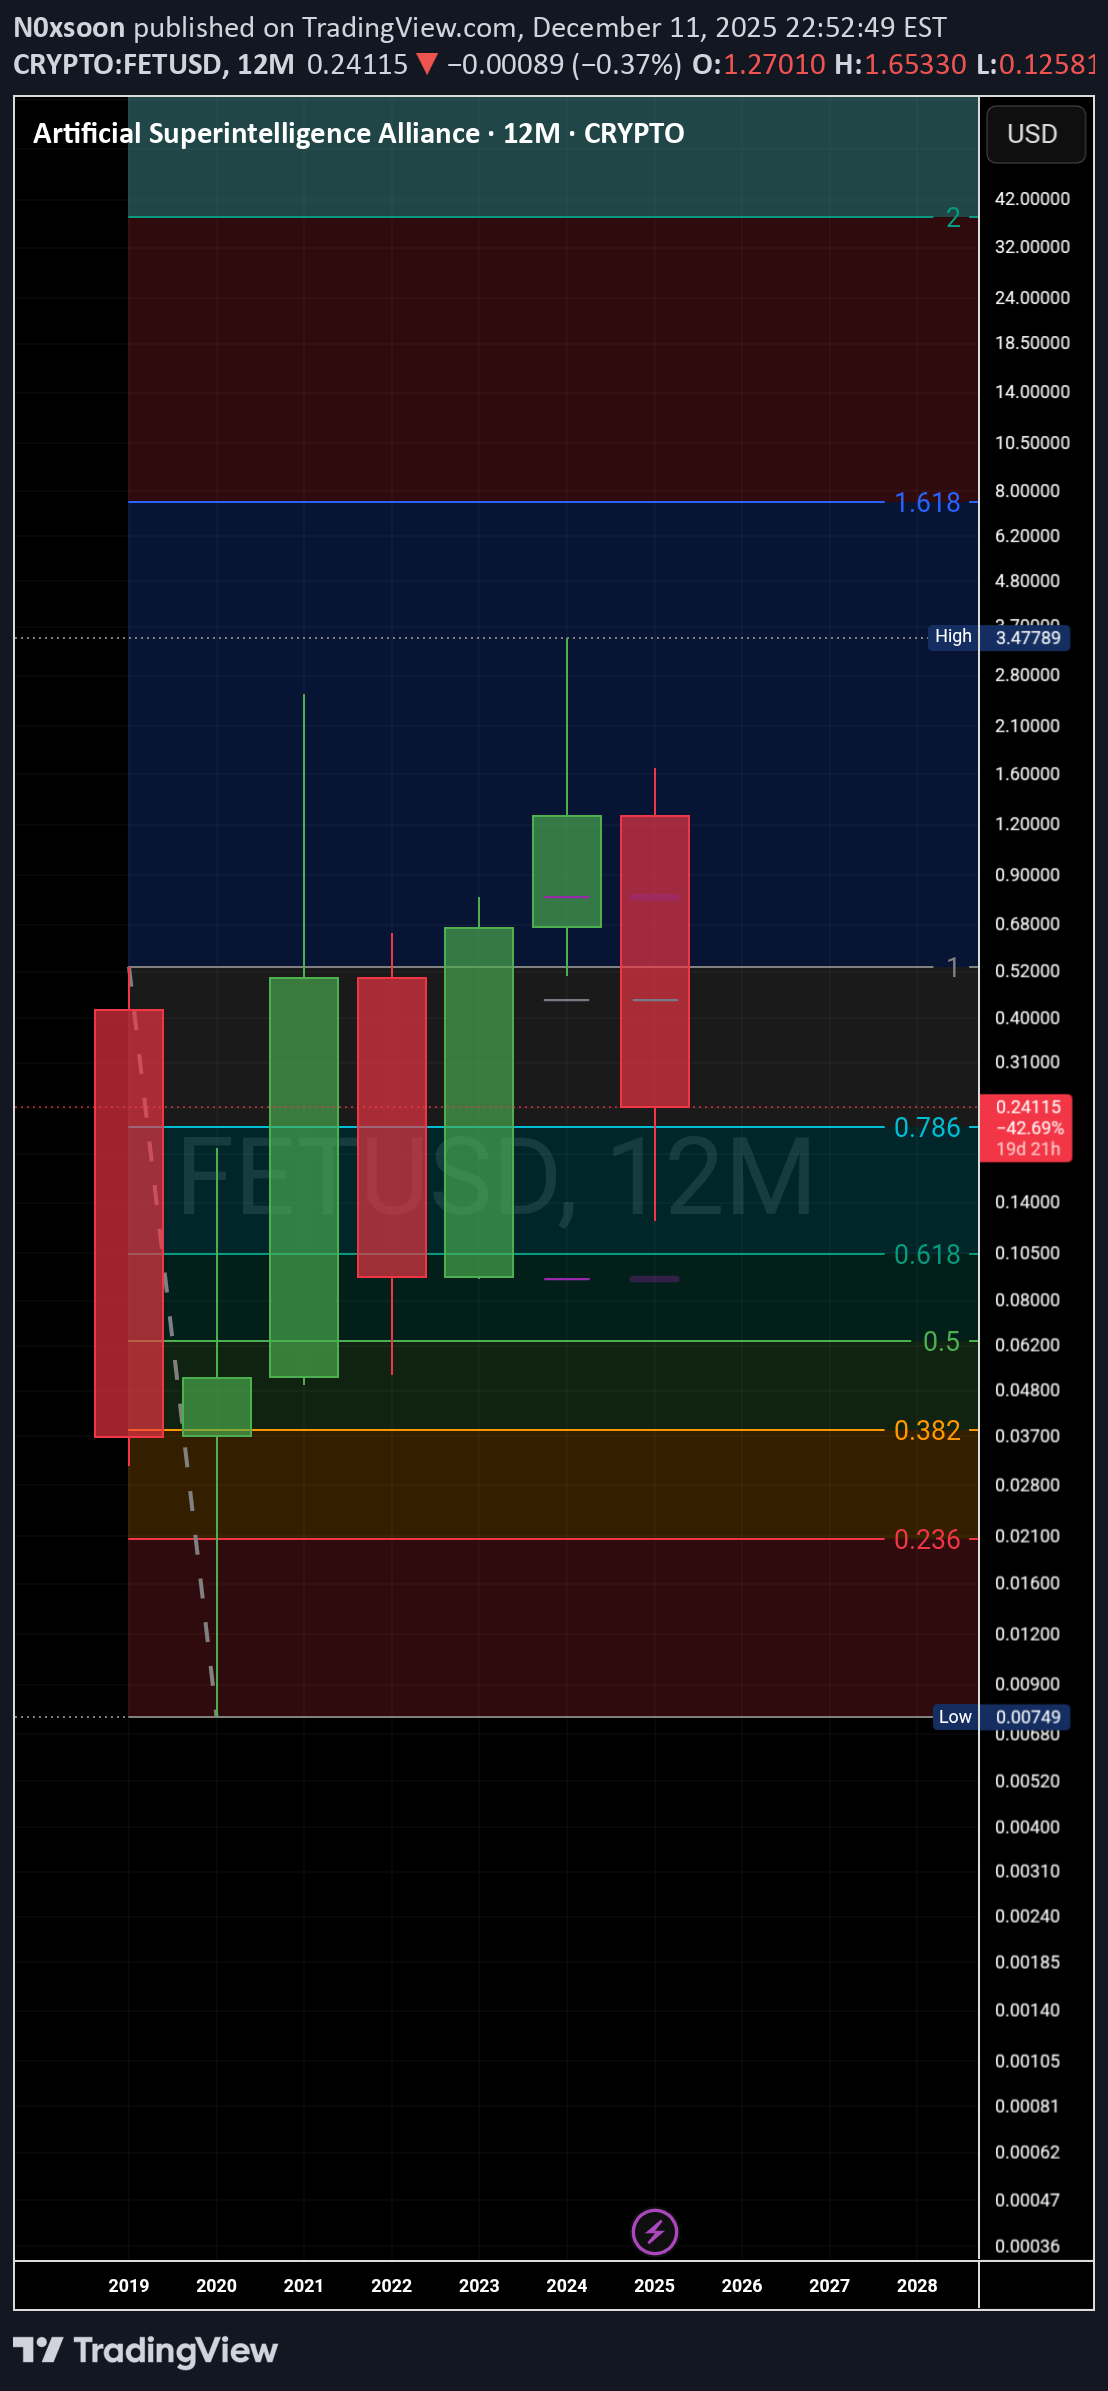
نمودار هفتگی جفت ارز FET/USDT در حال بازگشت به یکی از مهمترین نواحی تاریخی در کل سابقه قیمتی خود است — یعنی بلوک تقاضای (Demand Block) ۰.۲۱ تا ۰.۱۴. این ناحیه فقط یک سطح حمایتی نیست. از سال ۲۰۱۹، به طور مداوم به عنوان مرز بین فاز انباشت (Accumulation) و فاز تسلیم (Capitulation) عمل کرده است. هر حرکت صعودی اصلی تنها پس از دفاع موفقیتآمیز از این ناحیه آغاز شده است. و اکنون، قیمت یک بار دیگر به این ناحیه بازگشته است؛ که این نقطه را به یک محل تصمیمگیری حیاتی برای روند کلان (ماکرو) بعدی تبدیل میکند. --- چرا این ناحیه اهمیت دارد؟ محدوده ۰.۲۱ تا ۰.۱۴ به عنوان پایه ساختاری برای رالیهای قدرتمند ۲۰۲۰، ۲۰۲۱ و جهش ناشی از هیجانات هوش مصنوعی در ۲۰۲۴ عمل کرده است. سایه تند نزولی (ویک) زیر این ناحیه، که با یک بازگشت سریع همراه شد، نشاندهنده جمعآوری نقدینگی (Liquidity Grab) است، که تلویحاً میگوید بازیگران بزرگ ممکن است هنوز در حال انباشت در اینجا باشند. عملکرد قیمت در حال شکلدهی به یک الگوی فشردهسازی (Compression Pattern) است؛ ساختاری که معمولاً پیش از شکستهای انفجاری (چه به بالا و چه به پایین) رخ میدهد. این نقطهای است که بازار به ندرت برای مدت طولانی در آن آرام میماند. --- ساختار فنی و الگو قیمت از زمان اوج ۲۰۲۴ سقفهای پایینتر (Lower Highs) را تشکیل داده است ← روند نزولی میانمدت همچنان پابرجاست. اما واکنشهای قیمت درون محدوده ۰.۲۱–۰.۱۴ همچنان قوی است و نشاندهنده الگوی انباشت مجدد (Reaccumulation) در مراحل اولیه است. جمعآوری نقدینگی با سایه (Wick Sweep) زیر ناحیه، شبیه به یک پتانسیل Wyckoff Spring است که هنوز تایید نشده، اما به وضوح قابل مشاهده است. به زبان ساده: اگر این ناحیه حفظ شود، یک بازگشت بلندمدت میتواند آغاز شود. اگر شکست بخورد، نمودار راه را برای یک حرکت نزولی (Bearish Leg) جدید باز میکند. --- سناریوی صعودی 🔵 ۱. حفظ تقاضا: «تسلط خریداران» اگر کندل هفتگی بالاتر از ۰.۲۱–۰.۱۸ بسته شود، نشان میدهد که خریداران هنوز از این بلوک تقاضای تاریخی دفاع میکنند. تایید قویتر زمانی حاصل میشود که قیمت سطح ۰.۳۰، نزدیکترین مقاومت ساختاری، را پس بگیرد (Reclaim کند). ⬅️ اهداف صعودی: ۰.۳۰ ← تأیید کوتاهمدت ۰.۵۰ – ۰.۶۰ ← مقاومت میانمحدوده ۰.۹۰ – ۱.۵۰ ← ناحیه بازیابی اصلی ۲.۵۰ – ۳.۴۰ ← بازگشت کامل چرخه اگر روایت هوش مصنوعی دوباره شعلهور شود. این امر، ناحیه ۰.۲۱–۰.۱۴ را به عنوان پایگاه انباشت مجدد کلان (Macro Reaccumulation Base) پیش از فاز گسترش بعدی، تثبیت کرد. --- سناریوی نزولی 🔴 ۱. شکست واضح (Clean Breakdown): «ناکامی تقاضا» بسته شدن هفتگی زیر ۰.۱۴، کل ساختار چند ساله را باطل کرد. در صورت وقوع: بلوک تقاضا فرو میپاشد، تداوم نزولی بسیار محتمل میشود، و نمودار وارد یک محدوده کلان عمیقتر میشود. ⬅️ اهداف نزولی: ۰.۱۰ – ۰.۰۷ ← ناحیه نقدینگی تاریخی از ۲۰۱۹–۲۰۲۰ اگر شتاب افزایش یابد، نزول بیشتر ممکن شد شکست زیر ۰.۱۴، FET را وارد یک ساختار بازاری کاملاً جدید کرد. --- بینش کلیدی FET در حال حاضر بر روی ناحیهای قرار گرفته است که هر تغییر روند اصلی را طی ۵ سال گذشته تعیین کرده است. بستههای هفتگی بعدی تعیین کرد که آیا وارد: فاز B انباشت (Phase B Accumulation) میشویم ← رالی کلان جدید، یا وارد شکست ساختاری (Structural Breakdown) میشویم ← تداوم نزولی چند ماهه. این آرامش پیش از یک نوسان بزرگ است — و ناحیه ۰.۲۱–۰.۱۴ همچنان میدان نبرد باقی میماند. --- #FETUSDT #FetchAI #CryptoAnalysis #KeyLevel #DecisionPoint #WeeklyChart #CryptoTA #SupportZone #Wyckoff #SmartMoneyConcepts #AINarrative

weslad
سقوط قریبالوقوع فِت (FET)؟ تحلیل کلیدی قیمت و نقطه برگشت احتمالی
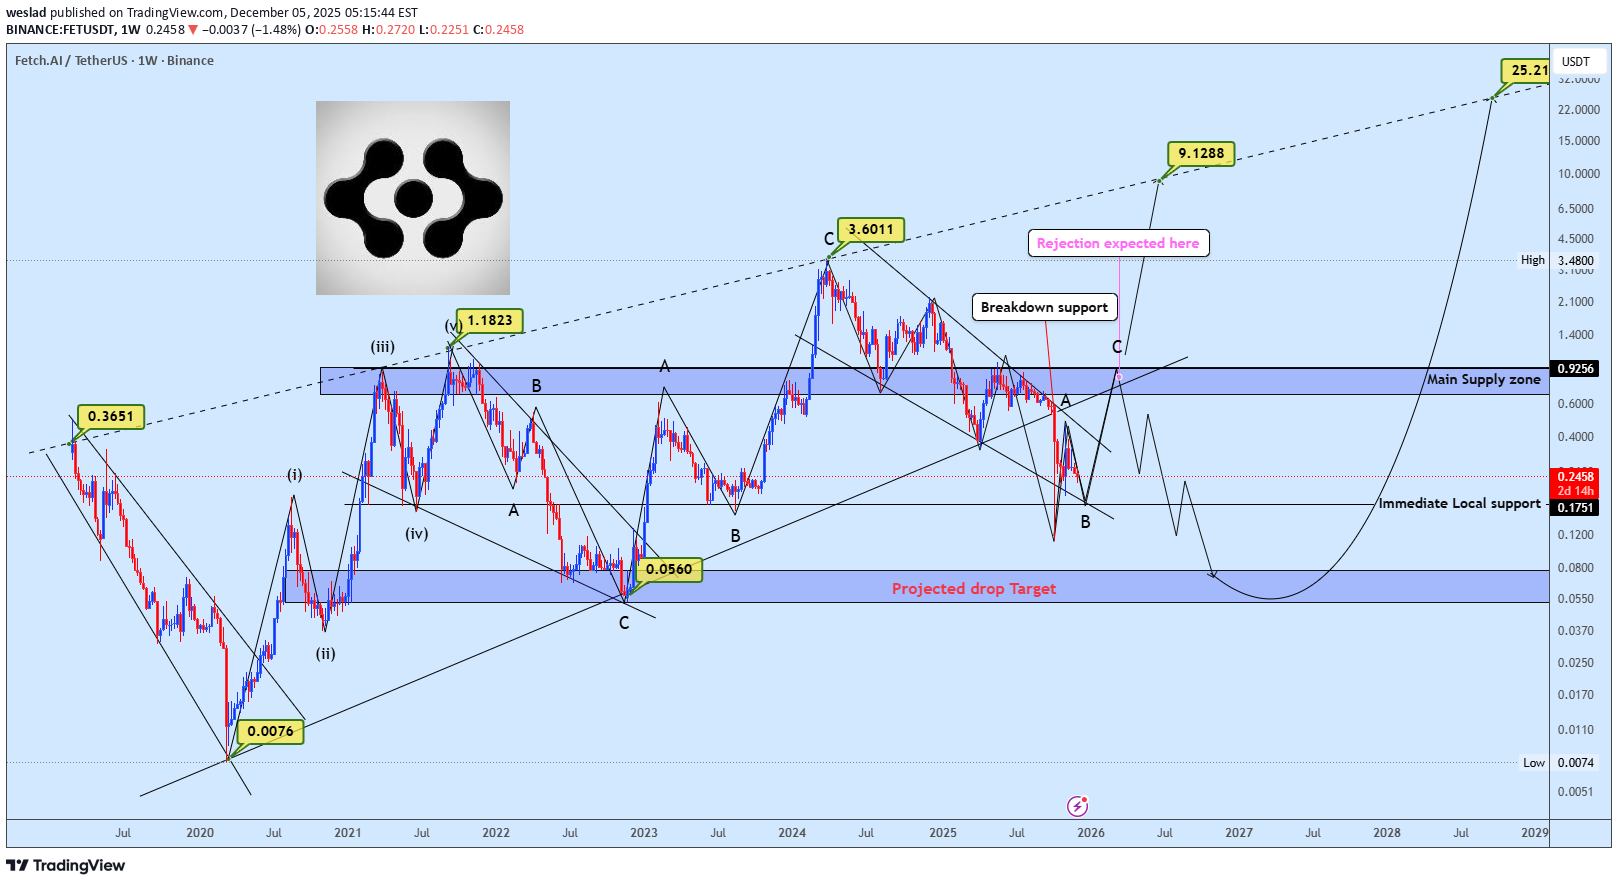
زوج FETUSDT الگوی کلاسیک گوه صعودی توزیعی را تکمیل کرده است، که منجر به یک شکست نزولی واضح به سمت محدوده ۰.۵۳ دلار شد و ساختار کوتاهمدت را از شتاب ناشی از تقاضا به فاز اصلاحی <۰> تغییر داد. قیمت اکنون زیر ناحیه حمایت <۱> معامله میشود که پیشتر به عنوان تقاضا عمل میکرد و اکنون آن را به یک منطقه عرضه فعال تبدیل کرده است. ساختار کنونی، برنامهریزی برای پولبک را ترجیح میدهد؛ هر رالی تسکیندهندهای که به منطقه عرضه بازگردد، ناحیهای ایدهآل برای نظارت بر ریجکشن (رد شدن قیمت) و ادامه موج اصلاحی بود. با این حال، یک شکست قاطع و تثبیت بالای ناحیه عرضه، فرضیه نزولی فوری را لغو کرده و مسیر را برای ادامه روند صعودی باز کرد، به طوری که بازار تلاش میکند طبق آنچه به وضوح در نمودار مشخص شده است، روند خود را از سر بگیرد.
تحلیل تکنیکال FET/USDT: آیا افزایش قیمت کوتاهمدت به ریزش بزرگ ختم میشود؟
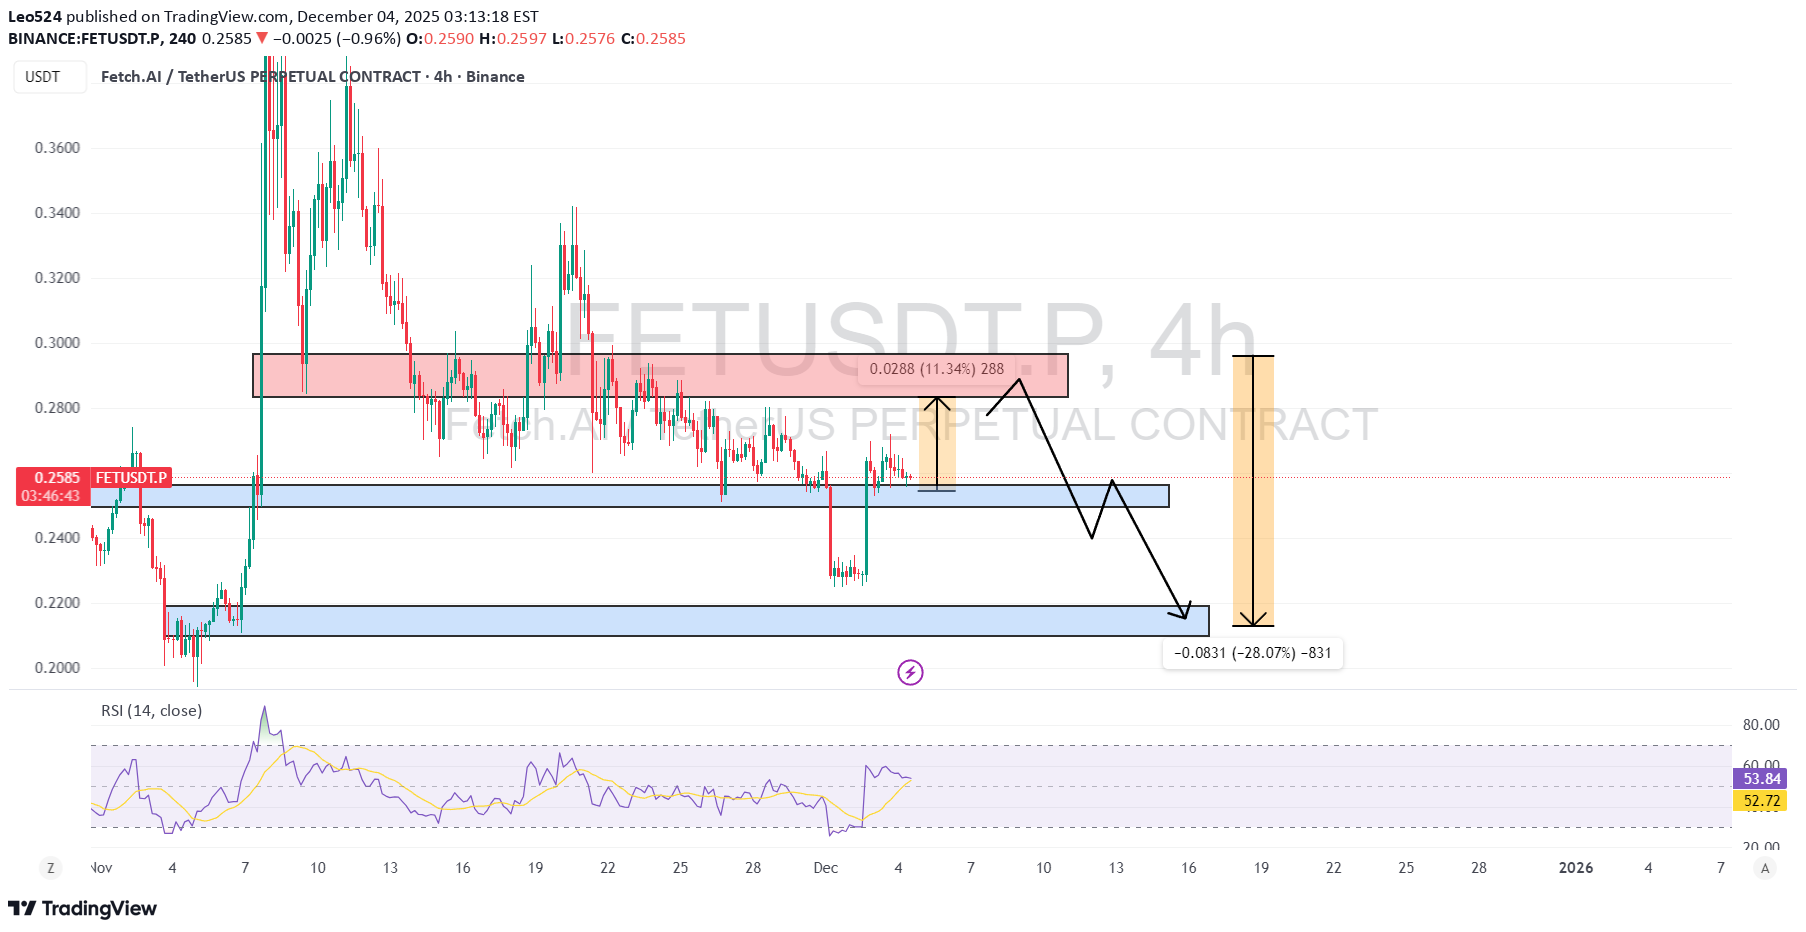
تتر (USDT) در حال حاضر شاهد یک افزایش قیمت کوتاه مدت است. ممکن است این روند از سطح مقاومت قوی در بالا، دوباره نزولی (BEARISH) شود. مراقب آن محدوده قیمتی باشید.

Bithereum_io
آیا FET به زودی این سقف مقاومتی را میشکند؟ اهداف بزرگ بعدی مشخص شدند!
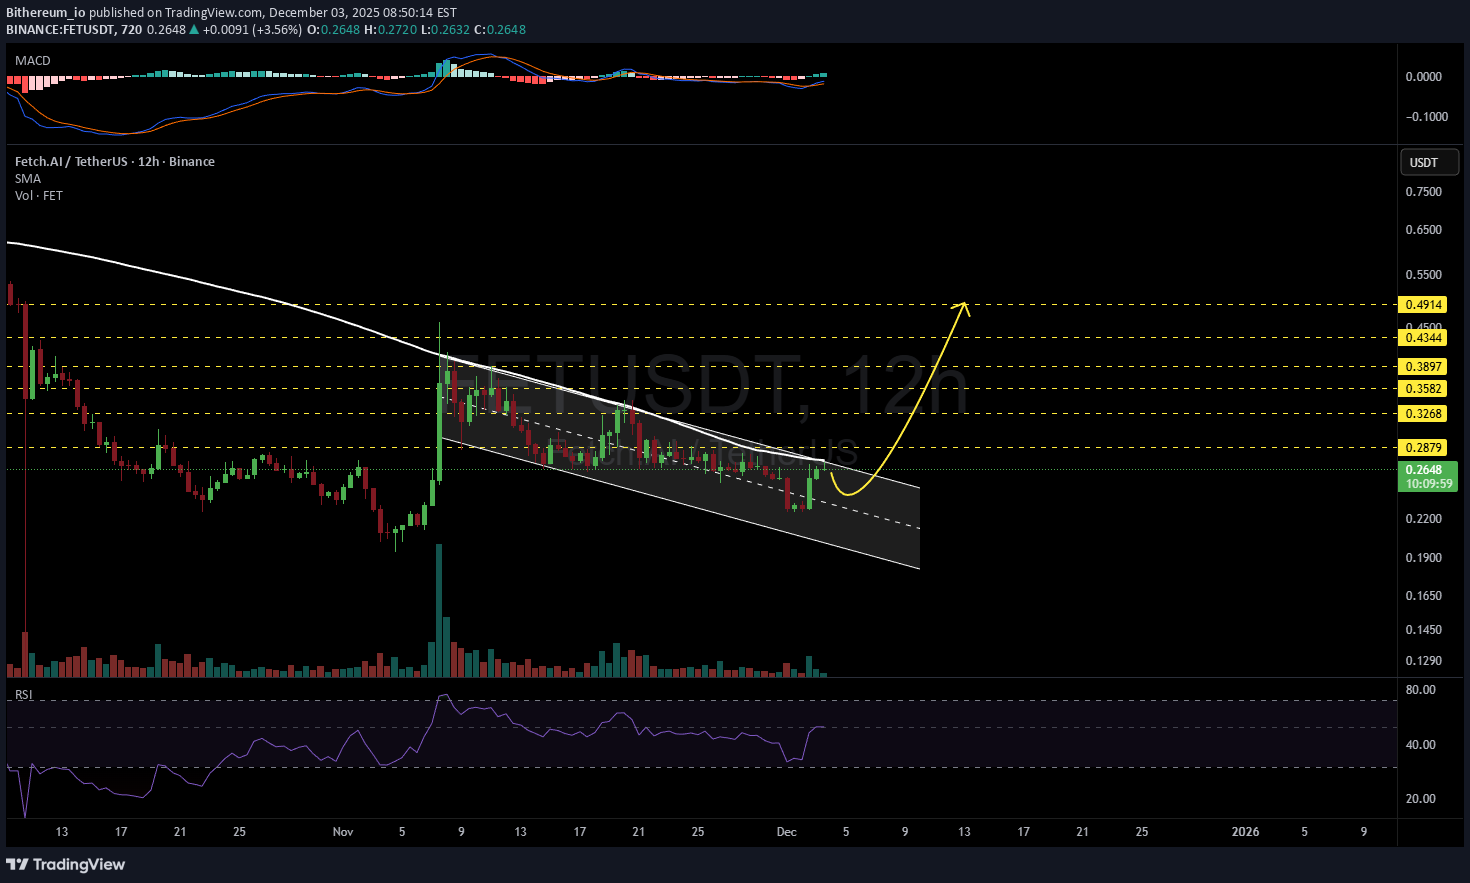
#FET در تایم فریم ۱۲ ساعته، درون یک پرچم صعودی در حال حرکت است. این جفت ارز/دارایی در حال حاضر با مقاومت پرچم و همچنین میانگین متحرک ساده ۱۰۰ دورهای (SMA100) در تایم ۱۲ ساعته روبرو است. در صورت وقوع شکست موفقیتآمیز در بالای پرچم، تارگتهای بالقوه عبارتند از: 🎯 $0.2879 🎯 $0.3268 🎯 $0.3582 🎯 $0.3897 🎯 $0.4344 🎯 $0.4914 ❌ ابطال سناریو: بسته شدن یک کندل ۱۲ ساعته در زیر خط حمایت پرچم. ⚠️ همیشه به خاطر داشته باشید که از حد ضرر (استاپ لاس) محکم استفاده کرده و مدیریت ریسک مناسب را حفظ کنید.
سلب مسئولیت
هر محتوا و مطالب مندرج در سایت و کانالهای رسمی ارتباطی سهمتو، جمعبندی نظرات و تحلیلهای شخصی و غیر تعهد آور بوده و هیچگونه توصیهای مبنی بر خرید، فروش، ورود و یا خروج از بازارهای مالی نمی باشد. همچنین کلیه اخبار و تحلیلهای مندرج در سایت و کانالها، صرفا بازنشر اطلاعات از منابع رسمی و غیر رسمی داخلی و خارجی است و بدیهی است استفاده کنندگان محتوای مذکور، مسئول پیگیری و حصول اطمینان از اصالت و درستی مطالب هستند. از این رو ضمن سلب مسئولیت اعلام میدارد مسئولیت هرنوع تصمیم گیری و اقدام و سود و زیان احتمالی در بازار سرمایه و ارز دیجیتال، با شخص معامله گر است.