ActivTrades
@t_ActivTrades

What symbols does the trader recommend buying?
Purchase History
پیام های تریدر
Filter
ActivTrades
بیت کوین زیر ۹۰ هزار دلار سقوط کرد: زنگ خطر در بازار به صدا درآمد!
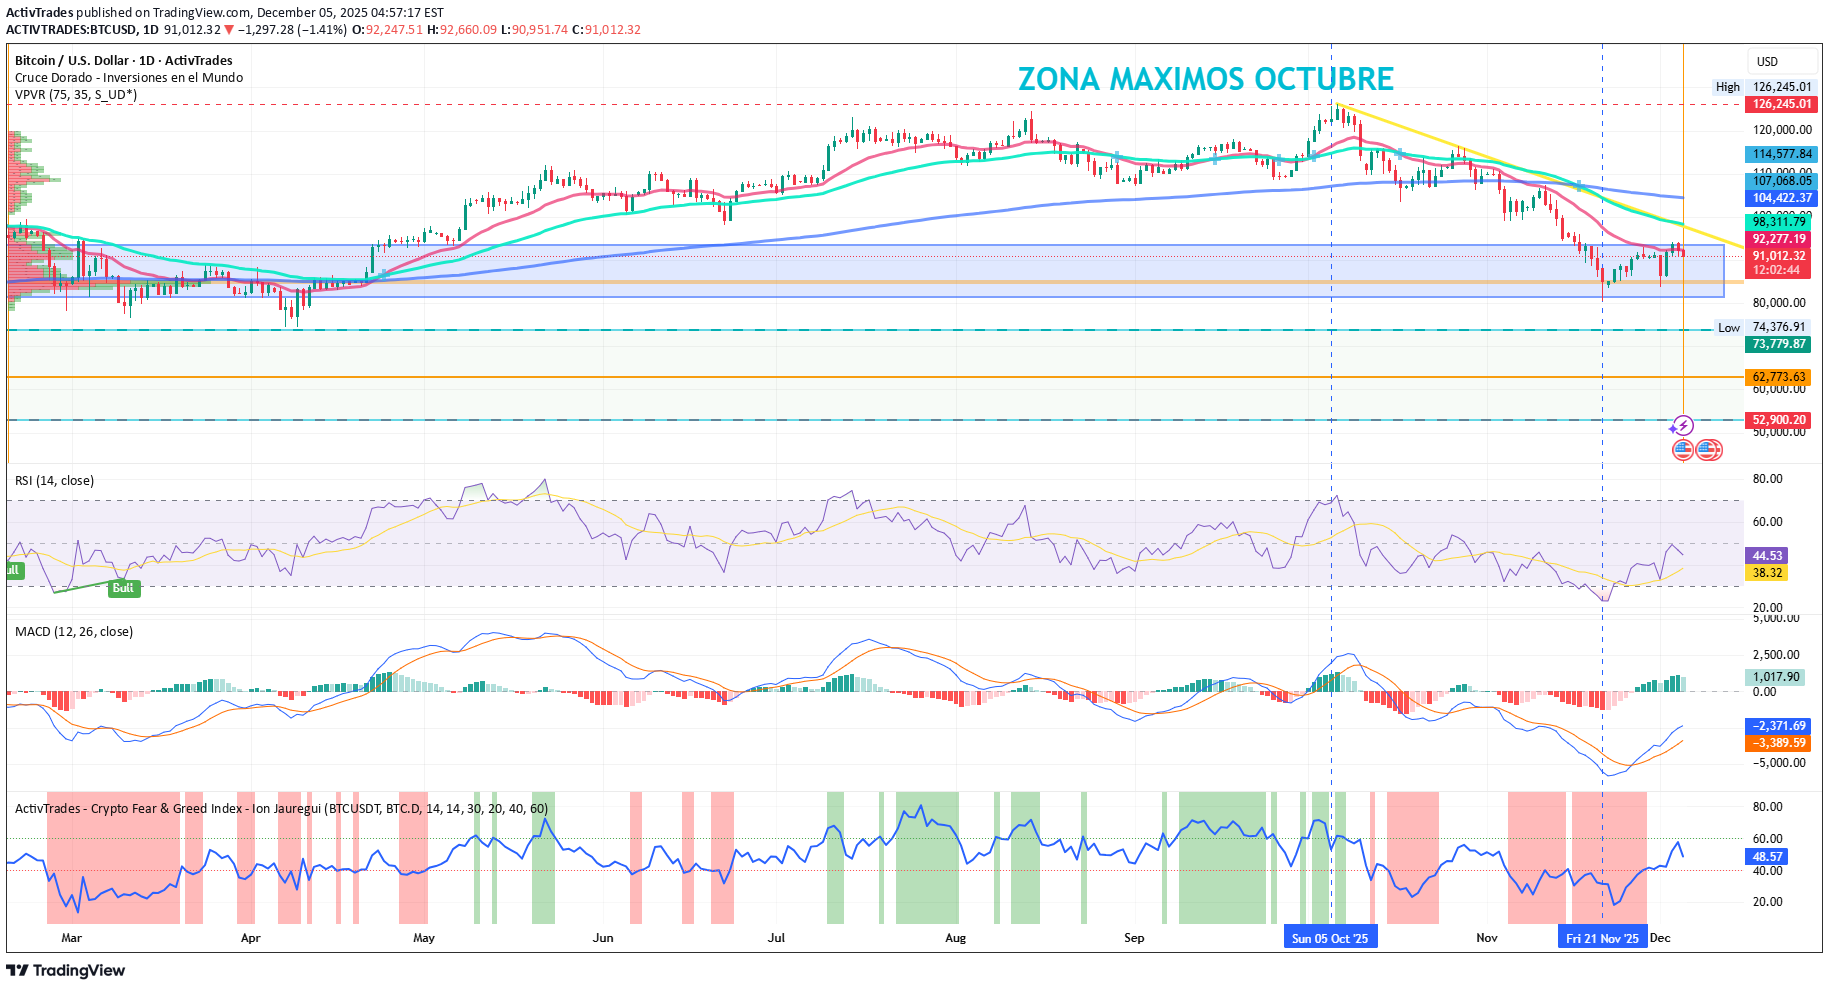
By Ion Jauregui – Analyst at ActivTrades Bitcoin (BTCUSD) is going through a key historical moment. After weeks of rallies to all-time highs at USD 126,245.01 in October 2025, we have experienced a series of declines that reached a low on November 21, returning to price zones from November 2024, coinciding with the last halving on 04/20/2024. After a couple of weeks of stability above USD 94,000, the cryptocurrency broke a key support and fell below USD 90,000, generating widespread concern in the market. The break has marked both a technical and fundamental breach that could define price evolution in the coming days. The current floor has expanded to USD 80,612.40, a price zone very close to the pre-impulse range. The USD 94,000 level had acted as a “natural floor” for Bitcoin. According to recent JPMorgan estimates, this amount coincides with the average production cost of the cryptocurrency, indicating that mining below this price is no longer profitable for many operators. In addition, companies such as Strategy, with more than 650,000 BTC in their treasury, play a decisive role. Their USD 1.44 billion cash reserve allows them to cover financial obligations without needing to sell their assets, providing a degree of market stability. A break of this support has reflected not only technical pressure but also an uncertain macroeconomic environment for Bitcoin, amid increasing risk and institutional investors seeking less volatile investment options. If the price reaches the previous range support above USD 73,779.87, we could see a period of gap closure. On the other hand, if the price holds, we might see a period of lateral consolidation. In the medium term, the outlook remains positive if institutional demand and stable macro conditions continue: Bitcoin could return to levels near this year’s highs in the next 6 to 12 months. However, any negative event could prolong the period of weakness. Technical analysis From a technical point of view, the break of USD 90,000 confirms a breach of the lateral range that had contained BTC in recent weeks: Supports and resistance: The USD 90,000–94,000 zone acted as a key reference. Its break opens space for a possible decline toward the 80,612.40–42,900.20 range, where historical retracements and demand levels coincide. Recovery levels: A rebound would face immediate resistance at USD 94,000 and then at USD 97,000–98,000. Surpassing these levels could temporarily stabilize the market. Volatility and consolidation: The increase in volume indicates nervousness and position adjustments. Traders should watch intraday movements and key candle formations to detect potential rebound signals. RSI is currently in a neutral search zone at 45.21%, and MACD is in negative territory, confirming this recovery theory. If we look at the ActivTrades – Crypto Fear & Greed indicator, the movement is currently neutral and has not favored Altcoins. During the declines, a high Risk-Off was detected, but at this moment balance is perceived. The Whales Bitcoin’s drop below USD 90,000 combines fundamental and technical factors: miner pressure, influence of large holders, and macroeconomic uncertainty. In this period of high volatility, only prudence can be maintained by closely monitoring institutional supply and mining activity. This phase may represent a temporary pullback, but it also represents a strategic accumulation opportunity in the medium term for “Crypto Holders.” It can also be a potential entry zone for institutional investors looking for discounted prices to enter ETFs managed by large asset managers. ******************************************************************************************* The information provided does not constitute investment research. The material has not been prepared in accordance with the legal requirements designed to promote the independence of investment research and such should be considered a marketing communication. All information has been prepared by ActivTrades ("AT"). The information does not contain a record of AT's prices, or an offer of or solicitation for a transaction in any financial instrument. No representation or warranty is given as to the accuracy or completeness of this information. Any material provided does not have regard to the specific investment objective and financial situation of any person who may receive it. Past performance and forecasting are not a synonym of a reliable indicator of future performance. AT provides an execution-only service. Consequently, any person acting on the information provided does so at their own risk. Political risk is unpredictable. Central bank actions can vary. Platform tools do not guarantee success.
ActivTrades
آیفون 17 رکورد فروش اپل را شکست: راز رشد 14 درصدی در 10 روز!
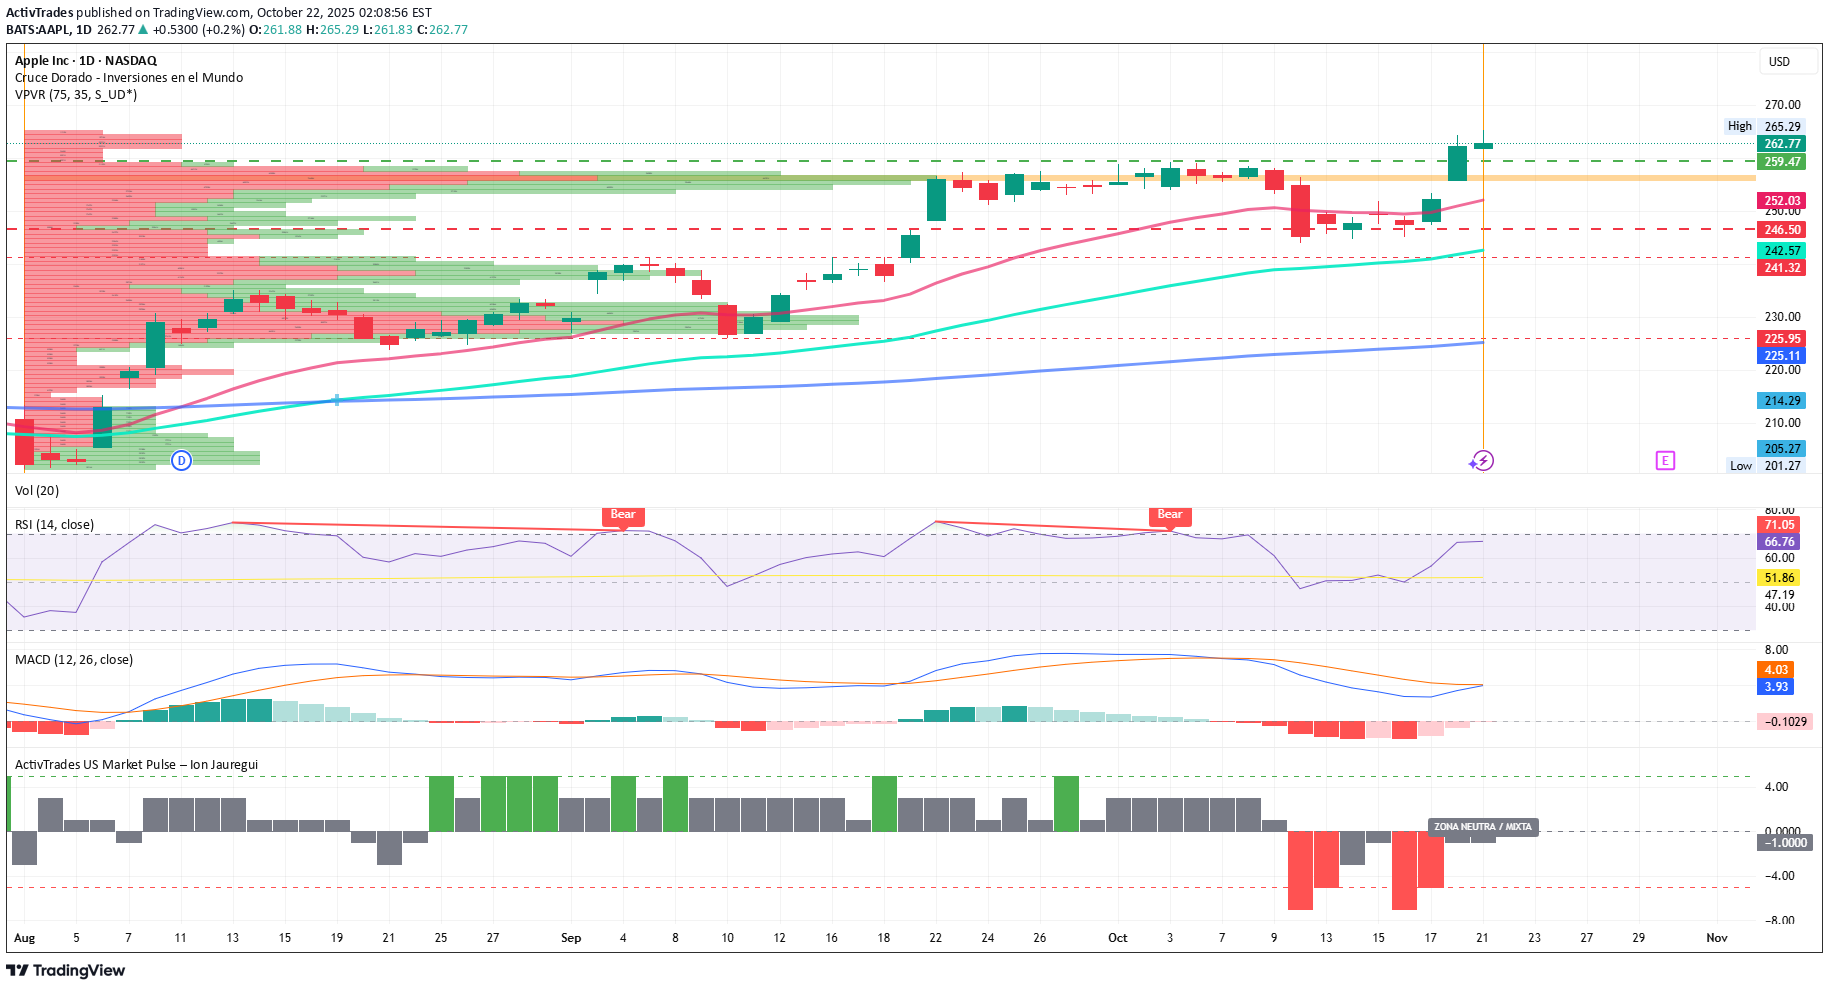
Apple Smashes Expectations with iPhone 17: Sales Up 14% in Just 10 Days By Ion Jauregui – Analyst at ActivTrades Apple (NASDAQ: AAPL) has made another bold move with the launch of its iPhone 17. According to Counterpoint, the latest model sold 14% more than the iPhone 16 in its first 10 days in key markets such as China and the United States. Growth is even more remarkable in China, where the base model almost doubled its sales compared to the iPhone 16. Overall, sales across both markets surged 31%, consolidating Apple as the undisputed leader in the sector. The secret behind this success seems simple but effective: a better chip, enhanced display, upgraded front camera, and larger storage capacity, all while maintaining the same price as last year. Apple’s “more for the same” strategy has, at least so far, proven highly profitable. AAPL Technical Analysis From a technical perspective, Apple shares show a solid bullish momentum following the iPhone 17 announcement: The price has broken key resistance at $259.47, consolidating above the 50-day moving average for two consecutive sessions. Relative Strength Index (RSI) indicators are in slightly overbought territory but show no immediate correction signals. MACD indicates the early stages of a bullish crossover. Trading volume has increased significantly in recent days, confirming strong institutional interest. In this context, current support is around $246.50, with the next support above $241.28 near the 100-day moving average, while the previous key support is at $225.95, coinciding with the 200-day moving average. The ActivTrades US Market Pulse indicates a neutral risk balance, suggesting that these moves are largely driven by speculation around Apple. For Apple, these figures represent more than just a commercial victory. The company needed a sales boost to justify its position in an increasingly competitive market, and early indicators show it is succeeding. The iPhone 17 not only strengthens investor confidence in Apple but also sets a new benchmark for the tech industry at a time when innovation and demand for premium devices are higher than ever. ******************************************************************************************* La información facilitada no constituye un análisis de inversiones. El material no se ha elaborado de conformidad con los requisitos legales destinados a promover la independencia de los informes de inversiones y, como tal, debe considerarse una comunicación comercial. Toda la información ha sido preparada por ActivTrades ("AT"). La información no contiene un registro de los precios de AT, o una oferta o solicitud de una transacción en cualquier instrumento financiero. Ninguna representación o garantía se da en cuanto a la exactitud o integridad de esta información. Cualquier material proporcionado no tiene en cuenta el objetivo específico de inversión y la situación financiera de cualquier persona que pueda recibirlo. La rentabilidad pasada y las estimaciones o pronósticos no son sinónimo ni un indicador fiable de la rentabilidad futura. AT presta un servicio exclusivamente de ejecución. En consecuencia, toda persona que actúe sobre la base de la información facilitada lo hace por su cuenta y riesgo. Los tipos de interés pueden cambiar. El riesgo político es impredecible. Las acciones de los bancos centrales pueden variar. Las herramientas de las plataformas no garantizan el éxito.
ActivTrades
قطعی جهانی آمازون (AWS): آیا وابستگی به یک غول، جهان دیجیتال را فلج کرد؟
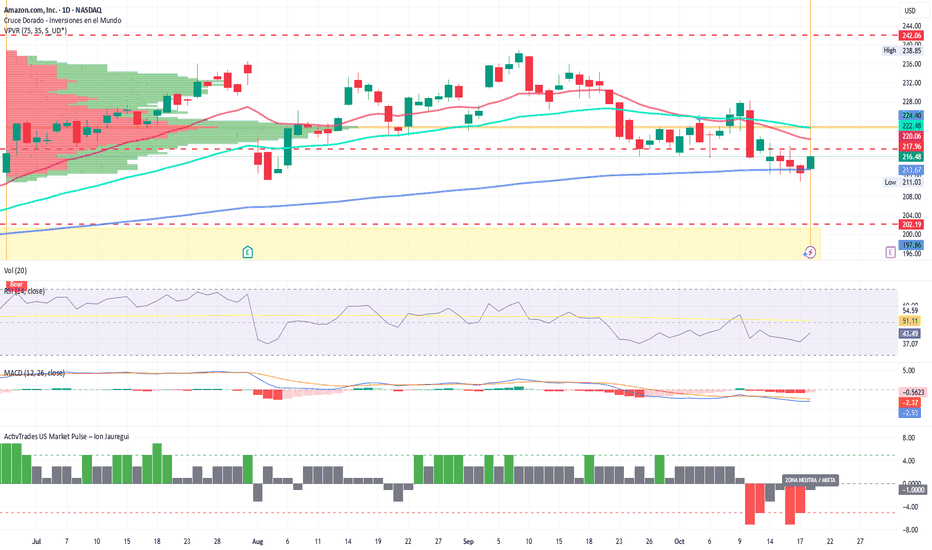
By Ion Jauregui – Analyst at ActivTrades From the early hours of Monday, October 20, 2025, Amazon Web Services (AWS) —Amazon’s cloud computing division— suffered a global outage that disrupted thousands of companies and users worldwide. The disruption, originating in AWS’s Northern Virginia (U.S.) data centers, took down websites, applications, payment systems, and everyday platforms. The failure, described by several experts as one of the company’s most serious in recent years, triggered a chain reaction that temporarily paralyzed much of the digital economy. Among the affected platforms were Canva, Asana, Perplexity AI, McDonald’s, Roblox, and Crunchyroll, as well as numerous financial and communication services. One of the most visible effects occurred in payment systems: many card readers stopped working, preventing electronic payments, while ATMs and services such as Bizum also went offline, making it impossible to withdraw cash or send instant transfers. For several hours, many businesses were forced to accept only cash or close their points of sale. AWS acknowledged the incident through its official service status page, confirming “network operation issues in the Northern Virginia region.” Technical teams worked urgently to restore connectivity, and although services gradually returned to normal throughout the day, the event highlighted the global dependence on Amazon’s digital infrastructure. With over 30% of the global cloud services market, AWS underpins a large portion of internet operations, from streaming and gaming platforms to payment systems, banks, and public administrations. Its outage reignites the debate on technological centralization and the need for greater diversification among cloud providers. Technical Analysis – Amazon (Ticker AT: AMZN) Amazon shares (NASDAQ: AMZN) fell 2.3% following AWS’s technical issues, though they managed to recover part of the losses, closing the session around $216.48. Despite the reputational setback, the financial impact is expected to be short-lived and does not alter the company’s positive long-term trend, driven by sustained growth in its e-commerce, advertising, and web services divisions. Since Friday, October 10, the stock had corrected below the $217.96 support level after the 50-day moving average crossed below the 100-day, amplifying downside pressure. However, Monday’s move showed a technical rebound at the 200-day moving average, suggesting potential short-term support. At present, the price appears to be forming a technical floor above the $211.03 lows. The Point of Control (POC) stands at $222.08, a key level to break in order to confirm a sustained rebound. Should this threshold be surpassed, the next target lies at $232, followed by $238.35, whose breakout could lead to a new bullish impulse. Conversely, a loss of support could drive the stock to retest the $202 area, signaling a possible trend reversal. The RSI, around 43.49%, indicates slight oversold conditions, while the MACD shows signs of lateral movement, consistent with the “Risk Off” sentiment prevailing in recent sessions, as reflected by the ActivTrades US Market Pulse indicator. Clouds on the Horizon The incident leaves one clear conclusion: in an increasingly digitalized world, a cloud failure can turn into a global storm. AWS has pledged to strengthen its redundancy and security protocols, but the October 20 outage will remain a reminder that even tech giants are not immune to vulnerability. ******************************************************************************************* The information provided does not constitute investment research. The material has not been prepared in accordance with the legal requirements designed to promote the independence of investment research and such should be considered a marketing communication. All information has been prepared by ActivTrades ("AT"). The information does not contain a record of AT's prices, or an offer of or solicitation for a transaction in any financial instrument. No representation or warranty is given as to the accuracy or completeness of this information. Any material provided does not have regard to the specific investment objective and financial situation of any person who may receive it. Past performance and forecasting are not a synonym of a reliable indicator of future performance. AT provides an execution-only service. Consequently, any person acting on the information provided does so at their own risk. Political risk is unpredictable. Central bank actions can vary. Platform tools do not guarantee success.
ActivTrades
سقوط بیت کوین: چرا قدرت دلار بازار کریپتو را سرد کرد؟
Bitcoin Pulls Back After New Highs: Strong Dollar Cools Crypto Market Rally By Ion Jauregui – Analyst at ActivTrades Bitcoin (BTCUSD) retreated to $121,000 on Wednesday after reaching a new all-time high of $126,186 earlier this week. Profit-taking and the recent strength of the U.S. dollar have temporarily slowed the bullish momentum that has dominated the market in recent weeks. From a macroeconomic perspective, the correction comes amid fiscal uncertainty in the United States, where the government shutdown has entered its second week. This situation has reinforced demand for traditional safe-haven assets such as the U.S. dollar and Treasury bonds, whose yields remain elevated. The U.S. Dollar Index (DXY) climbed to a three-week high, reducing the appeal of cryptocurrencies compared with dollar liquidity. Bitcoin’s recent rally was driven by sustained inflows into Bitcoin ETFs, expanding institutional participation in the asset, and by speculative positioning linked to so-called “devaluation trades”, where investors bet on the depreciation of fiat currencies against scarce assets. However, the dollar’s recovery and caution ahead of the Federal Reserve minutes have temporarily cooled that optimism. BTCUSD Analysis: On the technical front, Bitcoin faces strong resistance near its highs around $126,245, an area showing a clear exhaustion pattern accompanied by lower volume. The immediate support lies at $121,000, followed by $117,997, and the key Point of Control (POC) zone around $108,296, from where the latest bullish leg began. The daily RSI has eased from overbought levels to 61.63%, suggesting a healthy consolidation phase within a structure that remains bullish in the medium term. The MACD continues to indicate upward momentum, and the moving average crossover that began on October 2 appears to be expanding, with the current price well above the 50-day average, which aligns with the $117,970 support area. A break below these levels could open the door to declines toward $117,800–$115,000, while a sustained move above $123,500 may trigger new breakout attempts toward $128,000–$130,000. Crypto Ecosystem Follows the Pullback Across the sector, crypto-related equities mirrored the retreat: MicroStrategy (MSTR) dropped 8.7%, Coinbase (COIN) fell 2.7%, Riot Platforms (RIOT) slipped 0.4%, and Marathon Digital (MARA) lost 1.5%. Among major altcoins, Ethereum declined 4.6%, Solana 4.5%, and Cardano 5%, reflecting a broader risk-off sentiment across digital markets. In summary, Bitcoin is undergoing a technical correction within a volatile macroeconomic environment, where the dollar’s performance and the Federal Reserve’s guidance are likely to dictate the direction of the next major move. ******************************************************************************************* The information provided does not constitute investment research. The material has not been prepared in accordance with the legal requirements designed to promote the independence of investment research and such should be considered a marketing communication. All information has been prepared by ActivTrades ("AT"). The information does not contain a record of AT's prices, or an offer of or solicitation for a transaction in any financial instrument. No representation or warranty is given as to the accuracy or completeness of this information. Any material provided does not have regard to the specific investment objective and financial situation of any person who may receive it. Past performance and forecasting are not a synonym of a reliable indicator of future performance. AT provides an execution-only service. Consequently, any person acting on the information provided does so at their own risk. Political risk is unpredictable. Central bank actions can vary. Platform tools do not guarantee success.
ActivTrades
طلا به نزدیکی اوج تاریخی؛ سایه تعطیلی دولت آمریکا و کاهش نرخ بهره فدرال رزرو
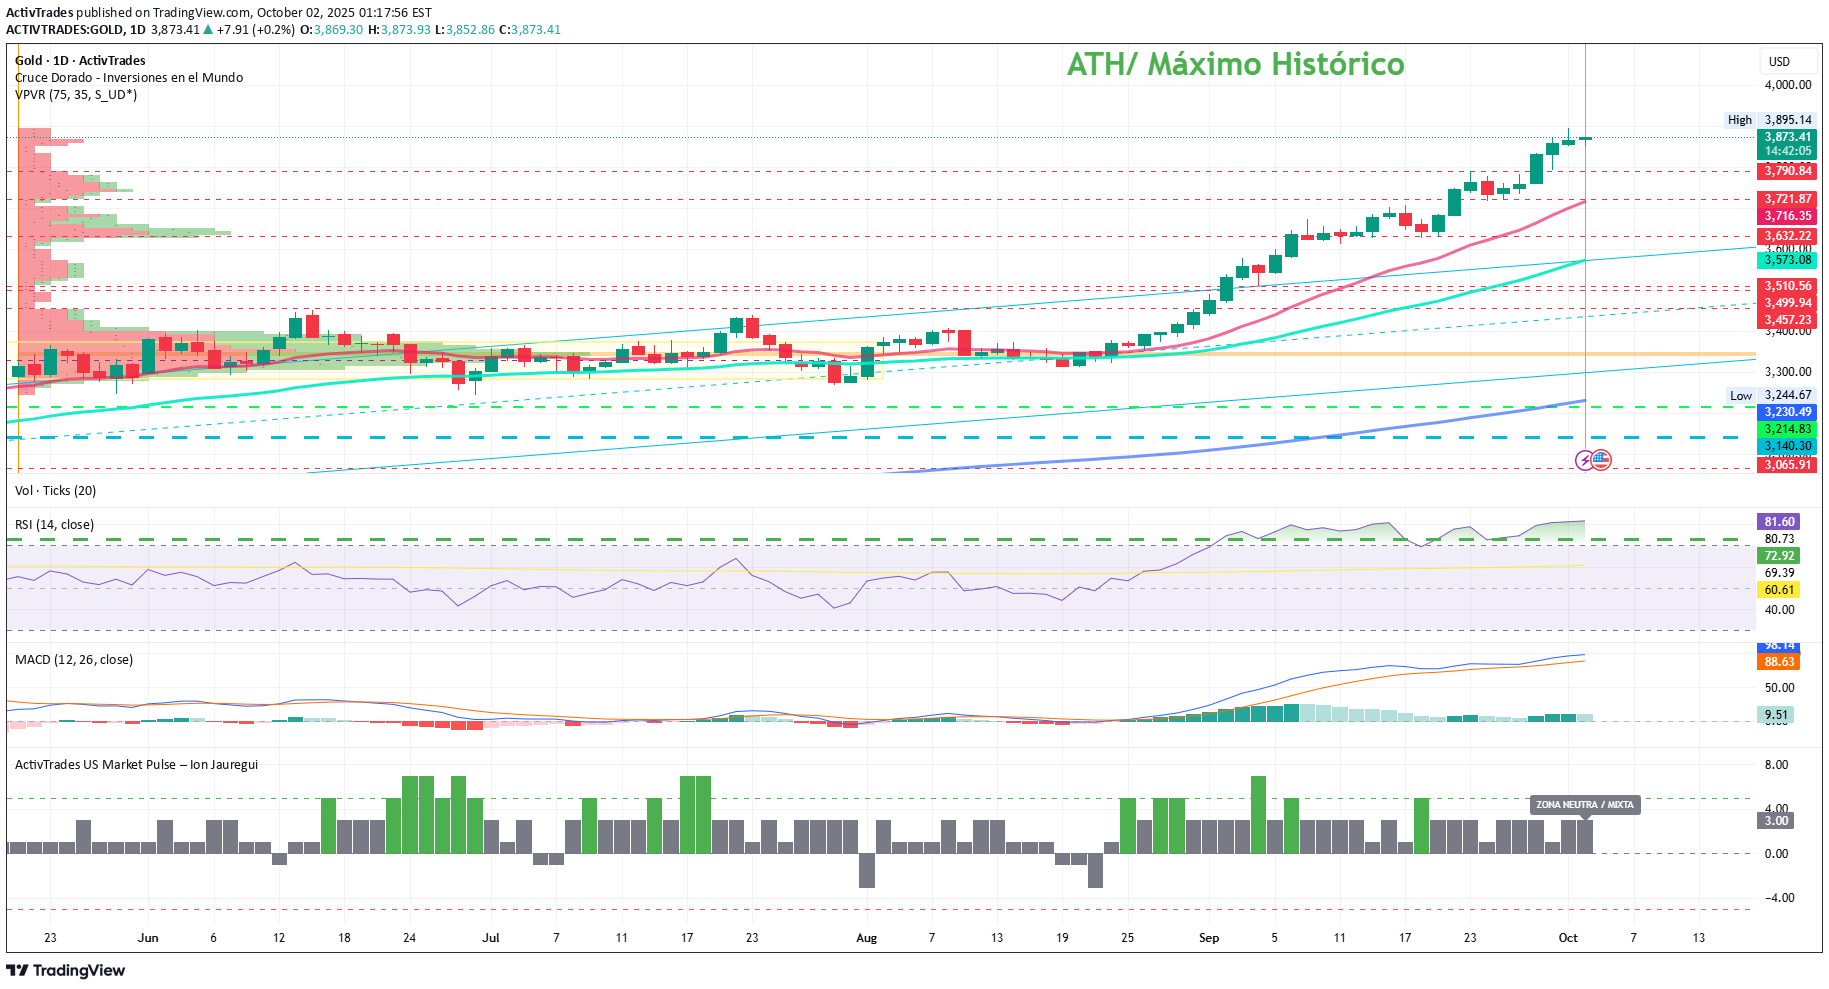
Ion Jauregui – Analyst at ActivTrades Gold remains close to record highs, supported by rising risk aversion in the markets following the U.S. government shutdown and strong expectations that the Federal Reserve will implement further interest rate cuts in October. The precious metal is trading at $3,864.63 per ounce, after hitting a record high of $3,895.33 in the previous session, while December futures stand at $3,889.65, down 0.2%. The lack of consensus in Congress has led to a halt in much of the federal operations and delayed the release of key labor data, such as nonfarm payrolls. This information gap fuels uncertainty and strengthens gold’s appeal as a safe-haven asset. Moreover, recent private labor market data showed a cooling trend, reinforcing bets that the Fed will cut rates by 25 basis points this month. The CME FedWatch places the probability of this move at 97%. However, inflation remains a source of pressure. The PCE price index, the Fed’s preferred inflation gauge, continues to stay above the 2% target, which could limit the magnitude of future rate cuts. Gold Technical Analysis (Ticker AT:GOLD) From a technical perspective, gold maintains a clear uptrend, consolidating above the $3,632–$3,790 range, having touched a record high of $3,895.14 in yesterday’s session. The support of the latest upward move lies at $3,721.87, where the 50-period moving average on the daily chart passes. On the upside, the key resistance remains at the psychological level of $3,900. A daily close above this level could open the door to $3,950, while surpassing $4,000 would mark a historic milestone, potentially attracting new buying interest. Moving average crossovers indicate a clear bullish bias. The RSI currently shows strong overbought conditions at 81.42%. The MACD indicates a bullish bias with both averages above the green histogram, although without a clear increase in trading volume. Additionally, the ActivTrades US Market Pulse shows a notable shift toward a neutral bias in the direction of Risk-On, which would imply lower safe-haven demand and a stronger dollar relative to yields, with major indices at continued record highs. This could lead investors to rotate positions from precious metals to industrial metals such as copper or platinum, which tend to benefit from stronger economic activity. The bullish bias remains as long as the price stays above $3,780, with investors favoring accumulation on dips amid U.S. political uncertainty, a weaker dollar, and expectations of lower rates. If this upward trend fails to hold, we could see a test of the identified support levels. U.S. Shutdown – Market Insight Gold today reflects not only the tension from the U.S. government shutdown but also the transition to a looser monetary cycle. Safe-haven demand coexists with expectations of lower rates, a combination that strengthens the precious metal. However, if the global market shifts toward a Risk-On scenario, capital could rotate into higher-yielding assets, temporarily reducing gold demand. For investors, the takeaway is clear: gold remains a strategic pillar in diversified portfolios, but its future performance will depend on whether fear or risk appetite prevails in the markets. ******************************************************************************************* The information provided does not constitute investment research. The material has not been prepared in accordance with the legal requirements designed to promote the independence of investment research and such should be considered a marketing communication. All information has been prepared by ActivTrades ("AT"). The information does not contain a record of AT's prices, or an offer of or solicitation for a transaction in any financial instrument. No representation or warranty is given as to the accuracy or completeness of this information. Any material provided does not have regard to the specific investment objective and financial situation of any person who may receive it. Past performance and forecasting are not a synonym of a reliable indicator of future performance. AT provides an execution-only service. Consequently, any person acting on the information provided does so at their own risk. Political risk is unpredictable. Central bank actions can vary. Platform tools do not guarantee success.
ActivTrades
Ethereum Bets on Privacy in Its New Roadmap
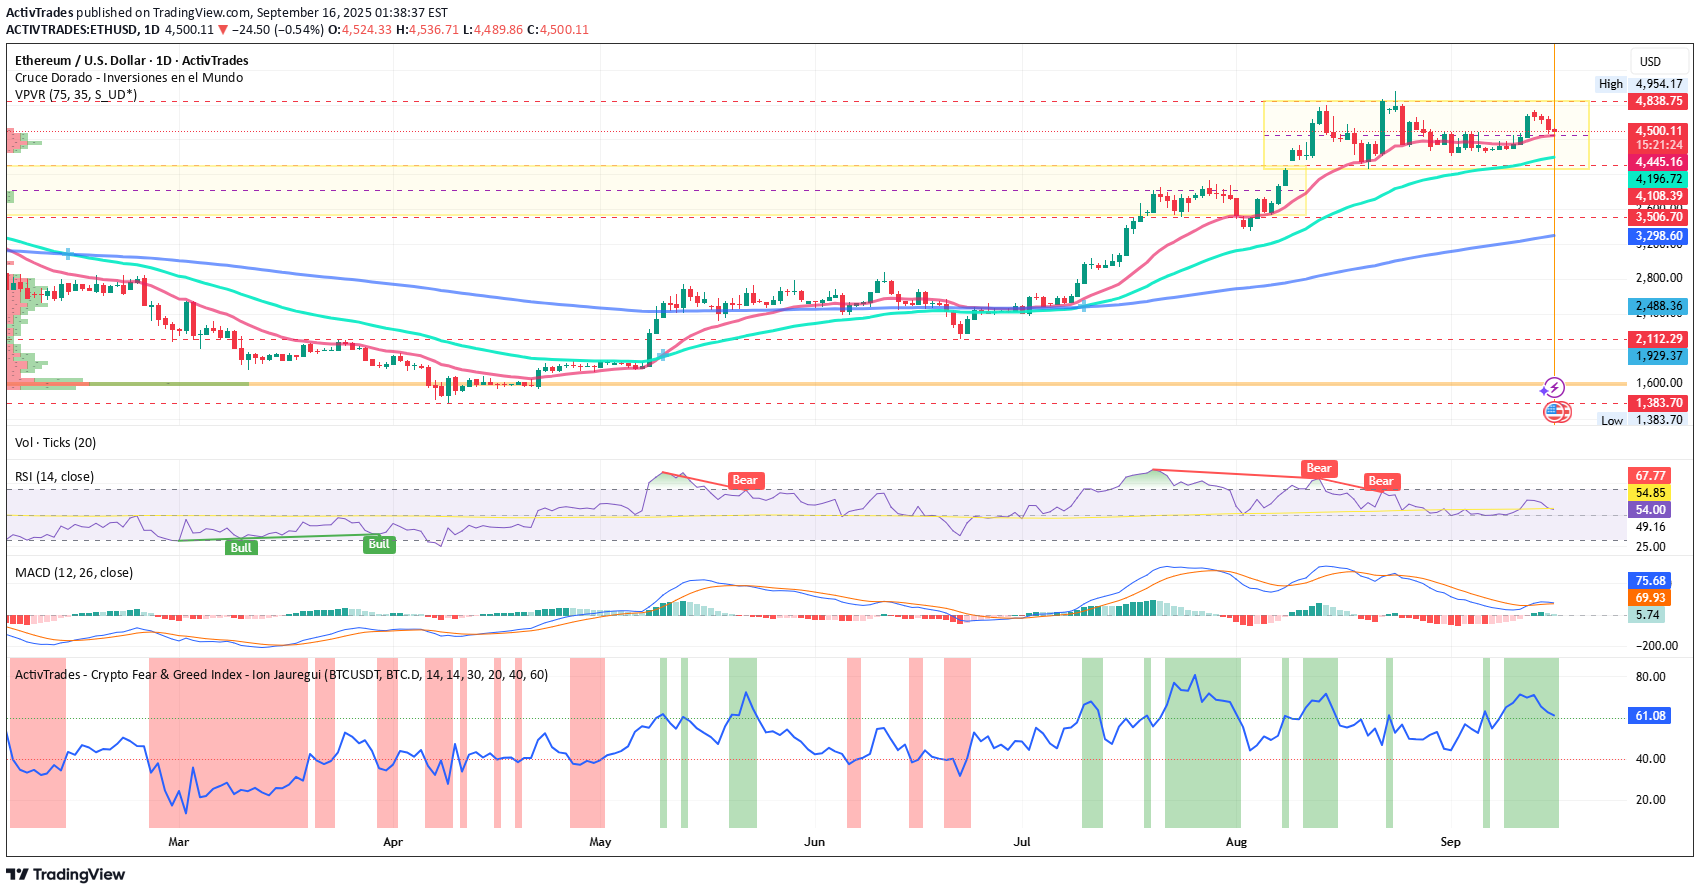
Ion Jauregui – Analyst at ActivTrades Ethereum has taken an important step in its evolution: privacy. The Ethereum Foundation has relaunched its team under the name Privacy Stewards of Ethereum (PSE) and presented a roadmap aimed at incorporating confidentiality tools into the ecosystem. Sam Richards, one of the project’s key figures, summed it up bluntly: “without privacy, Ethereum (ETH) is not freedom, it is global surveillance.” A statement that underscores the importance of this initiative. The strategy is structured around three pillars: Private writes: ensuring private operations cost the same as public ones. Private reads: enabling reads without leaving a trace on the network. Private proving: delivering faster and more affordable ZK proofs. Among the notable developments is PlasmaFold, a Layer 2 solution focused on private transfers, with a prototype expected this November at Devconnect in Argentina. In addition, the team is preparing a report on private voting in 2025 and is working on confidential DeFi applications targeted at institutional clients. Technical Analysis of ETHUSD The ETHUSD pair has entered a consolidation phase after recent bullish moves. It is currently trading near recent highs at $4,530.60, moving within a lateral channel defined by key support at $4,447.96 and resistance at the $4,954.17 highs, a level previously tested in 2021. The current price holds above the 50-day moving average, with the first support level aligned with the 100-day moving average. A third support can be found at the 200-day moving average near $3,506.70. The current Point of Control (POC) sits far below, at the origin of the previous bullish impulse around $1,600. The RSI is at 55.39, placing it in neutral territory following a series of bearish moves in mid-August. Meanwhile, the MACD remains in a lateral structure, with its histogram slightly positive—supporting the idea of price concentration. According to the ActivTrades Crypto Fear & Greed Index, sentiment stands at 61.65 (greed), reflecting lingering optimism in the market and sustained altcoin dominance. A breakout above the immediate resistance could lead to new highs toward $5,100. However, failure to hold this breakout may result in a loss of the 50-day moving average support, a retest of lower supports, and potentially a decline toward the $2,800 area. In conclusion, as long as ETHUSD holds above current support, the technical bias remains positive. Yet, breaking above the recent highs will be crucial to confirm a new bullish leg. With this approach, Ethereum strengthens its position not only as a smart contracts network but also as an ecosystem seeking to balance transparency and privacy—two key elements for mass adoption. ******************************************************************************************* The information provided does not constitute investment research. The material has not been prepared in accordance with the legal requirements designed to promote the independence of investment research and such should be considered a marketing communication. All information has been prepared by ActivTrades ("AT"). The information does not contain a record of AT's prices, or an offer of or solicitation for a transaction in any financial instrument. No representation or warranty is given as to the accuracy or completeness of this information. Any material provided does not have regard to the specific investment objective and financial situation of any person who may receive it. Past performance and forecasting are not a synonym of a reliable indicator of future performance. AT provides an execution-only service. Consequently, any person acting on the information provided does so at their own risk. Political risk is unpredictable. Central bank actions can vary. Platform tools do not guarantee success.
ActivTrades
AI GAIN Act: A Shot in the Foot for the Chip Industry?
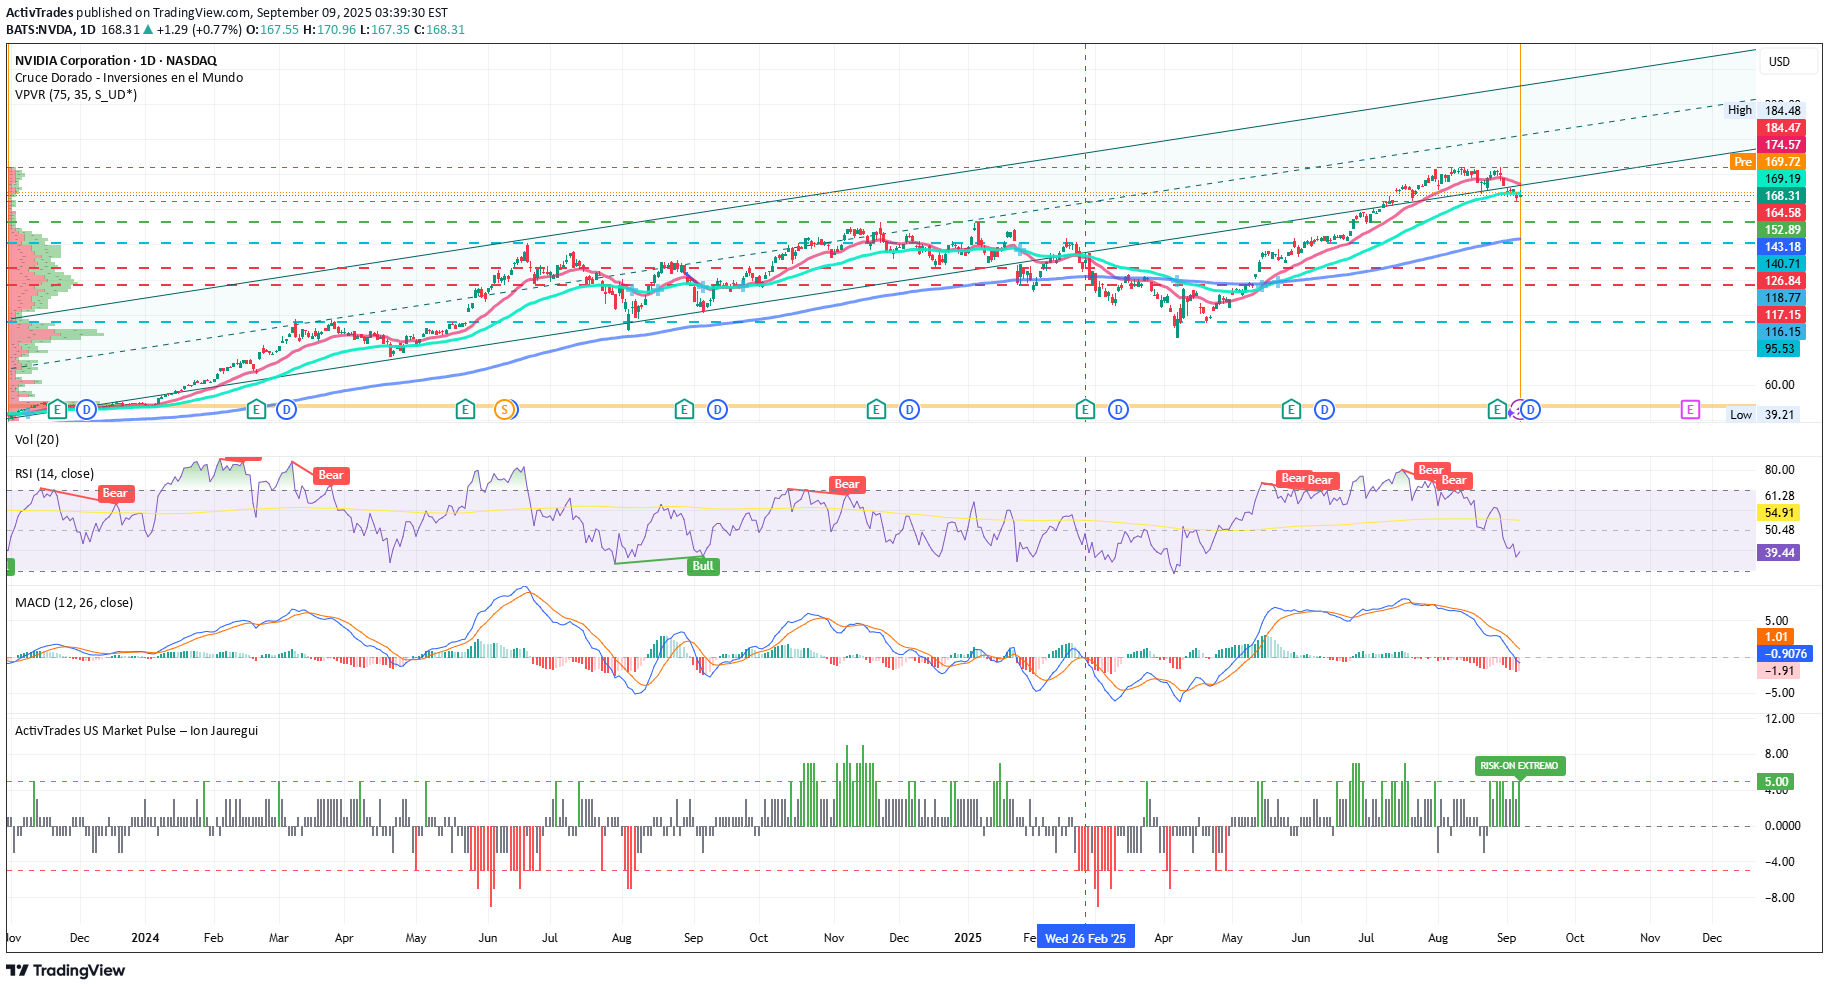
By Ion Jauregui – Analyst at ActivTrades The debate over Western leadership in artificial intelligence once again centers on Washington. The new AI GAIN Act, integrated as part of the National Defense Authorization Act (NDAA), establishes that any chip with performance above 4,800 TOPS will require an export license. The measure also stipulates that semiconductor manufacturers must prioritize deliveries to U.S. companies before exporting advanced chips abroad. Framed as a strategy to reinforce national security and curb China, the legislation has sparked alarm across the industry. In short: if U.S. companies are waiting for chips, China and other countries move to the back of the line. Nvidia raises the alarm Nvidia (NASDAQ: NVDA.O), the undisputed leader in GPUs for AI, has warned that the law would stifle global competitiveness and slow innovation in artificial intelligence. According to the company, there is currently no domestic supply shortage that justifies restricting access for foreign clients. The criticism recalls the controversial AI Diffusion Rule, pushed by the Biden administration in early 2025 and eventually revoked before coming into force. At the time, restrictions also aimed to control the export of chips and AI models but were discarded for being excessively rigid. Impact on the semiconductor sector The reach of the AI GAIN Act goes beyond Nvidia: •AMD, with its growing exposure to AI accelerators, faces similar risks in its international operations. •Intel, with a stronger domestic presence, may be less affected, as its profile aligns with the strategic goal of boosting local production. •Broadcom and Qualcomm, highly dependent on global client networks, would face tighter constraints on commercial flexibility. The most likely outcome is a double-edged sword: ensuring the U.S. always has priority in the supply chain, but at the cost of undermining the global business model that sustains sector margins. In short: the risk is that the cure ends up being worse than the disease, slowing global competition. Technical analysis of Nvidia Nvidia’s stock remains close to record highs after holding above USD 164 yesterday and closing at USD 168.31. Price action shows the loss of the 50-day moving average and movement toward the 100-day. A clear trend reversal has not yet materialized, even though the RSI is in oversold territory at 39.44, while the MACD is shifting into negative territory, crossing into the lower part of the histogram. Another relevant factor is a price bell that has moved strongly between USD 152.89 and USD 126.84, with its Point of Control (POC) around USD 138.17, slightly below the accumulation zone that fueled the rally to all-time highs. The ActivTrades US Market Pulse currently signals Extreme Risk-On conditions in U.S. markets, highlighting a phase of exuberance on Wall Street where macro or geopolitical risks seem ignored. This new law could act as a catalyst for sector pullbacks. If the current support at USD 164.58 and the next level at USD 152.89 fail, a return to the POC would be likely. On the other hand, if prices hold and consolidate, a new rally toward highs is possible. Such regulatory moves can trigger trend shifts, but if the market absorbs them, upside momentum could resume. From a wave structure perspective, bullish waves remain intact, suggesting this may be only a temporary pause. •Resistances: All-time high at USD 184.48 •Supports: 164.58, 152.89, and POC at 138.17 •Indicators: RSI at 39.44, signaling oversold and potential consolidation •MACD: Negative territory •Moving averages (50/100/200): No trend change yet, though the 50-day is approaching the 100-day •ActivTrades US Market Pulse: Extreme Risk-On Conclusion: Trump vs. AI The Trump administration’s protectionist measures aim to secure national access to silicon and reduce dependence on foreign suppliers, in order to safeguard U.S. leadership in AI. However, Nvidia’s warnings—echoed by the broader sector—underscore fears that overregulation could erode the international competitiveness of American tech giants, especially against China and other emerging innovation hubs. In this race for AI dominance, building walls may end up slowing down your own runners. ******************************************************************************************* The information provided does not constitute investment research. The material has not been prepared in accordance with the legal requirements designed to promote the independence of investment research and such should be considered a marketing communication. All information has been prepared by ActivTrades ("AT"). The information does not contain a record of AT's prices, or an offer of or solicitation for a transaction in any financial instrument. No representation or warranty is given as to the accuracy or completeness of this information. Any material provided does not have regard to the specific investment objective and financial situation of any person who may receive it. Past performance and forecasting are not a synonym of a reliable indicator of future performance. AT provides an execution-only service. Consequently, any person acting on the information provided does so at their own risk. Political risk is unpredictable. Central bank actions can vary. Platform tools do not guarantee success.
ActivTrades
BMW Puts on the Techie Suit to Challenge Elon
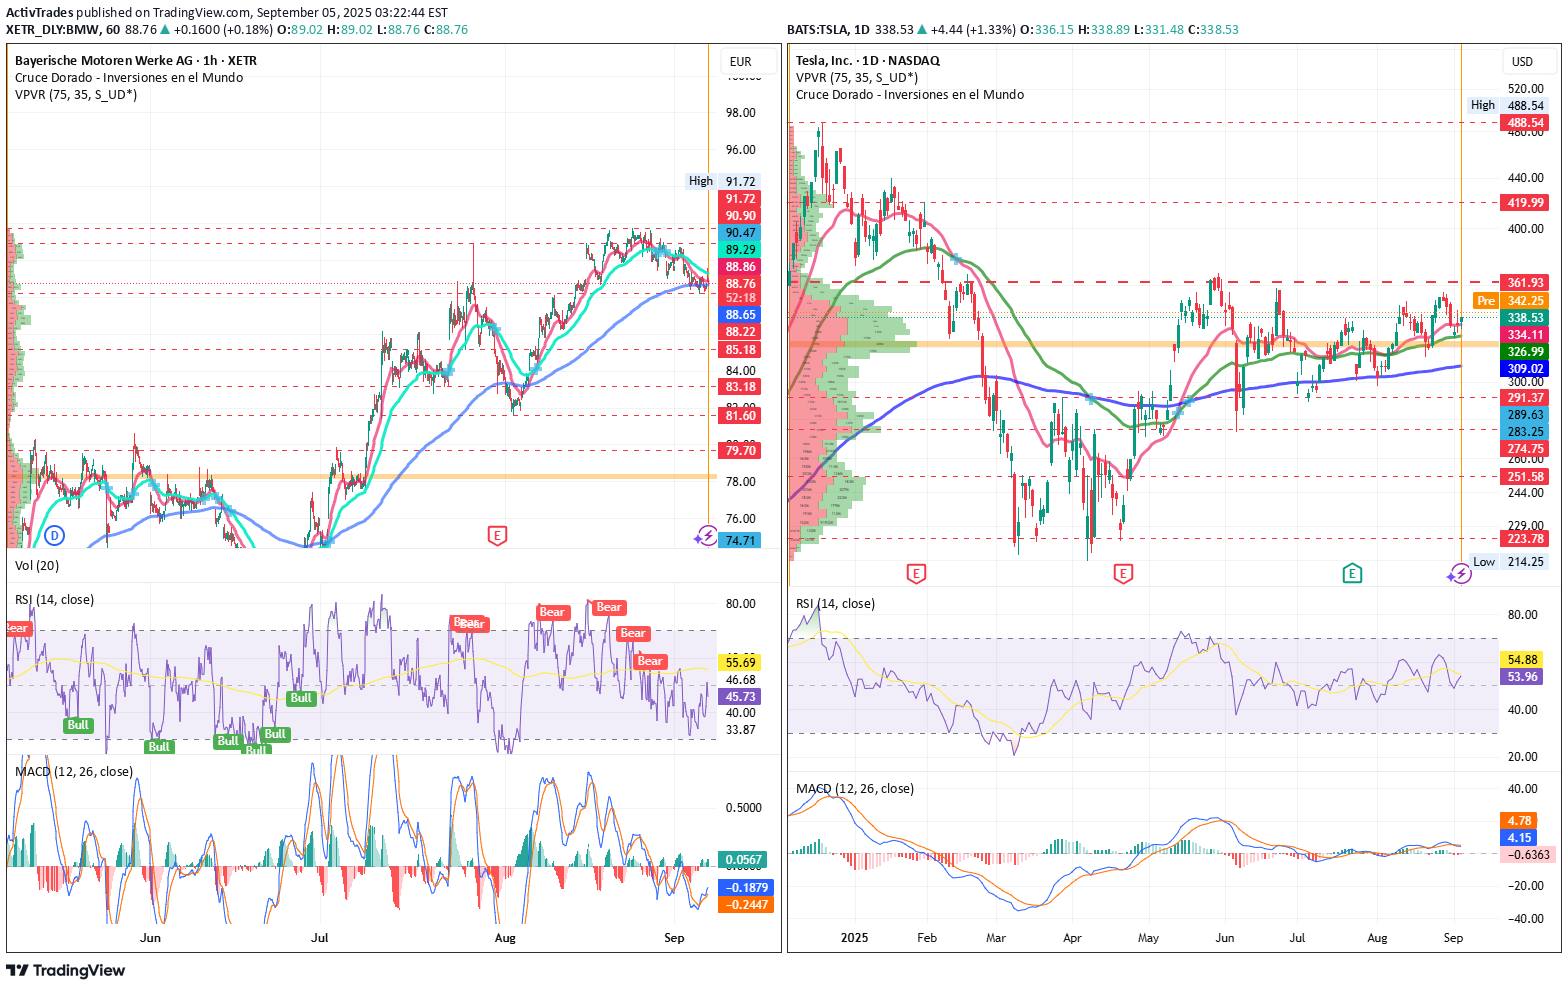
🚘️ BMW Puts on the Techie Suit to Challenge Elon By Ion Jauregui – Analyst at ActivTrades BMW (Ticker AT:BMW) has fired up its engines in the technology race against Tesla. The Bavarian brand is launching the Neue Klasse, a platform that promises to revolutionize the electric car and will debut with the new iX3, unveiled ahead of the Munich Motor Show. This is not just another electric SUV: the company has invested more than €10 billion to turn the car into a “superbrain on wheels.” Four central chips manage everything from infotainment to autonomous driving, with 20 times more computing power than current systems. Added to this are headline-grabbing features: 800 kilometers of range and 350 km of charge in just 10 minutes. BMW, however, does not manufacture its own batteries. Instead, it relies on Chinese giant CATL (SSE:300750), with whom it has developed new cylindrical cells that halve costs and increase energy density. Six gigafactories spread across China, Europe, and North America will guarantee supply. Shift to E-Mobility The shift toward electrification does not come without sacrifices. In 2024, the group saw its net profit fall 37%, to €7.68 billion, due to heavy spending on R&D. However, pure EV sales grew 13.5%, supporting the transition. BMW benefits from structural reductions in battery production costs, a diversified portfolio supported by solid alliances that integrate electric, hybrid, and combustion models under the same digital platform, and a premium positioning that continues to attract loyal customers. The risk lies in massive spending eroding margins at a time when Tesla (Ticker AT:TSLA) and Chinese manufacturers like Xpeng (NYSE:XPEV) are advancing aggressively. Technical Analysis BMW shares on the Frankfurt Stock Exchange show a consolidation trend after a volatile 2024 marked by profit cuts. The current key support at €88.18 seems to be holding, while resistance lies between €88.85 and the unbroken highs of €91.72. This resistance has repeatedly pushed the stock back to support levels after each upward attempt. Breaking through current highs would open a path toward €110, and possibly new yearly highs, while a drop below support could shake investor confidence and push the stock toward the Point of Control (POC) around €86.60. The 50, 100, and 200-day moving averages have contracted sharply over the past month, which could indicate declining confidence if confirmed. On the other hand, the RSI at 42.05% signals oversold conditions, while the MACD is negative but with a histogram turning positive—another possible signal of recovery. Lastly, the ActivTrades Europe Market Pulse indicator shows a contraction back to neutral territory, suggesting investors may be returning to support the market. BMW (Ticker AT:BMW) Trend: Bullish in the medium and long term, with potential lateralization or short-term reversal. Resistance: Strong zone at the highs of €91.72. Supports: Key levels between €88 and €88.50, with critical supports at €88.22, €88.18, POC €86.60, €85.18, €83.18, €81.60, and €79.70. Point of Control (POC): €86.60. Technical Conclusion: Recent sideways consolidation, with upside potential if the €91.50–91.72 zone is broken. Tesla Following political frictions between Elon Musk and Trump, Tesla’s stock has been recovering, moving sideways between May and August, with a slightly upward bias within the range of $361.93 to $291.37. A mid-range area has formed around the POC of $311.43, acting as support for the latest rally. The RSI stands at 53.96%, a relatively neutral level, while the MACD remains neutral with a histogram gradually entering negative territory, pointing to a strong consolidation move. Meanwhile, the ActivTrades US Market Pulse indicates the American market is in extreme RISK-ON, suggesting potential adjustments due to excessive greed. Tesla (Ticker AT:TSLA) Current Trend: Short-term bullish recovery after weeks of lateral consolidation, with positive signs from regaining key moving averages. Resistances: Strong resistance around $361.93, which could open the way toward $420, the next major level lost in February’s death cross. Supports: Key support at the POC of $311.43, followed by $291.37, $274.75, and $225.58. Technical Conclusion: Tesla is at a decisive range. A break above recent highs could trigger an upward move toward $420 or beyond. Conversely, a drop below $320 would increase bearish pressure, potentially driving the stock down to test $291. Conclusion The Neue Klasse is not just a product launch—it is BMW’s boldest and riskiest bet in decades. The German manufacturer wants to stop being solely a premium icon and transform into a fully-fledged tech player. Elon Musk no longer runs alone: the racetrack is filling up with rivals hungry for disruption. ******************************************************************************************* The information provided does not constitute investment research. The material has not been prepared in accordance with the legal requirements designed to promote the independence of investment research and such should be considered a marketing communication. All information has been prepared by ActivTrades ("AT"). The information does not contain a record of AT's prices, or an offer of or solicitation for a transaction in any financial instrument. No representation or warranty is given as to the accuracy or completeness of this information. Any material provided does not have regard to the specific investment objective and financial situation of any person who may receive it. Past performance and forecasting are not a synonym of a reliable indicator of future performance. AT provides an execution-only service. Consequently, any person acting on the information provided does so at their own risk. Political risk is unpredictable. Central bank actions can vary. Platform tools do not guarantee success.
ActivTrades
Gold and Its Hidden Catalyst: Is a New Bull Cycle on the Horizon
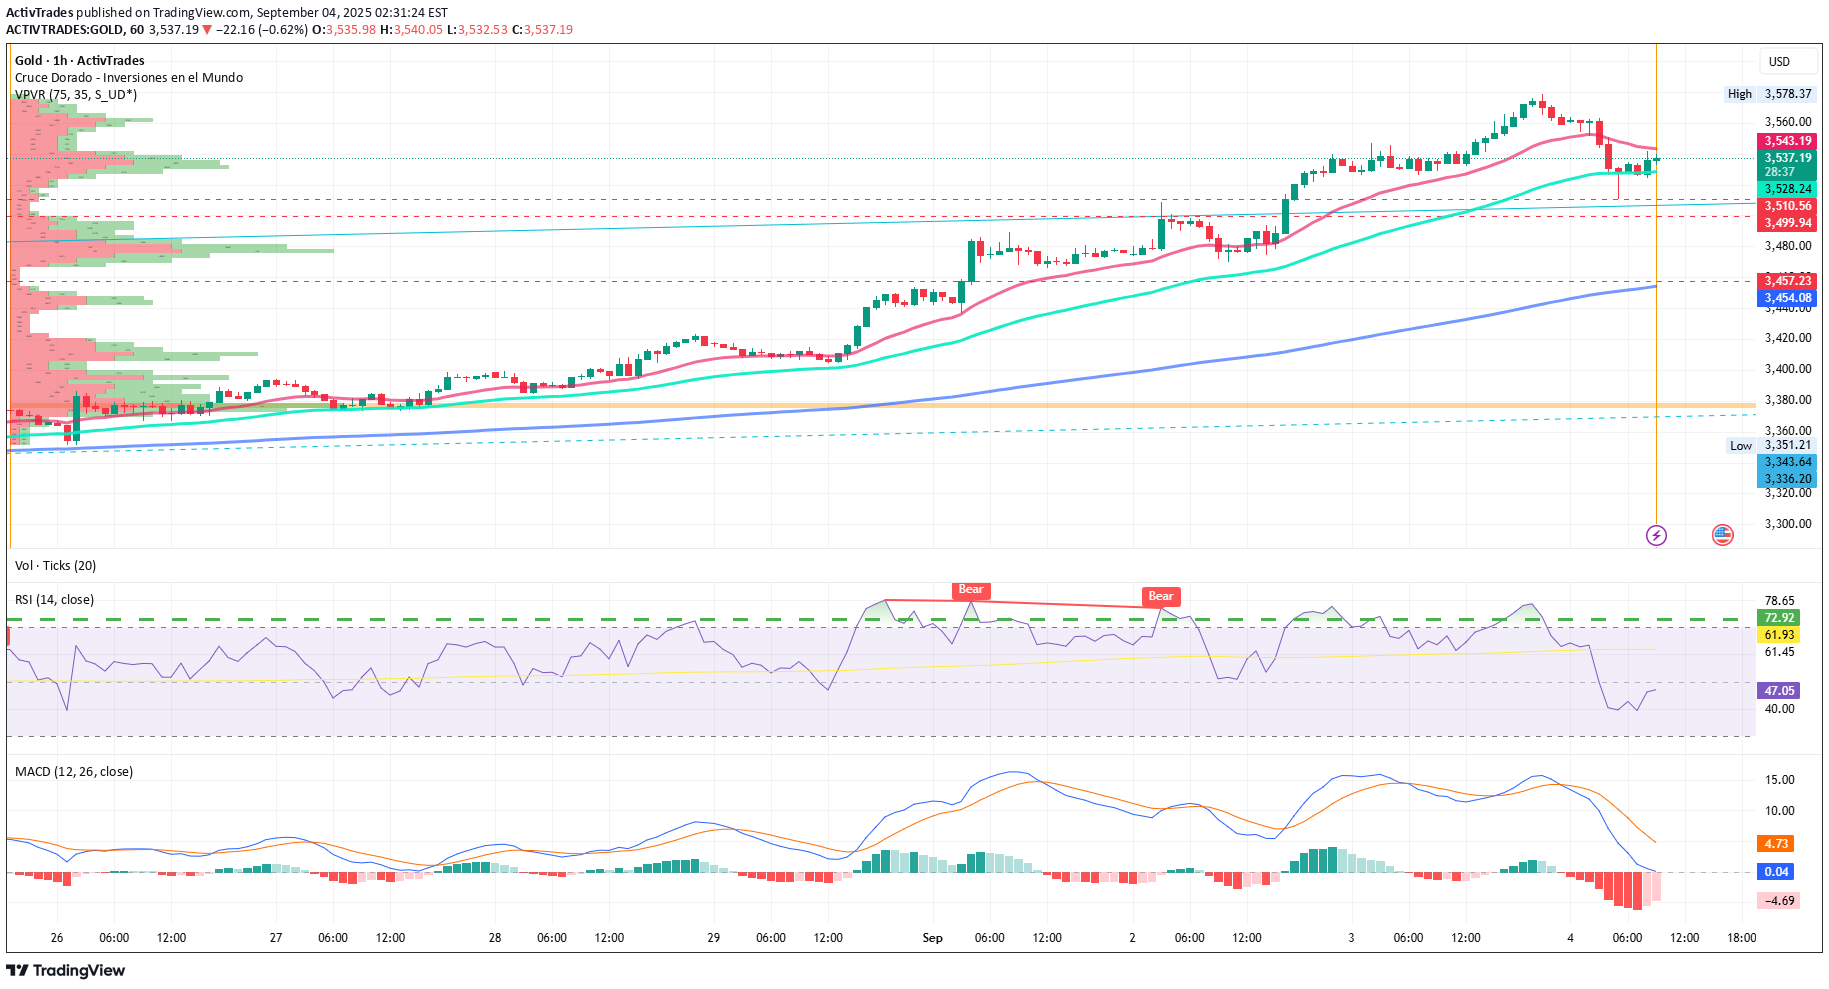
By Ion Jauregui – Analyst at ActivTrades Gold (Ticker AT: GOLD) is once again at the center of financial debate. After years of solid gains and an undisputed role as a safe haven, a little-explored factor could trigger an unprecedented bull cycle: the potential revaluation of the United States’ official gold reserves. The Hidden Catalyst The United States holds 261.5 million troy ounces in official reserves, valued on the books at only $42.22 per ounce, or roughly $11 billion in total. However, the current gold price hovers around $3,500 per ounce, revealing a vast gap between accounting value and market reality. Some lawmakers, including Senator Cynthia Lummis, have proposed updating these reserves to market prices. The impact would be colossal: such an adjustment would represent about 3% of U.S. GDP, potentially used to reduce the deficit, lower public debt, or create a strategic fund tied to new reserves in bitcoin. Global Implications A revaluation of this magnitude would not only reinforce gold’s monetary role but also free resources to alleviate deficit pressures and debt interest obligations. At the same time, it could have an inflationary side effect, acting as an indirect monetary injection that weakens the dollar against gold and other currencies. If realized, this move could influence other central banks, creating a chain reaction with greater revaluation of global reserves and increased demand for gold as a strategic asset. Central banks’ interest already supports this thesis: in 2024, net purchases exceeded 1,000 tonnes of gold for the third consecutive year, and in 2025 buying momentum remains high. This trend validates gold’s role as a strategic monetary asset and increases pressure to adjust its official valuation. Investor Perspective A potential official revaluation of U.S. reserves could become one of the largest bullish catalysts in decades, solidifying gold as a hedge against U.S. fiscal risk, the erosion of the dollar as a global reserve currency, and geopolitical tensions. For investors, maintaining strategic exposure to the precious metal appears more relevant than ever. This can be achieved through physical gold, gold-backed ETFs, gold mining stocks, or hybrid instruments such as gold loans with additional yield. The Gold Zapatero Sold at a Loss During José Luis Rodríguez Zapatero’s government, the Bank of Spain carried out one of the largest reductions in gold reserves in recent history. Between 2005 and 2007, it sold around 242 tonnes, nearly half of the national stock, which fell from 523 tonnes to just 282 tonnes. In 2007 alone, more than 130 tonnes were sold under European central bank agreements aimed at diversifying assets and investing in sovereign debt. Since then, Spain’s gold position has remained virtually unchanged at around 281 tonnes, with no significant purchases, unlike other central banks that have increased their reserves in recent years. At today’s price of $3,500 per ounce, Spain’s current gold reserves (281 t) would be worth approximately $31.6 billion. In contrast, the 242 tonnes sold under Zapatero fetched only ~$3.5 billion, meaning those reserves would now be worth ~$27.2 billion, more than seven times the sale price at the time. Technical Analysis of Gold (Ticker AT: GOLD) Gold cash is currently trading slightly above $3,500 per ounce, consolidating after the strong bullish surge in August. The technical structure shows a market still dominated by buyers, although signs of overextension and sideways movement are emerging. The price has lost the 50-day moving average support and currently rests weakly above the 100-day average. Key Levels Immediate Resistance: $3,578.37 – a psychological zone coinciding with recent highs and selling pressure. Next Resistance: $3,600 – round number and likely target if bullish momentum continues. Immediate Support: $3,510 – a short-term reference; a break could trigger a deeper correction. Relevant Support: $3,499.57 – confluence zone from the last impulse, acting as strong support for the recent bullish move. Technical Indicators RSI: ~39.41%, in oversold territory, suggesting potential price recovery. MACD: bearish signal, with a negative histogram reflecting fatigue in the bullish impulse. Moving Averages: price comfortably above the 50-day average, maintaining the underlying bullish trend. Point of Control (POC): $4,777.97 in the previous accumulation zone. Probable Scenarios The technical bias remains bullish as long as gold holds relevant support and stays above the POC. However, oversold conditions increase the likelihood of temporary sideways consolidation to prepare for new highs. A drop below $3,457 would test the 200-day moving average and challenge the current trend, though institutional buyers may use the $3,510 support area to reposition. The recent surge has pushed prices above a long-term range recently broken with some force, suggesting a potential revisit of supporting trend lines to retest and surpass current highs. Planned Fiat Devaluation and Return to the Gold Standard? Gold sits at an inflection point where structural and technical forces converge. On one hand, the hypothesis of an official revaluation of U.S. reserves introduces a potentially transformative factor that could start a broad new bull cycle. The market shows a clear underlying positive trend with necessary consolidation phases. For institutions, gold is gaining appeal as a hedge against U.S. fiscal risk, dollar pressure, and uncertainty. In the short term, the market is defending supports and seeking to recover above the 50-day moving average. Long-term institutional accumulation and global monetary policy reinforce the thesis that gold will continue playing a central role in the international financial architecture—not just as a safe haven, but as a backbone of the future monetary system. Europe, and particularly Spain, will need to take measures to position its reserves strategically in line with this trend. ******************************************************************************************* The information provided does not constitute investment research. The material has not been prepared in accordance with the legal requirements designed to promote the independence of investment research and such should be considered a marketing communication. All information has been prepared by ActivTrades ("AT"). The information does not contain a record of AT's prices, or an offer of or solicitation for a transaction in any financial instrument. No representation or warranty is given as to the accuracy or completeness of this information. Any material provided does not have regard to the specific investment objective and financial situation of any person who may receive it. Past performance and forecasting are not a synonym of a reliable indicator of future performance. AT provides an execution-only service. Consequently, any person acting on the information provided does so at their own risk. Political risk is unpredictable. Central bank actions can vary. Platform tools do not guarantee success.
ActivTrades
Robinhood and USDC: Cryptoland Predicting the Future

Ion Jauregui – Analyst at ActivTrades Robinhood (NASDAQ: HOOD) is not only focused on stocks and cryptocurrencies; it is now taking a bold step into sports prediction markets. Thanks to its integration with Kalshi, the app will allow users to bet on NFL and NCAA outcomes throughout the regular season. This move, presented as a “prediction market” to avoid conflicts with the CFTC, demonstrates Robinhood’s intention to become the “one-stop shop” for the modern investor, combining finance, entertainment, and cryptocurrencies. Kalshi, Robinhood’s technology partner, accepts payments in USDC, Bitcoin, Solana, and WLD, directly integrating the stablecoin ecosystem into betting and predictions. This approach highlights the growing importance of stablecoins as a vehicle for liquidity and digital transactions. Interest in USDC is accelerating alongside the regulatory clarity provided by the recent GENIUS Act, which establishes federal standards for stablecoins. According to a Goldman Sachs report, the global stablecoin market, valued at $271 billion, could see a significant boost for USDC, with projected growth of $77 billion between 2024 and 2027. Circle, the issuer of USDC, stands to benefit from reserve transparency and a favorable regulatory environment, positioning itself against Tether in the so-called “stablecoin gold rush.” Robinhood (Ticker AT: HOOD) continues gaining ground. Robinhood has confirmed that it is still in full expansion. In Q2 2025, the platform reported revenues of $989 million, a 45% increase compared to the same period last year, while net profit doubled, rising 105%, demonstrating that its business model remains profitable. The company is not only focused on stock trading but has diversified its offerings. With premium services such as Robinhood Gold, a new credit card, the Robinhood Legend platform, and the acquisition of Bitstamp, Robinhood aims to consolidate its presence in the cryptocurrency and futures markets, diversifying its revenue streams. The company’s ambitious goal is to capture a significant share of the estimated $84 trillion wealth transfer to younger generations over the next two decades. From a technical perspective, HOOD shares are trading at $105.34 as of yesterday, up 182% over the past year, confirming a sustained upward trend. Technical Currently, Robinhood shares trade at $105.34, with a P/E ratio of 46.21 and EPS of 1.96. Over the past year, the stock has risen 182.72%, showing a strong upward trend. Yesterday’s bearish close after hitting a high of $117.70 for the second time in August suggests the bullish momentum may require more volume to continue. The RSI at 50.15% and MACD entering negative territory, along with a Point of Control (POC) at $49.11 (less than half of the current price), could signal a potential price correction despite the hype and high expectations. The volume over the last two sessions has been relatively high (56.52M vs. 41.47M), suggesting a possible pause in the rally, provided strong support levels at $90 and $96.86 hold. The price has lost support from the 50-day moving average but remains above the 100-day moving average. USDC: The Stablecoin That Keeps Growing In the cryptocurrency world, USDC continues to strengthen its position. The stablecoin issued by Circle has seen its circulation exceed $65.2 billion, a 90% increase over the past year, reflecting growing confidence from both institutional and retail investors. Although Circle reported revenues of $658 million in Q2 2025, up 53% from last year, it still shows a net loss of $482 million due to accounting adjustments related to its IPO. However, recent stablecoin regulation (GENIUS Act) has provided greater security for users and boosted institutional adoption of USDC as a payment method and store of value. Technical Practically speaking, USDC continues to fulfill its goal: maintaining parity with the US dollar, trading steadily at $1, offering confidence in a volatile market. Its stability, backed by liquid and secure assets, reinforces its position as one of the most reliable stablecoins. Yesterday’s session saw a correction from a high of $1.00050 to today’s price of $0.99997. The RSI today is around 50.79%, and the MACD indicates an expansion of the bullish trend. Looking Ahead: Innovation and Stability Hand in Hand Robinhood and USDC are not just individual market movements but part of an interconnected financial ecosystem. While Robinhood expands into prediction and financial entertainment markets, USDC solidifies its role as a reliable stablecoin, driven by regulation and institutional trust. The combination of technological innovation, product diversification, and regulatory stability is redefining how we interact with markets. For investors, this is not just a trend—it is a clear signal that digital finance is evolving from an experiment into global infrastructure. Those who identify these opportunities could benefit from both growth in prediction markets and the widespread adoption of regulated stablecoins. In short: Robinhood predicts, USDC supports, and the digital market moves toward a more integrated and secure future. ******************************************************************************************* La información facilitada no constituye un análisis de inversiones. El material no se ha elaborado de conformidad con los requisitos legales destinados a promover la independencia de los informes de inversiones y, como tal, debe considerarse una comunicación comercial. Toda la información ha sido preparada por ActivTrades ("AT"). La información no contiene un registro de los precios de AT, o una oferta o solicitud de una transacción en cualquier instrumento financiero. Ninguna representación o garantía se da en cuanto a la exactitud o integridad de esta información. Cualquier material proporcionado no tiene en cuenta el objetivo específico de inversión y la situación financiera de cualquier persona que pueda recibirlo. La rentabilidad pasada y las estimaciones no sinónimo ni un indicador fiable de la rentabilidad futura. AT presta un servicio exclusivamente de ejecución. En consecuencia, toda persona que actúe sobre la base de la información facilitada lo hace por su cuenta y riesgo. Los tipos de interés pueden cambiar. El riesgo político es impredecible. Las acciones de los bancos centrales pueden variar. Las herramientas de las plataformas no garantizan el éxito.
Disclaimer
Any content and materials included in Sahmeto's website and official communication channels are a compilation of personal opinions and analyses and are not binding. They do not constitute any recommendation for buying, selling, entering or exiting the stock market and cryptocurrency market. Also, all news and analyses included in the website and channels are merely republished information from official and unofficial domestic and foreign sources, and it is obvious that users of the said content are responsible for following up and ensuring the authenticity and accuracy of the materials. Therefore, while disclaiming responsibility, it is declared that the responsibility for any decision-making, action, and potential profit and loss in the capital market and cryptocurrency market lies with the trader.