
ZORA
ZORA
| تریدر | نوع سیگنال | حد سود/ضرر | زمان انتشار | مشاهده پیام |
|---|---|---|---|---|
No results found. | ||||
Price Chart of ZORA
سود 3 Months :
سیگنالهای ZORA
Filter
Sort messages by
Trader Type
Time Frame

behdark
سیگنال فروش ZORA: آمادهسازی برای ریزش بزرگ در تایم فریم 2 ساعته!
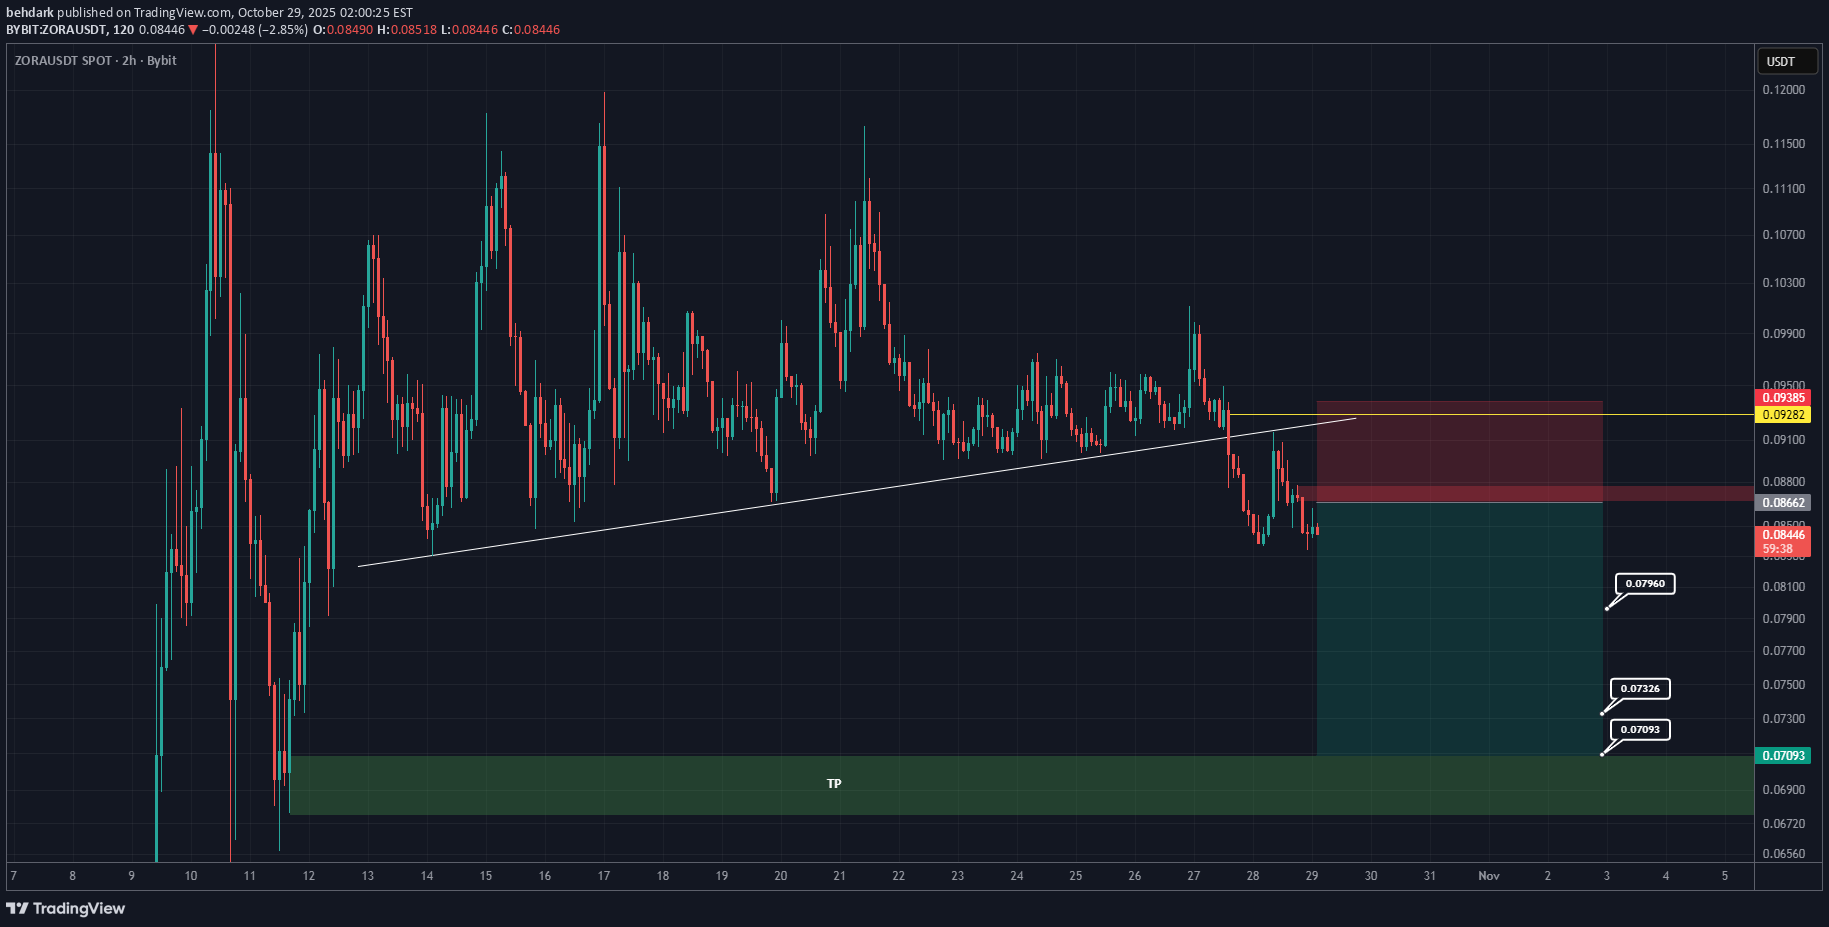
Add this pair to your watchlist; if it reaches our entry zone, we’ll take a position The price shows strong confirmations for a drop | the short-term trendline has been broken, and the supportive order blocks have failed. The market has been ranging for a while, but the price seems likely to break out to the downside. Targets, stop-loss, and entry zone are marked on the chart. For risk management, please don't forget stop loss and capital management When we reach the first target, save some profit and then change the stop to entry Comment if you have any questions Thank YouAfter reaching the entry zone | The first target of this ZORA Sell/Short signal was hit

تحلیل کامل جفت ارز ZORA/USDT: آمادهسازی برای صعود در صرافی MEXC (تارگت ۰.۰۹۶۰)
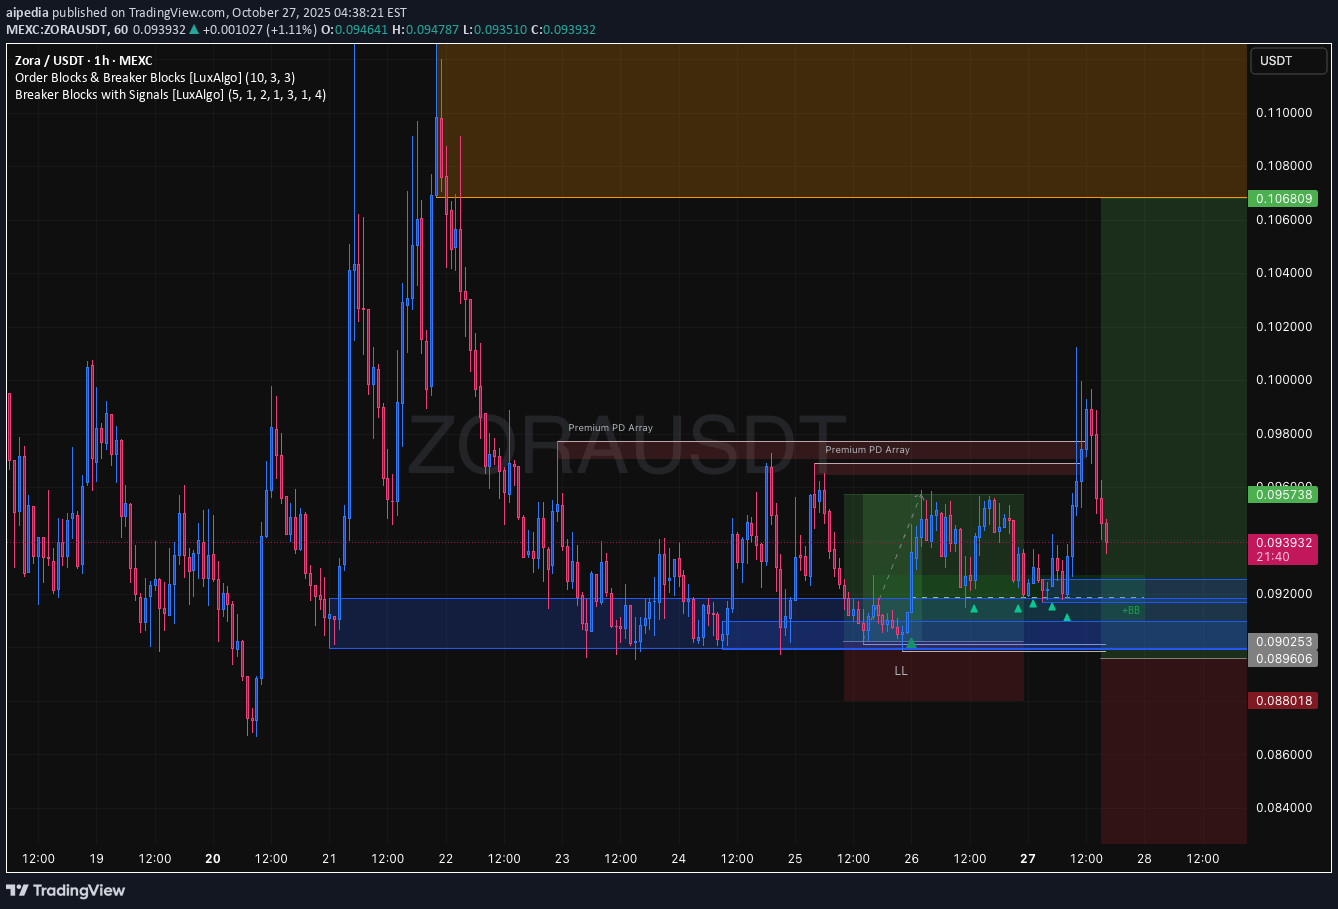
Clear bullish momentum spotted on ZORAUSDT (1h, MEXC). Setup leans on structure and reaction to recent levels. Analysis: Trend: Price is showing near-term bullish continuation, supported by higher lows and rejection wicks on current candles. Support Zone: Strong buying interest near the 0.0935–0.0940 region. Recent candles confirm buyers stepping in. Resistance: Next clear resistance around 0.0950–0.0960 as shown by previous highs and market reactions. Volume: Slight uptick on green candles, indicating healthy participation. Trade Plan: Long Bias Entry: 0.0941–0.0942 (on retest or minor dip) Stop: Below 0.0935 (invalidate if price closes below recent support) Target(s): First TP at 0.0950, extended target near 0.0960 Invalidation: Setups invalid if breakdown below 0.0935 area on strong volume. Reasoning: Setup is based on price structure, reaction at support, and minor volume confirmation. No confirmation = no trade. Risk should be strictly managed. Disclaimer: Not financial advice. Purely an analytical setup for study purposes.

SinerjiPortfoy
تحلیل زورا (ZORA): آیا حمایت ۰.۰۸۴ شکسته میشود؟ پیشبینی نزولی تا کجا ادامه دارد؟
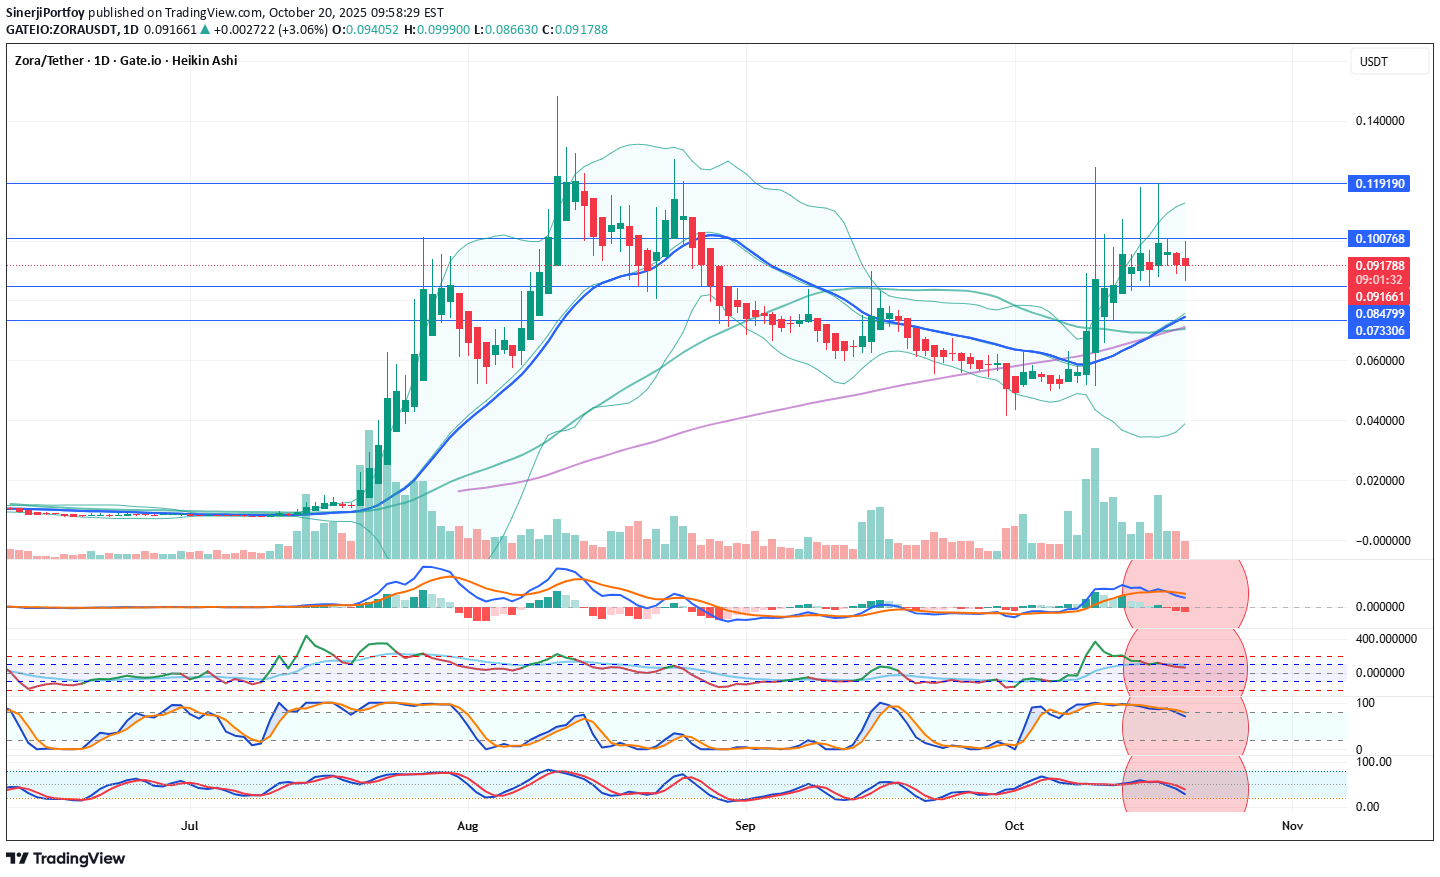
ZONAUSDT Coin Analysis and Commentary ZORA Coin indicators are currently in a negative condition. In the daily technical outlook, selling pressure is expected to continue. In a possible pullback, the 0.08479 support level will be monitored. If this level is broken downward, a decline toward the 21-day moving average (0.074807) may occur. If the price stabilizes around this average, it could create an opportunity for another upward move in the coming weeks. In a potential positive scenario, the 0.100768 resistance level is significant, and the price must break above it. Due to the negative indicators, our overall outlook for ZORA Coin remains bearish. Resistance: 0,100768 - 0,119190 Support: 0,084799 - 0,73306 We’d appreciate it if you could boost our posts and share them on your social media. 🚀 Legal Disclaimer: The information, comments, and recommendations contained herein do not constitute investment advice. Investment advisory services are provided only within the framework of an investment advisory agreement to be signed between the investor and authorized institutions such as brokerage firms, portfolio management companies, and non-deposit banks. The opinions expressed here are personal views and may not be suitable for your financial situation, risk profile, or return preferences. Therefore, no investment decisions should be made based solely on the information and opinions presented on this page.

MeTraderTr
چرا رباتها در معاملات ZORA مدام استاپلاس را فعال میکنند؟ تحلیل سریع و پرریسک!
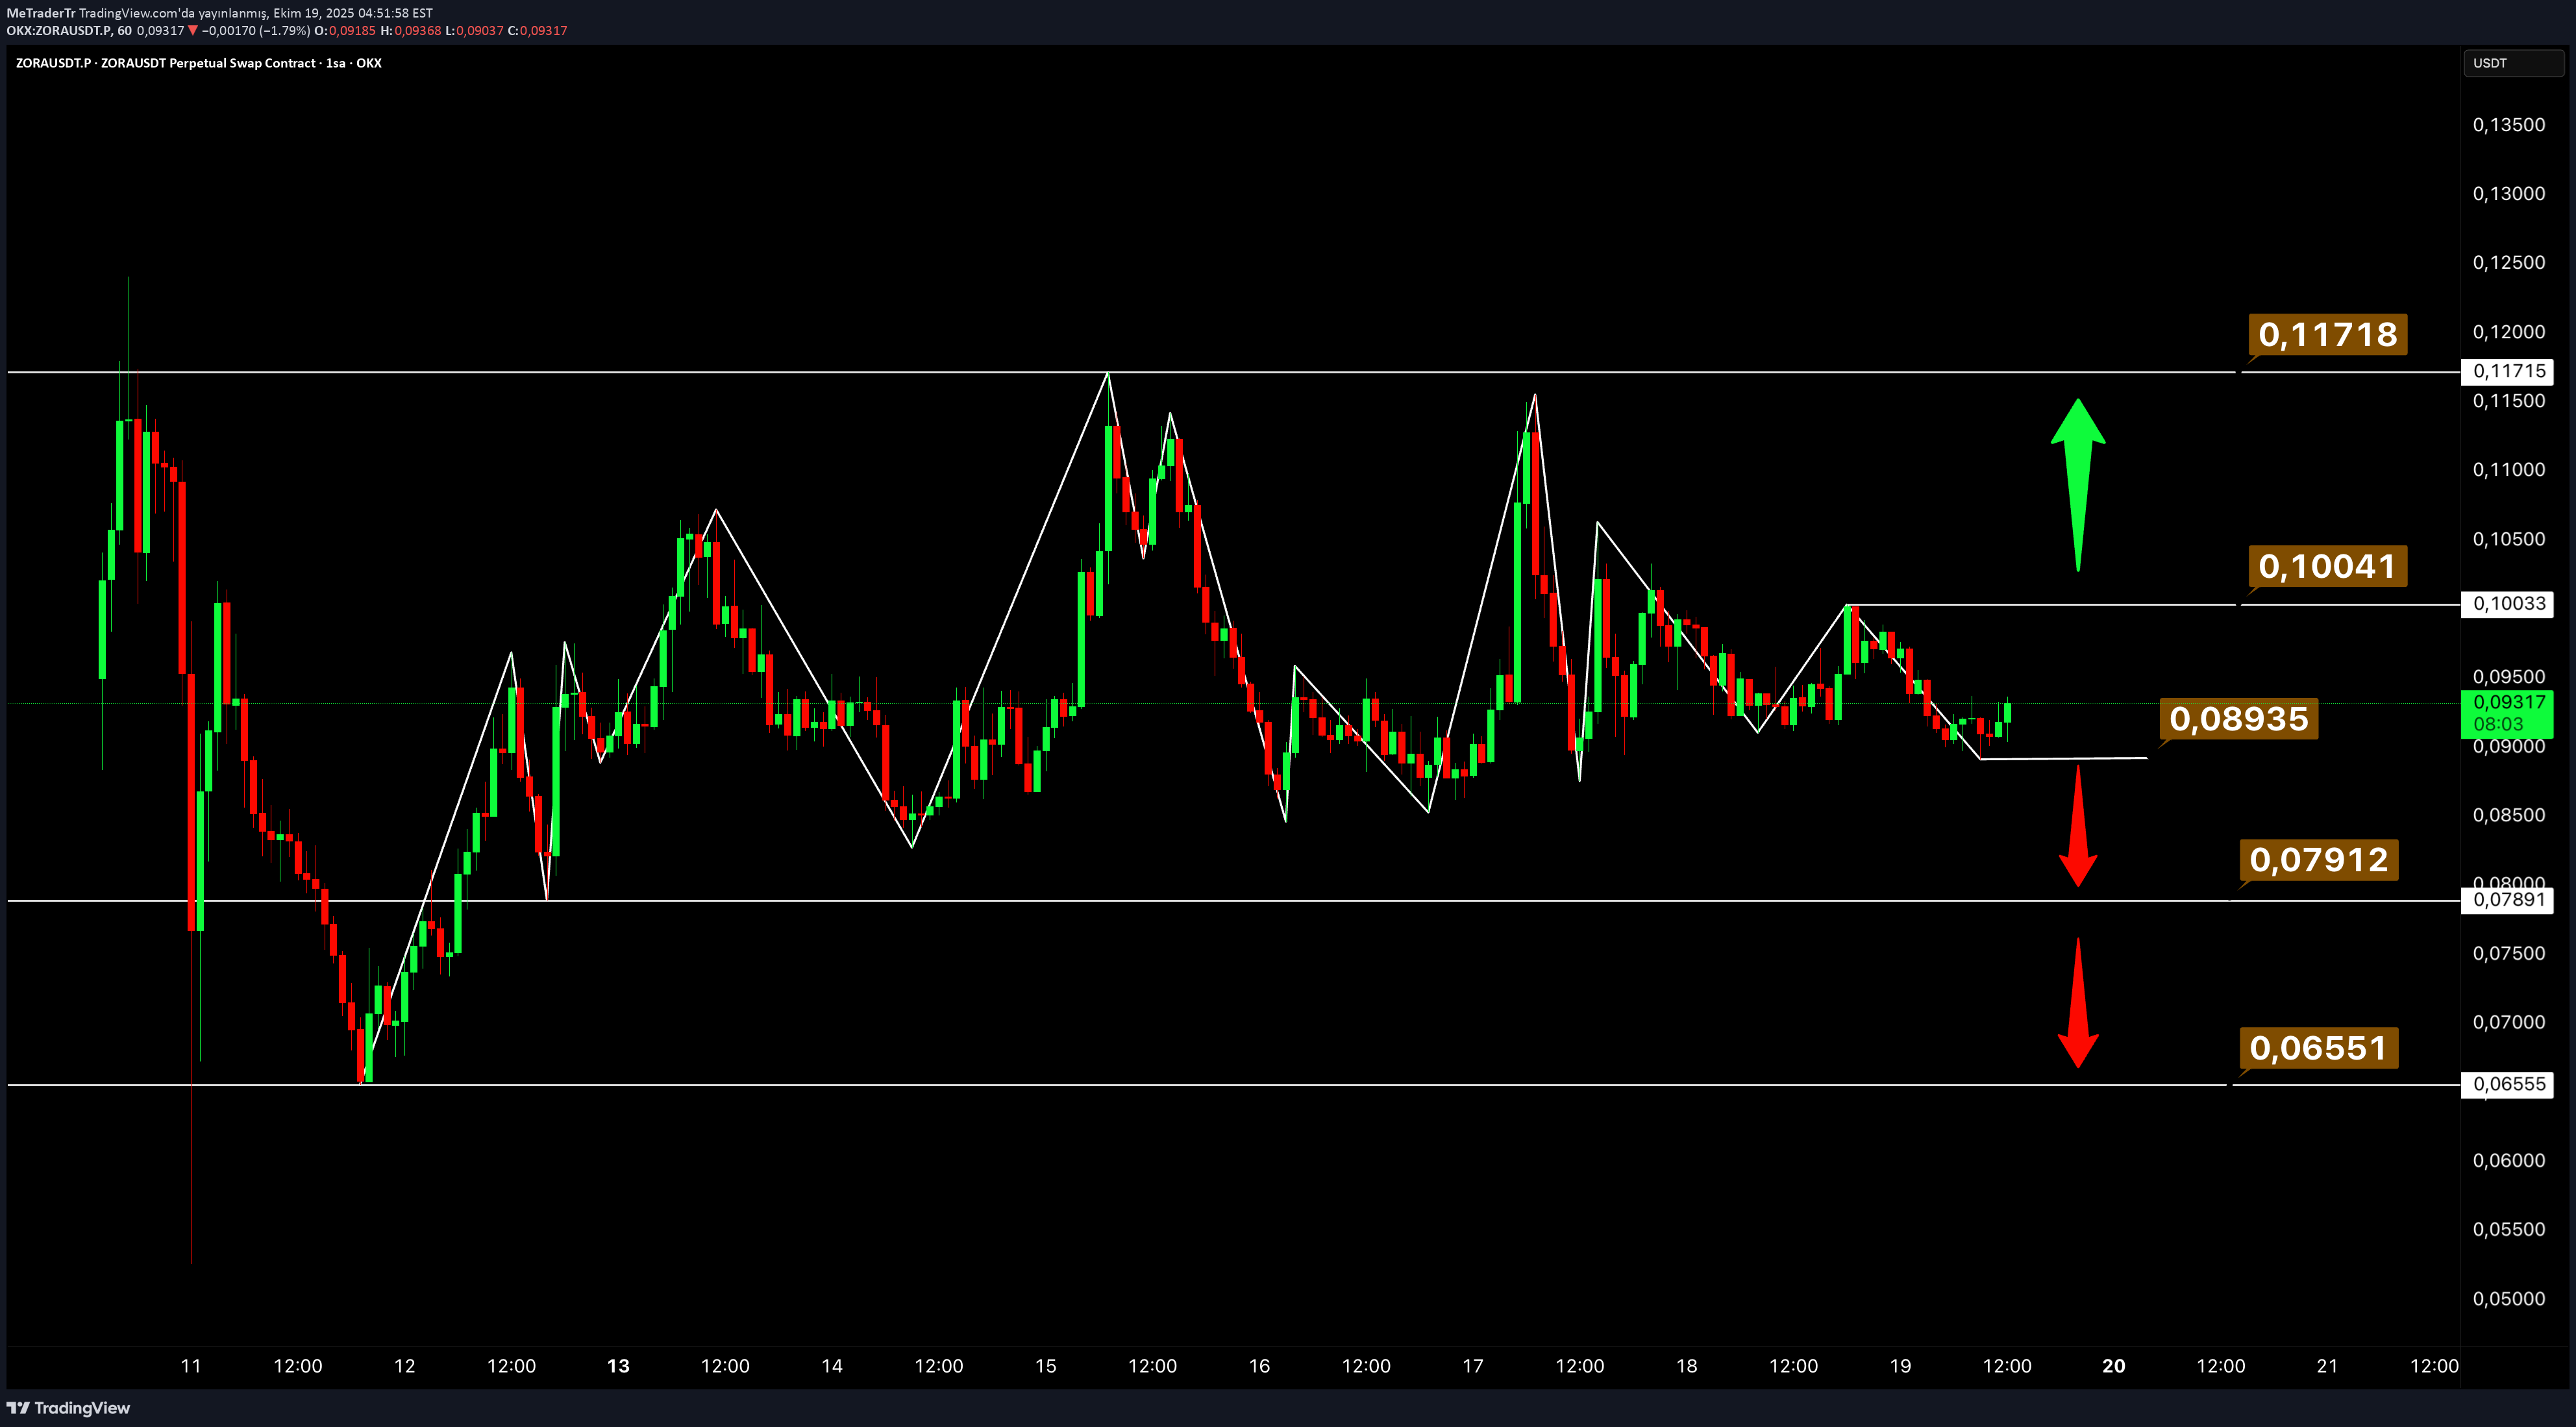
Looking at ZORA's chart, there are actually many trading opportunities with low temporality, but since I made the general analysis with 1 hour temporality, I can see that the bots are constantly popping stops! Transaction Risk is high, but entry and exit can be done with low timeliness... SHORT: Not just breaking the $0.089 levels, but even the theme is enough for short!!! LONG: If there are 2 15-minute candle closings at the $0.1004 level, they will increase it to 0.1171 levels (to get someone in) #ZORA #MT #Trade #Daytrade #Risky #StopLoss #Liqudity
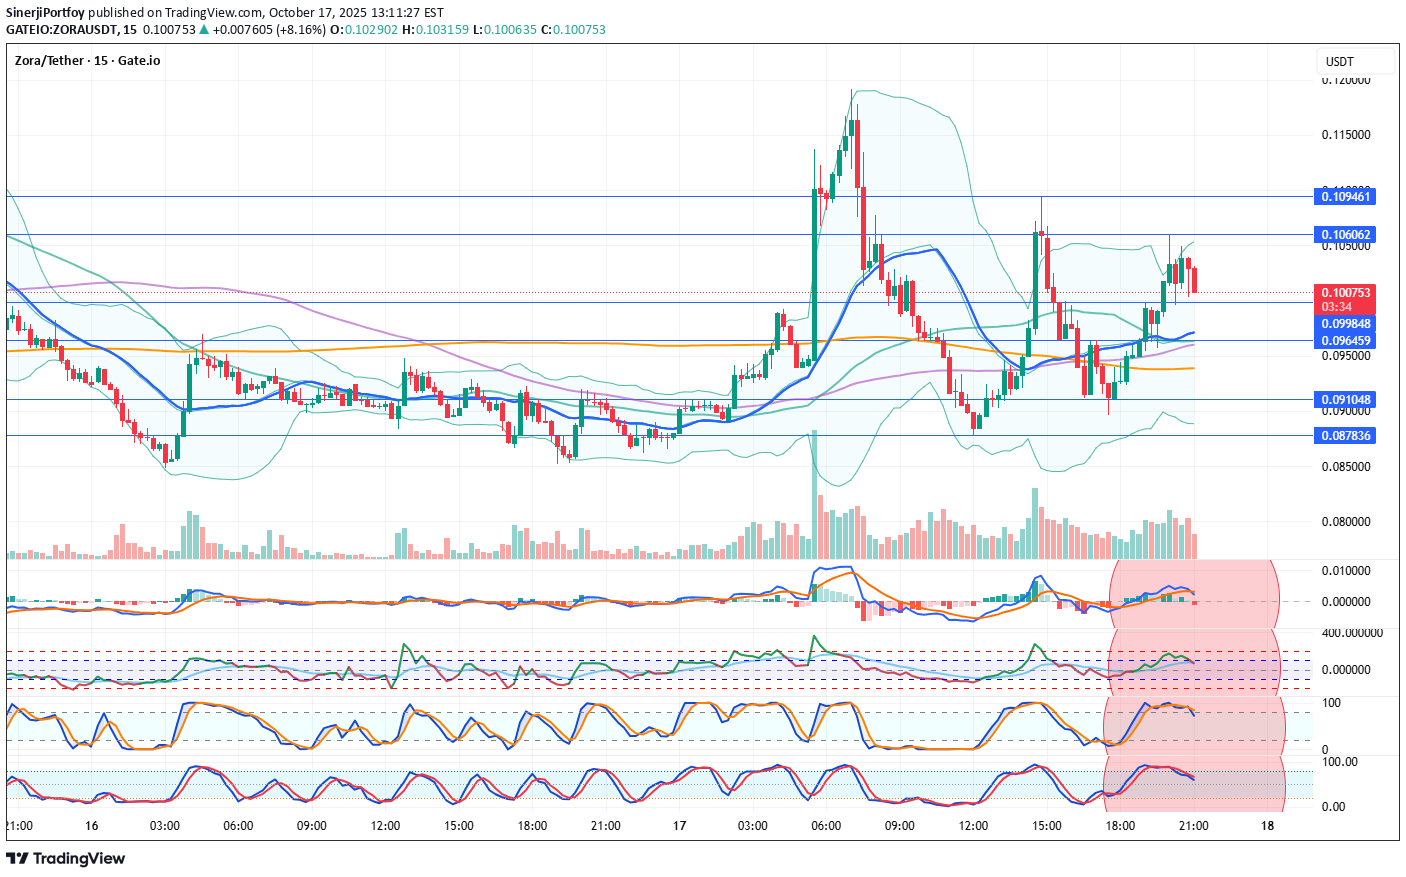
SinerjiPortfoy
تحلیل و پیشبینی قیمت سکه ZORA (ZONAUSDT): آیا زمان خرید فرا رسیده است؟
ZONAUSDT Coin Analysis and Commentary ZORA Coin has broken above its 21-hour moving average (0.097681) on the 15 min. technical chart. Indicators appear to have turned positive. If the support holds, upward price movements may occur. Resistance: 0.103941 – 0.100768 Support: 0.097023 – 0.095786 We’d appreciate it if you could boost our posts and share them on your social media. 🚀 Legal Disclaimer: The information, comments, and recommendations contained herein do not constitute investment advice. Investment advisory services are provided only within the framework of an investment advisory agreement to be signed between the investor and authorized institutions such as brokerage firms, portfolio management companies, and non-deposit banks. The opinions expressed here are personal views and may not be suitable for your financial situation, risk profile, or return preferences. Therefore, no investment decisions should be made based solely on the information and opinions presented on this page.We closed 15 min. analysis. Price broken support prices.

Mike-BTD
زورا پس از سقوط بازار چقدر دوام میآورد؟ هشدارهای مهم تکنیکال

ZORA is still looking strong, but without the rest of the market getting a turn around it will be difficult for Zora to sustain the move up, never mind continue. The current consolidation is symmetrical-triangular in nature; however, the strong wick sell pressure and the signs of divergence on momentum do not look good. Being defensive of any gains would be wise.
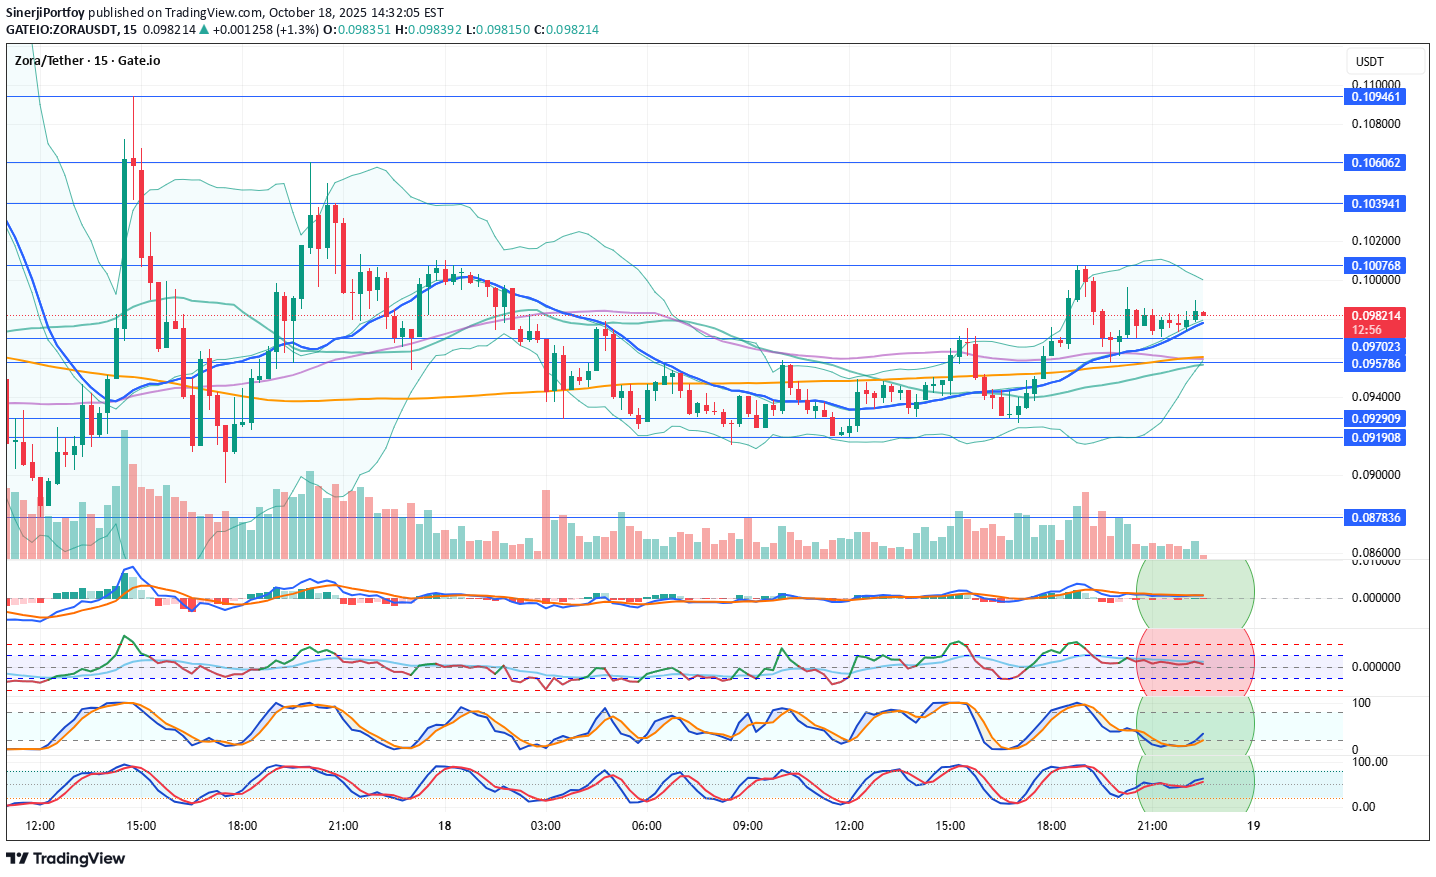
SinerjiPortfoy
تحلیل فوری ارز زورا (ZORAUSDT): فشار فروش بالا رفت؛ منتظر چه سطوحی باشیم؟
ZORAUSDT Coin Analysis and Commentary Indicators for Zora Coin are currently negative. On the 15-minute technical chart, selling pressure is increasing. The coin has turned downward from the 0.106 resistance level, entering a negative phase. Additional selling may occur in the short term. In this situation, support levels will be closely monitored. Resistances: 0.106062 – 0.109461 Supports: 0.099848 – 0.096459 – 0.091048 – 0.087836 We’d appreciate it if you could boost our posts and share them on your social media. 🚀 Legal Disclaimer: The information, comments, and recommendations contained herein do not constitute investment advice. Investment advisory services are provided only within the framework of an investment advisory agreement to be signed between the investor and authorized institutions such as brokerage firms, portfolio management companies, and non-deposit banks. The opinions expressed here are personal views and may not be suitable for your financial situation, risk profile, or return preferences. Therefore, no investment decisions should be made based solely on the information and opinions presented on this page.Analysis closed because time passed. Analysis moved in the expected direction
SinerjiPortfoy
تحلیل تکنیکال زورا (ZORA/USDT): آیا این ارز آماده صعود است؟ (سطوح حمایت و مقاومت کلیدی)
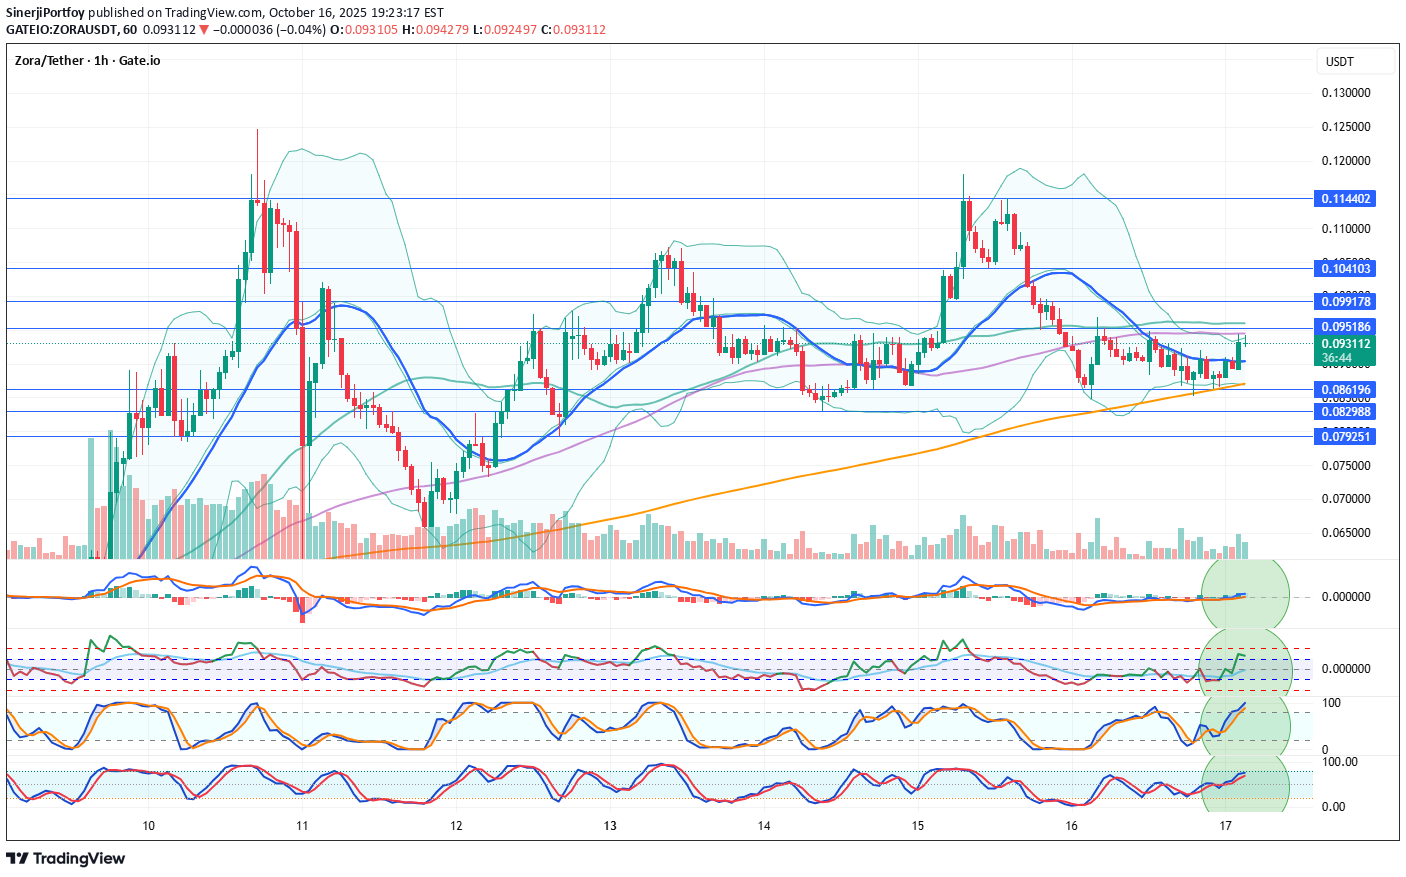
ZONAUSDT Coin Analysis and Commentary ZORA Coin has broken above its 21-hour moving average (0.090380) on the 1-hour technical chart. Indicators appear to have turned positive. If the support holds, upward price movements may occur. Resistance: 0.095186 – 0.099178 – 0.104103 – 0.114402 Support: 0.086196 – 0.082988 – 0.079251 We’d appreciate it if you could boost our posts and share them on your social media. 🚀 Legal Disclaimer: The information, comments, and recommendations contained herein do not constitute investment advice. Investment advisory services are provided only within the framework of an investment advisory agreement to be signed between the investor and authorized institutions such as brokerage firms, portfolio management companies, and non-deposit banks. The opinions expressed here are personal views and may not be suitable for your financial situation, risk profile, or return preferences. Therefore, no investment decisions should be made based solely on the information and opinions presented on this page.In one hour technical again can go up. 15 minut is ok too. Not investment adviceWe closed for share new 15 min. analysis. Check to our account

Tealstreet
زورا (ZORA): بعد از سقوط ۱۲ درصدی، آیا زمان جهش به سمت ۰.۱۵۰ دلار فرا رسیده است؟
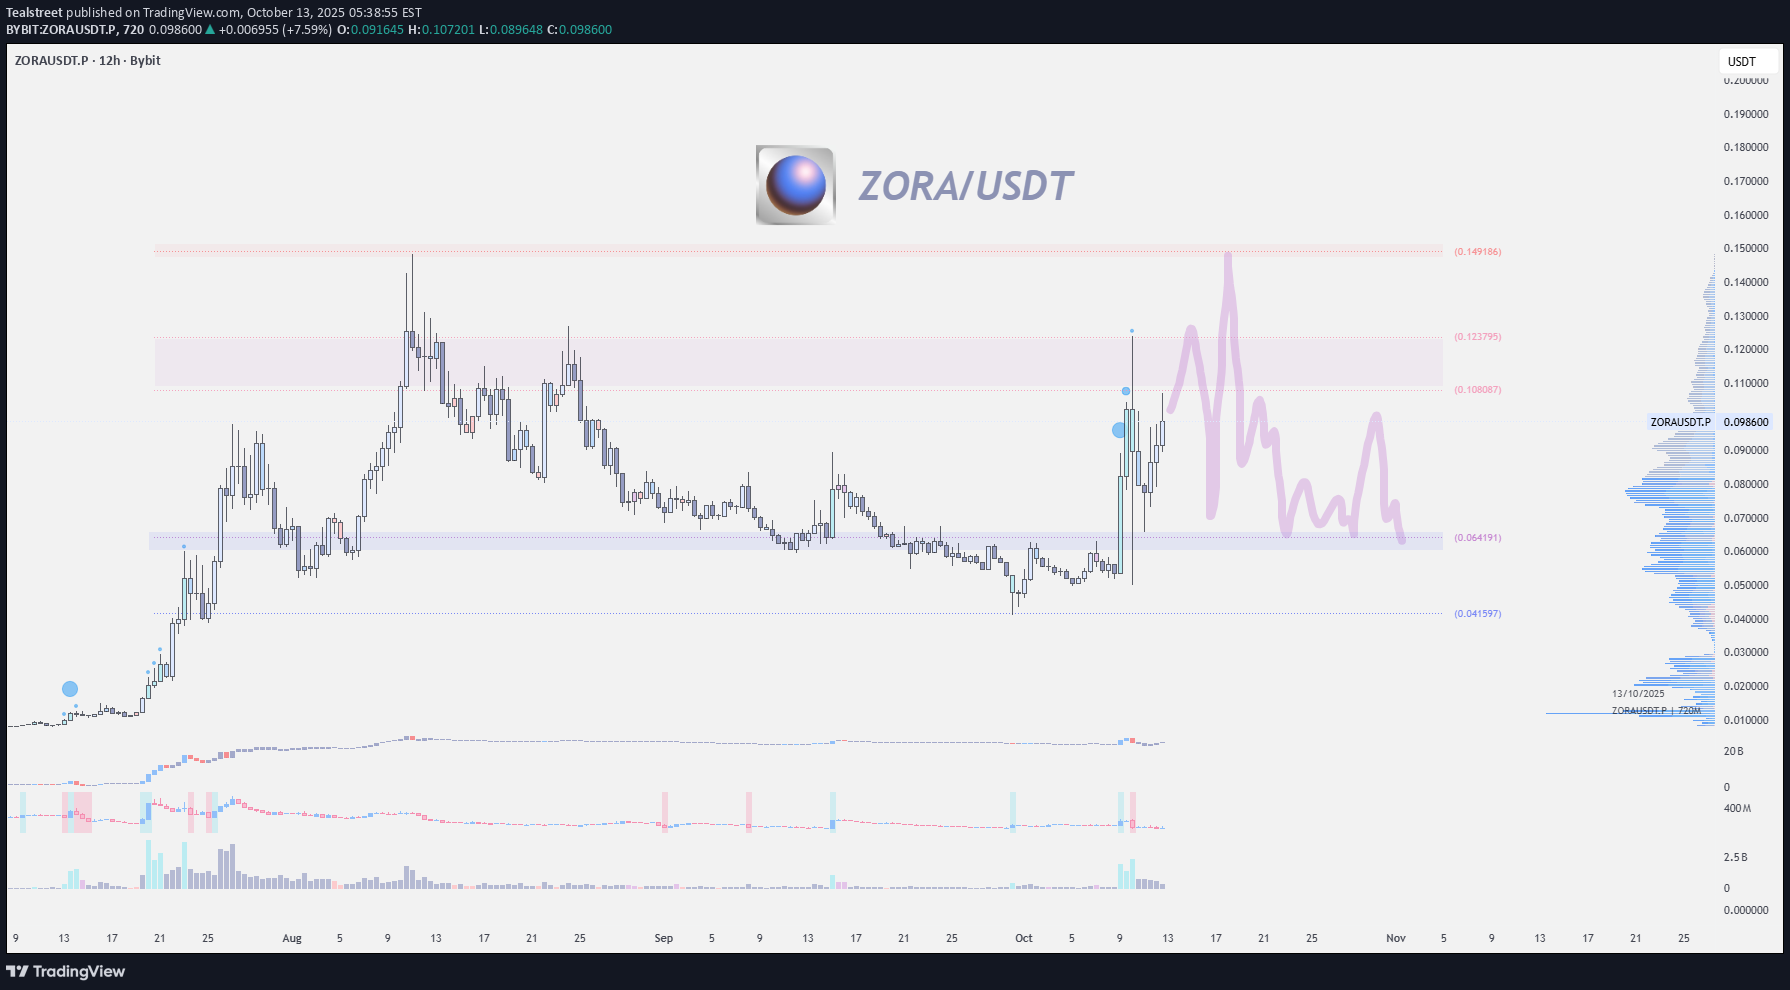
ZORAUSDT | 12h After a sharp -12% flush, ZORA found temporary footing at $0.065, then bounced back toward $0.1072. Bulls are actively defending this zone. A clean breakout above $0.107 could propel price toward $0.126, or even a retest of the $0.150 highs. Momentum remains bullish above $0.060. We can expect some sideways movement between $0.060 and $0.107.

minno91
ادامه صعود زورا (ZORA) در راه است: راز حفظ قیمت و رسیدن به هدف ۱۶۱.۸٪!
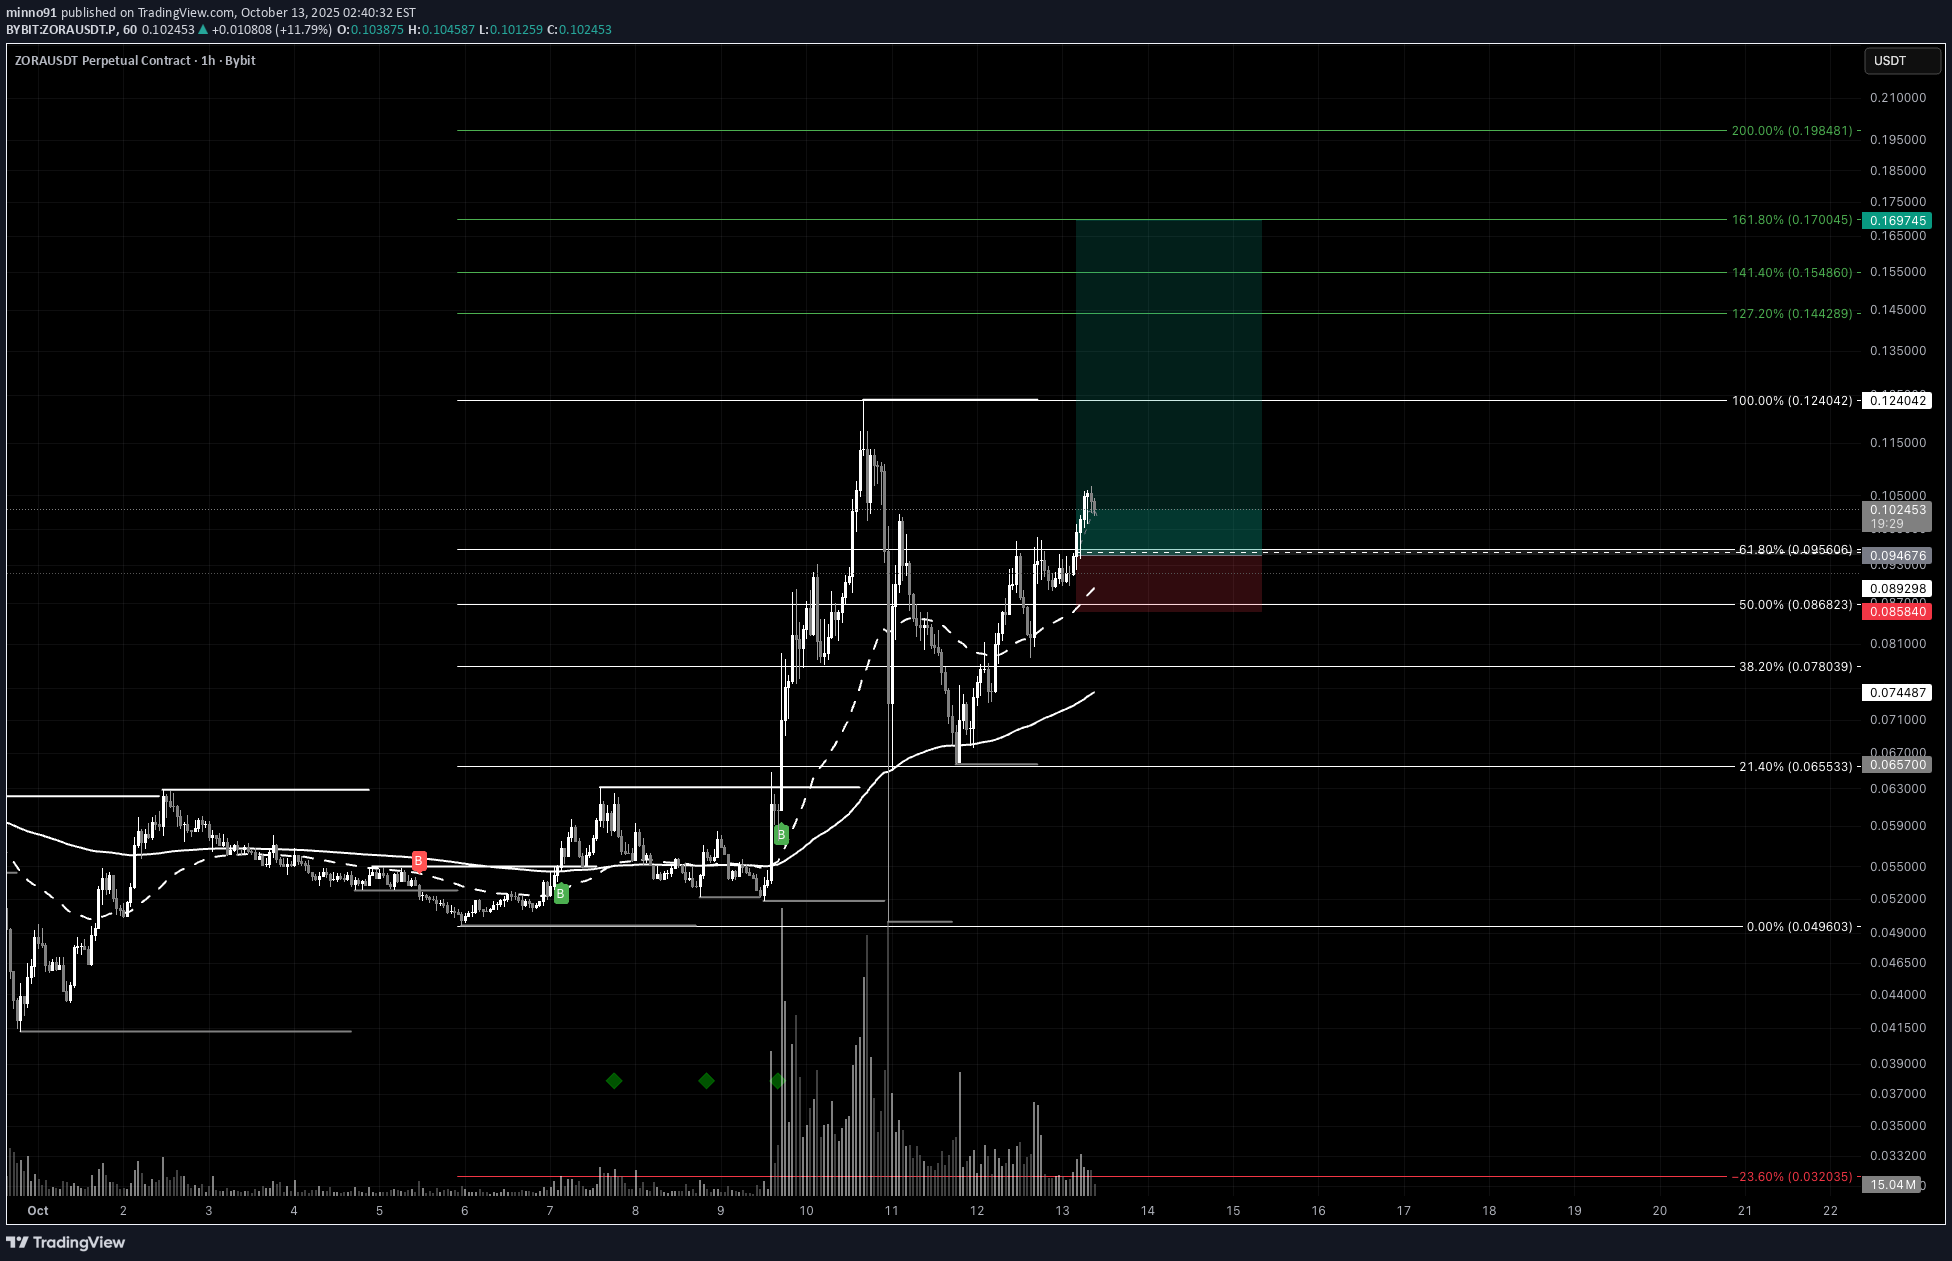
After Friday’s market carnage, ZORA has shown impressive resilience. While many altcoins sold off sharply, ZORA managed to hold key structure and maintain its uptrend from last week. Momentum is gradually returning, and the price action suggests a potential continuation move toward the 161.8% Fibonacci extension, provided volume remains elevated and market sentiment stabilizes. Targets: •1️⃣ 127.2% fib extension → short-term resistance zone •2️⃣ 161.8% fib extension → main target if trend continues Reminder: Manage your risk — volatility is still high after Friday’s flush. Good luck and trade smart. 💪
Disclaimer
Any content and materials included in Sahmeto's website and official communication channels are a compilation of personal opinions and analyses and are not binding. They do not constitute any recommendation for buying, selling, entering or exiting the stock market and cryptocurrency market. Also, all news and analyses included in the website and channels are merely republished information from official and unofficial domestic and foreign sources, and it is obvious that users of the said content are responsible for following up and ensuring the authenticity and accuracy of the materials. Therefore, while disclaiming responsibility, it is declared that the responsibility for any decision-making, action, and potential profit and loss in the capital market and cryptocurrency market lies with the trader.