
SinerjiPortfoy
@t_SinerjiPortfoy

What symbols does the trader recommend buying?
Purchase History
پیام های تریدر
Filter
SinerjiPortfoy
تحلیل زورا (ZORA): آیا حمایت ۰.۰۸۴ شکسته میشود؟ پیشبینی نزولی تا کجا ادامه دارد؟
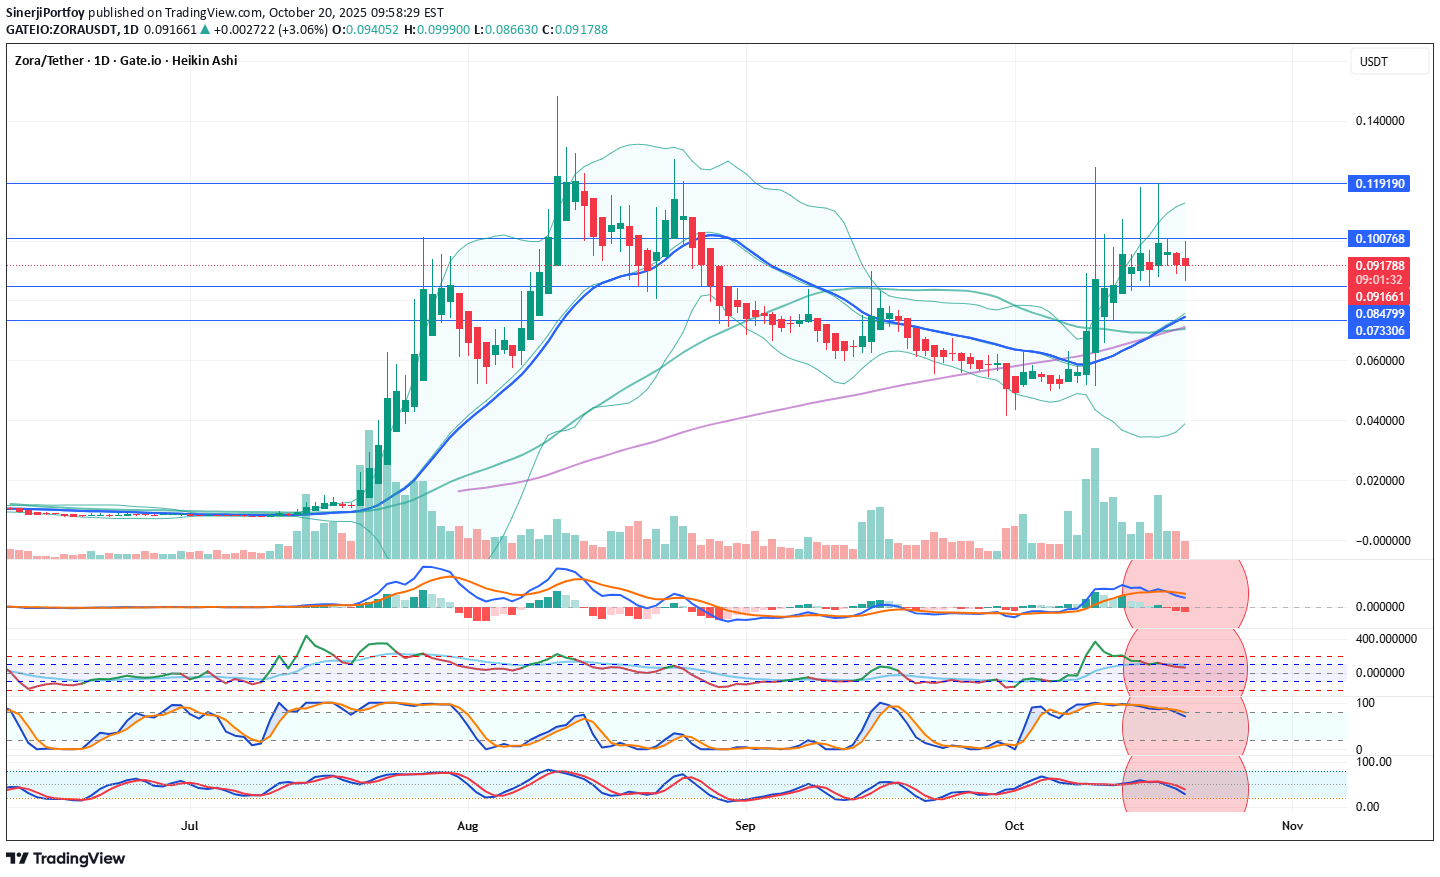
ZONAUSDT Coin Analysis and Commentary ZORA Coin indicators are currently in a negative condition. In the daily technical outlook, selling pressure is expected to continue. In a possible pullback, the 0.08479 support level will be monitored. If this level is broken downward, a decline toward the 21-day moving average (0.074807) may occur. If the price stabilizes around this average, it could create an opportunity for another upward move in the coming weeks. In a potential positive scenario, the 0.100768 resistance level is significant, and the price must break above it. Due to the negative indicators, our overall outlook for ZORA Coin remains bearish. Resistance: 0,100768 - 0,119190 Support: 0,084799 - 0,73306 We’d appreciate it if you could boost our posts and share them on your social media. 🚀 Legal Disclaimer: The information, comments, and recommendations contained herein do not constitute investment advice. Investment advisory services are provided only within the framework of an investment advisory agreement to be signed between the investor and authorized institutions such as brokerage firms, portfolio management companies, and non-deposit banks. The opinions expressed here are personal views and may not be suitable for your financial situation, risk profile, or return preferences. Therefore, no investment decisions should be made based solely on the information and opinions presented on this page.
SinerjiPortfoy
تحلیل و پیشبینی قیمت سکه ZORA (ZONAUSDT): آیا زمان خرید فرا رسیده است؟
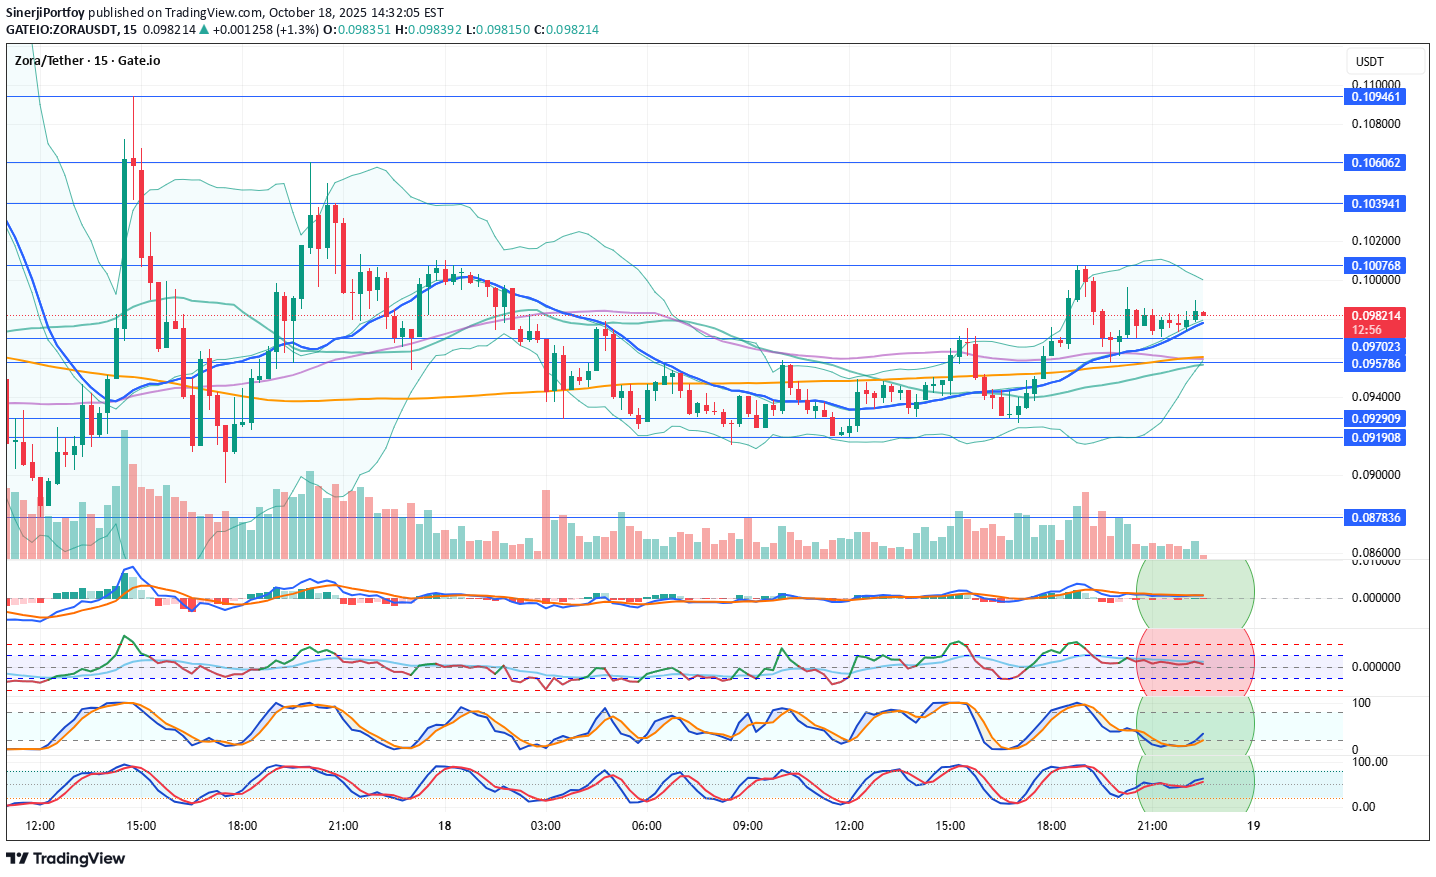
ZONAUSDT Coin Analysis and Commentary ZORA Coin has broken above its 21-hour moving average (0.097681) on the 15 min. technical chart. Indicators appear to have turned positive. If the support holds, upward price movements may occur. Resistance: 0.103941 – 0.100768 Support: 0.097023 – 0.095786 We’d appreciate it if you could boost our posts and share them on your social media. 🚀 Legal Disclaimer: The information, comments, and recommendations contained herein do not constitute investment advice. Investment advisory services are provided only within the framework of an investment advisory agreement to be signed between the investor and authorized institutions such as brokerage firms, portfolio management companies, and non-deposit banks. The opinions expressed here are personal views and may not be suitable for your financial situation, risk profile, or return preferences. Therefore, no investment decisions should be made based solely on the information and opinions presented on this page.We closed 15 min. analysis. Price broken support prices.
SinerjiPortfoy
تحلیل فوری ارز زورا (ZORAUSDT): فشار فروش بالا رفت؛ منتظر چه سطوحی باشیم؟
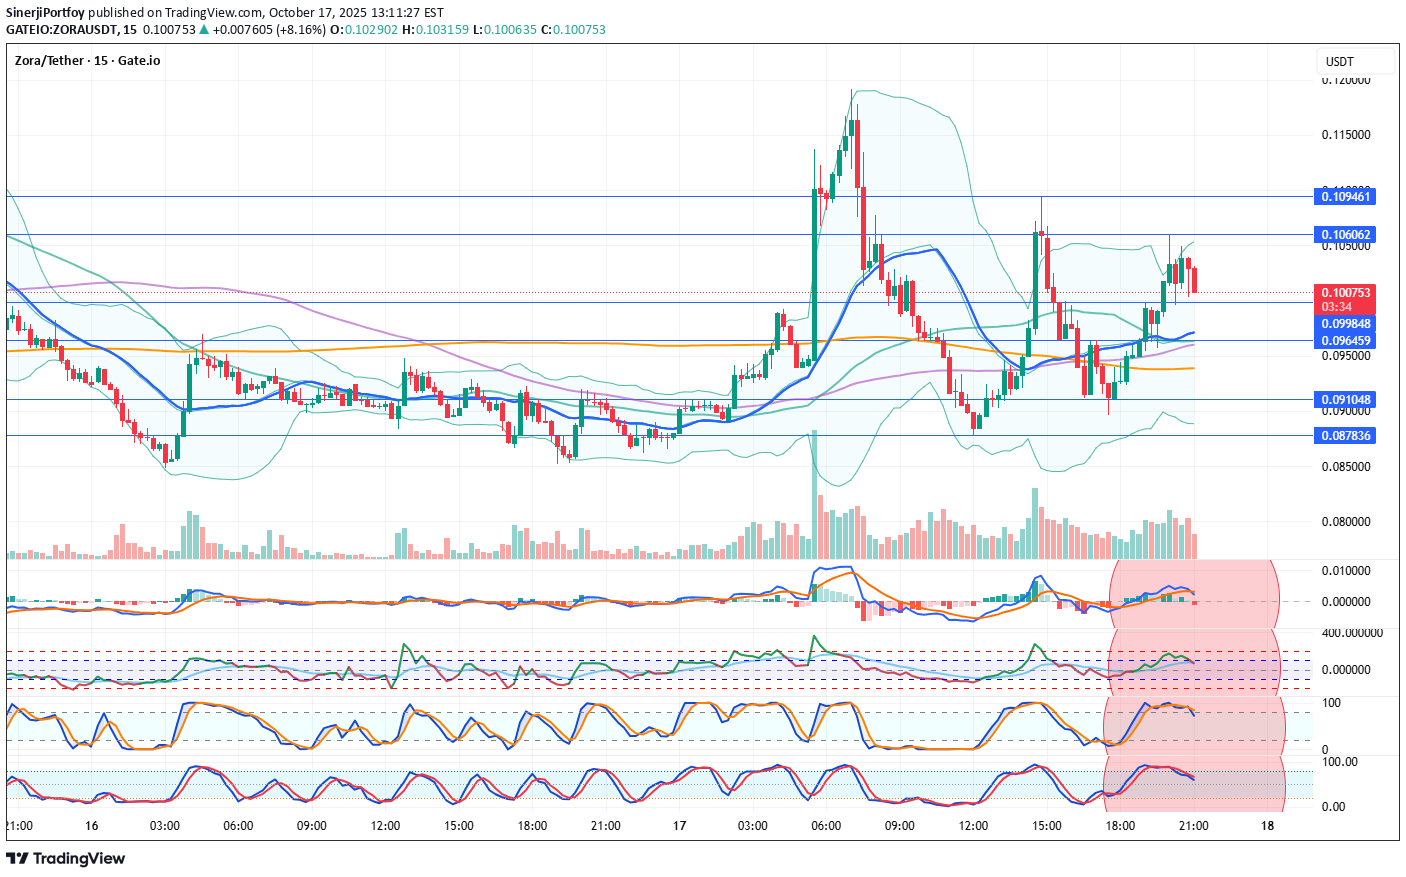
ZORAUSDT Coin Analysis and Commentary Indicators for Zora Coin are currently negative. On the 15-minute technical chart, selling pressure is increasing. The coin has turned downward from the 0.106 resistance level, entering a negative phase. Additional selling may occur in the short term. In this situation, support levels will be closely monitored. Resistances: 0.106062 – 0.109461 Supports: 0.099848 – 0.096459 – 0.091048 – 0.087836 We’d appreciate it if you could boost our posts and share them on your social media. 🚀 Legal Disclaimer: The information, comments, and recommendations contained herein do not constitute investment advice. Investment advisory services are provided only within the framework of an investment advisory agreement to be signed between the investor and authorized institutions such as brokerage firms, portfolio management companies, and non-deposit banks. The opinions expressed here are personal views and may not be suitable for your financial situation, risk profile, or return preferences. Therefore, no investment decisions should be made based solely on the information and opinions presented on this page.Analysis closed because time passed. Analysis moved in the expected direction
SinerjiPortfoy
تحلیل تکنیکال زورا (ZORA/USDT): آیا این ارز آماده صعود است؟ (سطوح حمایت و مقاومت کلیدی)
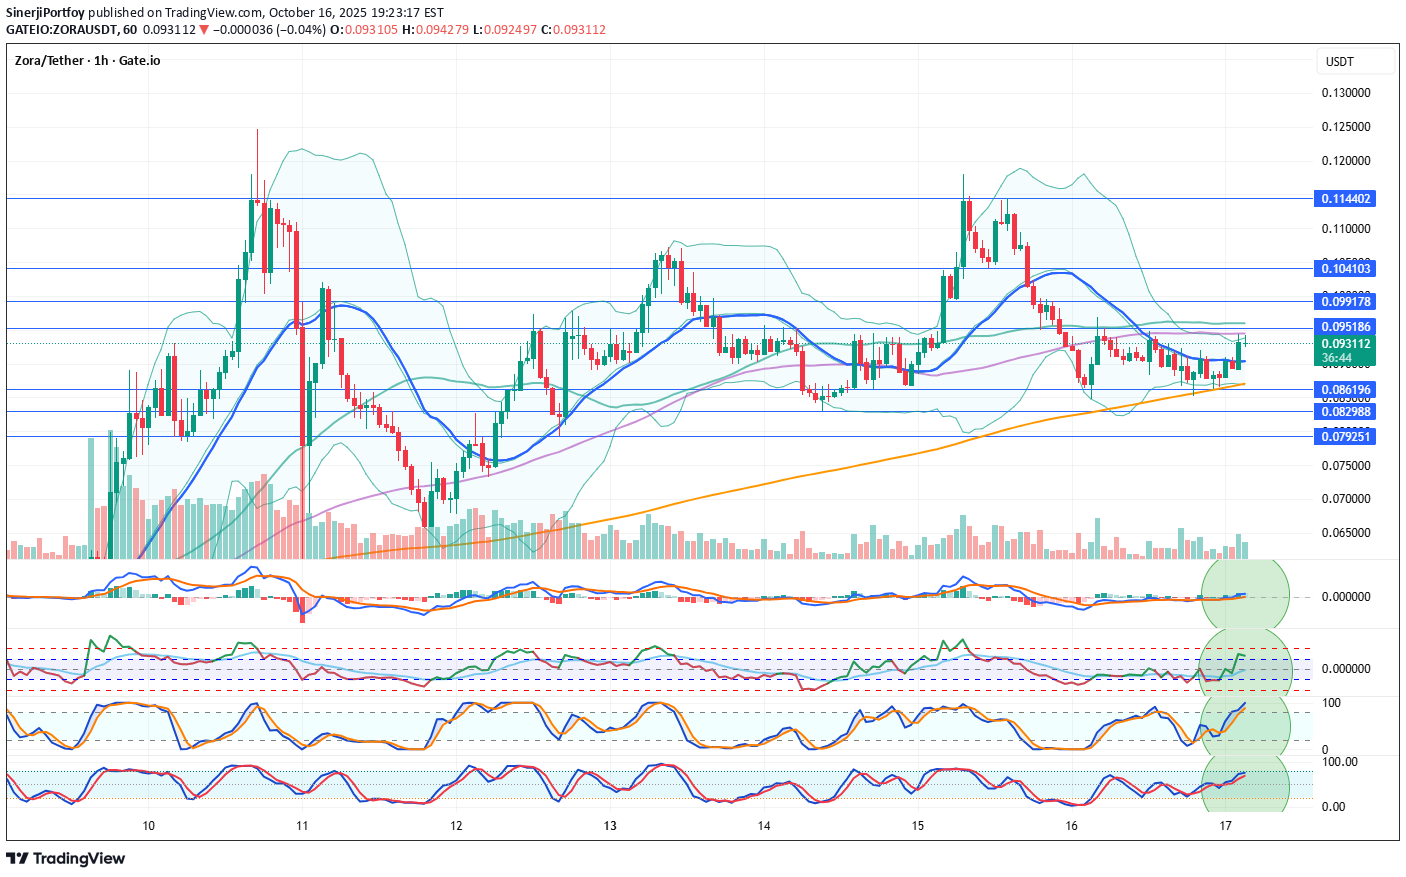
ZONAUSDT Coin Analysis and Commentary ZORA Coin has broken above its 21-hour moving average (0.090380) on the 1-hour technical chart. Indicators appear to have turned positive. If the support holds, upward price movements may occur. Resistance: 0.095186 – 0.099178 – 0.104103 – 0.114402 Support: 0.086196 – 0.082988 – 0.079251 We’d appreciate it if you could boost our posts and share them on your social media. 🚀 Legal Disclaimer: The information, comments, and recommendations contained herein do not constitute investment advice. Investment advisory services are provided only within the framework of an investment advisory agreement to be signed between the investor and authorized institutions such as brokerage firms, portfolio management companies, and non-deposit banks. The opinions expressed here are personal views and may not be suitable for your financial situation, risk profile, or return preferences. Therefore, no investment decisions should be made based solely on the information and opinions presented on this page.In one hour technical again can go up. 15 minut is ok too. Not investment adviceWe closed for share new 15 min. analysis. Check to our account
SinerjiPortfoy
تحلیل اونس طلا (XAUUSD): آیا حباب در اوج است؟ هشدار سقوط بزرگ!

XAUUSD Gold Stock Analysis Comment Daily technical indicators are Positive at the peak level. Extreme increases in gold ounces continue. When such rises come, a sharp decline may occur due to profit sales. Gold is at the top of the Bollinger band. At its peak price. It is far away from the 200 and 100 day price averages (3234 - 34692). It is even away from the 21-day price average (3799). We do not know how long the rises can continue, but with excessive rises, the risk of decline increases, technically, within this risk. A possible decline may create the possibility of a correction up to the 21-day price average, which is the support level of 3791. In addition, when we look at the world-wide ounce gold on a yearly basis, it has increased excessively. In historical data, you can go back to 1977 and see the extreme increases and long-term decreases there. We recommend caution. There is a rise that is on everyone's lips. This is a situation that will reach satisfaction at some point and be replaced by disappointment. In short, it's like entering a stock at its highest level. Resistors: 4059 Supports: 3897 - 3791 - 3707 We would be happy if you rocket our shares. Don't forget to share it on your social accounts too. Disclaimer: The information, comments and recommendations contained herein are not within the scope of investment consultancy. Investment consultancy service is provided within the framework of the investment consultancy agreement to be signed between brokerage firms, portfolio management companies, banks that do not accept deposits and the customer. What is written on this page are only personal opinions. These views may not be appropriate to your financial situation and risk and return preferences. For this reason, investments should not be made based on the information and articles on this page.
SinerjiPortfoy
XAUUSD Spot Altın Analiz Yorum
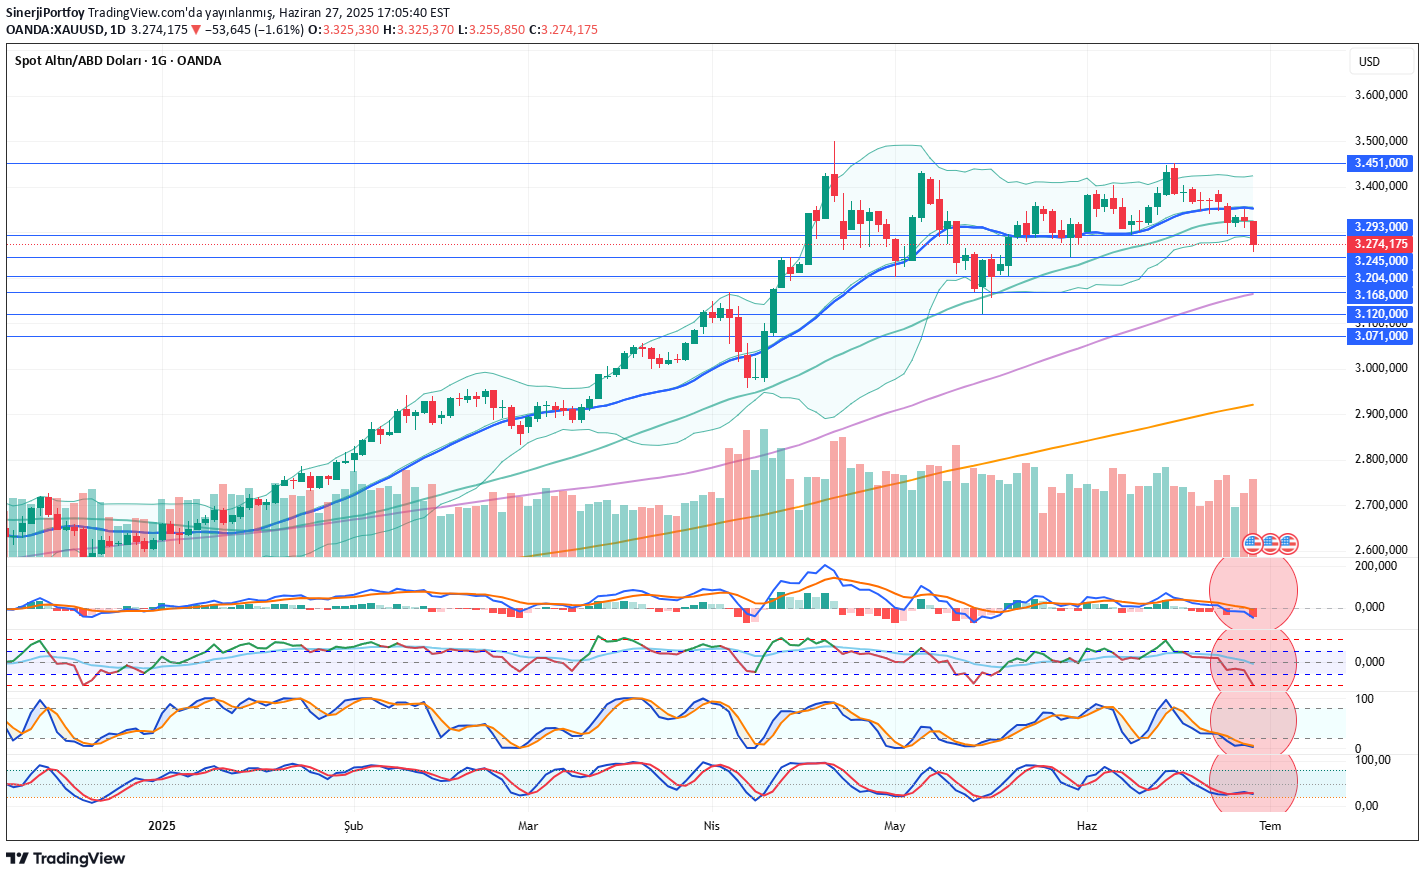
XAUUSD Spot Gold Analysis Comments on the Technical Indicators Negative. The risk of sales under the spot that breaks the 50 -day average below continues. We think of the possibility of landing until a 100 -day price average. For a long time, gold may also be likely to land up to 3168 support. In the weekly technique, the situation continues negative. Do not forget to share in your social accounts. Investment Consultancy Service is offered within the framework of the investment consultancy agreement to be signed between intermediary institutions, portfolio management companies, banks that do not accept deposits and customer. What is written on this page is only personal views. These opinions may not be suitable for your financial status and risk and return preferences. For this reason, investment should not be made based on the information and articles on this page.
SinerjiPortfoy
PIUSDT Daily Technical Analysis

PIUSDT Daily Technical AnalysisPi Network Coin Indicators Are POSITIVE.The price has broken above the 21-day moving average and successfully held above it. Currently, Pi Network appears to be targeting the $0.905 resistance level. After a wave of profit-taking, its recovery has increased the likelihood of continued positive price action. Resistance levels will be monitored closely. Indicators have turned positive from lower levels and are now pointing upward.Resistance Levels: 0.900 – 0.963 – 0.999Support Levels: 0.830 – 0.810 – 0.787Positive news from the Pi Network team could support further upward price movement. Accumulating Pi Network Coin at these price levels for long-term investment might be considered potentially profitable. However, the decision is entirely yours. This is not financial advice. In the long run, Pi Network Coin may test the $3 levels again — or it might remain at a lower price range.NOT FINANCIAL ADVICEThe information, commentary, and suggestions provided here do not constitute investment advice. Investment advisory services are offered only through a formal agreement with authorized institutions such as brokerage firms, portfolio management companies, or non-deposit banks.The content on this page reflects personal opinions only. These views may not align with your financial situation or your risk and return preferences. Therefore, investment decisions should not be made solely based on the information provided here.If you’d like to stay updated on our technical analyses — whether positive or risky — please follow and like us. We’d really appreciate your support!
SinerjiPortfoy
PIUSDT Günlük Teknik Analiz

تحلیل تکنیکال روزانه PIUSDTسکه پی نتورک: اندیکاتورها مثبت هستند. میانگین قیمت 21 روزه را به سمت بالا شکسته و موفق شده است بالای آن بماند. به نظر می رسد Pi نتورک در حال حاضر به سمت مقاومت 0.905 حرکت می کند. بهبود مجدد پس از فروش سود، احتمال ادامه حرکات مثبت قیمت در Pi کوین را افزایش داده است. مقاومت ها پیگیری شد. اندیکاتورها از موقعیت alt به سمت بالا مثبت شده اند.مقاومت ها: 0.900 - 0.963 - 0.999حمایت ها: 0.830 - 0.810 - 0.787Pi اخبار جدید و مثبت از تیم نتورک کوین می تواند از افزایش قیمت حمایت کند. می توانیم این احتمال را در نظر بگیریم که جمع آوری کوین pi نتورک برای سرمایه گذاری بلندمدت از این سطوح قیمت می تواند سودآور باشد. تصمیم با شماست. این توصیه سرمایه گذاری نیست. این احتمال وجود دارد که در بلندمدت، کوین pi نتورک دوباره سطوح 3 دلاری را آزمایش کند. یا ممکن است در قیمت پایین بماند.توصیه سرمایه گذاری نیست.اطلاعات، نظرات و توصیه های موجود در اینجا در محدوده مشاوره سرمایه گذاری نیست. خدمات مشاوره سرمایه گذاری در چارچوب قرارداد مشاوره سرمایه گذاری که بین مؤسسات کارگزاری، شرکت های مدیریت پورتفوی، بانک هایی که سپرده نمی پذیرند و مشتری امضا می شود، ارائه می شود. مطالب نوشته شده در این صفحه فقط نظرات شخصی است.این نظرات ممکن است با وضعیت مالی، ریسک و ترجیحات بازده شما مطابقت نداشته باشد. بنابراین، نباید بر اساس اطلاعات و نوشته های این صفحه سرمایه گذاری کرد.اگر ما را دنبال کنید و لایک کنید، بسیار خوشحال شد تا تحلیل های ما با اندیکاتورهای تکنیکال مثبت یا پرخطر را از دست ندهید.
SinerjiPortfoy
PIUSDT Daily Technical Analysis

PIUSDT Daily Technical AnalysisPi Network Coin indicators are POSITIVE.It has broken above the 21-day moving average and managed to stay above it.The announcement that the Pi Network team will make about its ecosystem on May 14th could significantly benefit the project and increase activity around the cryptocurrency.Resistance: 0.79028 - 0.90433 - 1.05080Support: 0.68164 - 0.57126 - 0.55010New and positive news from the Pi Network team could support a price increase.At these levels, accumulating Pi Network Coin for long-term investment could be considered potentially profitable. The decision is yours. This is not investment advice.In the long run, there is a possibility that Pi Network Coin could retest the $3 levels.For users who use the Pi app and hold locked Pi Network Coins, if there is no urgent need, they may consider re-locking their coins for another 2 weeks. They can continue this strategy by monitoring the price every two weeks.In the long term, the probability of the price reaching much better levels remains high.THIS IS NOT INVESTMENT ADVICE.The information, comments, and suggestions here do not fall under investment advisory services. Investment advisory services are provided under an agreement between clients and authorized institutions such as brokerage firms, portfolio management companies, and non-deposit banks.The content of this page reflects only personal opinions.These views may not be suitable for your financial situation or your risk and return preferences. Therefore, investment decisions should not be made based solely on the information and content on this page.We’d appreciate it if you could follow and like us so you don’t miss our analyses with positive or risky technical indicators.Pi Network Coin has reached the 1.219 resistance level, and at these levels, the risk of profit-taking has increased. If the support holds, the selling pressure may remain limited. Newly unlocked coins entering the market don't seem to be creating significant selling pressure. The team appears to be managing this situation in a balanced way. Pi Coin, which is set to make an announcement regarding its ecosystem on May 14th, may continue to show positive price movement supported by this anticipation. Once the announcement is made on May 14th, the direction of Pi Coin will likely be determined based on the importance of the statement. Either the upward trend will continue, or profit-taking may occur. This is not financial advice.It is trying to break through the 1.58 resistance level. From time to time, we see some profit-taking, but not enough to significantly affect the price. The 2.0 resistance is an important level. If the price reaches this point, the risk of profit-taking will increase even further.We are updating the resistance and support levels in the analysis:Resistances: 1.580 – 1.729 – 1.798 – 1.979 – 2.005Supports: 1.433 – 1.301 – 1.191 – 1.096 – 0.904After the Pi Network team's announcement regarding the Pi ecosystem on May 14, profit-taking has occurred as expectations have ended. Since the negativity continues for now, we are closing our analysis. Due to the high amount of locked Pi scheduled to be unlocked today and over the next three days, the selling pressure may also be slightly elevated. We will conduct another technical analysis on the daily chart later.
SinerjiPortfoy
ALPACAUSDT HourlyTechnical Analysis

ALPACAUSDT HourlyTechnical AnalysisAlpaca Finance Coin indicators are POSITIVE.The coin saw a strong upward movement following the news of its delisting from Binance. High returns continue in this cryptocurrency. Alpaca Coin, which experiences periodic price surges, is currently priced near its 21-day moving average. Due to low liquidity, it exhibits sharp price movements, making it a favorite among short-term traders.While it appears calm at the moment, we believe Alpaca Finance may resume its upward trend over time.If it breaks above the 21-day moving average, the 0.254 resistance level will be the next target.In the case of sharp sell-offs, the 0.160 support level will be monitored.Based on 2-week price movements, Alpaca has shown returns of 558% - 285% - 93% - 110% - 106% - 61% at various points.This is a high-risk cryptocurrency. This is not investment advice.Resistances: 0.254 - 0.260 - 0.268 - 0.279 - 0.306 - 0.314 - 0.345 - 0.372 - 0.410Supports: 0.220 - 0.205 - 0.160THIS IS NOT INVESTMENT ADVICE.The information, comments, and suggestions here do not constitute investment advisory services. Investment advisory services are provided under a formal agreement between clients and licensed institutions such as brokerage firms, portfolio management companies, and non-deposit banks.The content on this page reflects only personal opinions. These opinions may not be suitable for your financial situation or your risk and return preferences. Therefore, investment decisions should not be made solely based on the information and commentary provided on this page.We’d appreciate it if you follow and like us so you don’t miss our analyses with positive or risky technical indicators."On the hourly chart, Alpaca Finance Coin has broken below the 0.220 support level and is now moving sideways above the 0.205 support. As the trading volume decreases, the Bollinger Band range has also started to narrow. This may indicate an increased risk of a breakout in either direction in the near future. If it can break above the 21-day moving average, the support may shift upward. THIS IS NOT INVESTMENT ADVICE."Analysis stayed old because hourly technical analysis. After we will do new analysis
Disclaimer
Any content and materials included in Sahmeto's website and official communication channels are a compilation of personal opinions and analyses and are not binding. They do not constitute any recommendation for buying, selling, entering or exiting the stock market and cryptocurrency market. Also, all news and analyses included in the website and channels are merely republished information from official and unofficial domestic and foreign sources, and it is obvious that users of the said content are responsible for following up and ensuring the authenticity and accuracy of the materials. Therefore, while disclaiming responsibility, it is declared that the responsibility for any decision-making, action, and potential profit and loss in the capital market and cryptocurrency market lies with the trader.