
aipedia
@t_aipedia

What symbols does the trader recommend buying?
Purchase History
پیام های تریدر
Filter
aipedia
تحلیل طلایی اتریوم (ETH): ورود هوشمندانه با تکنیک اسمارت مانی و سود تقریباً دو برابری!
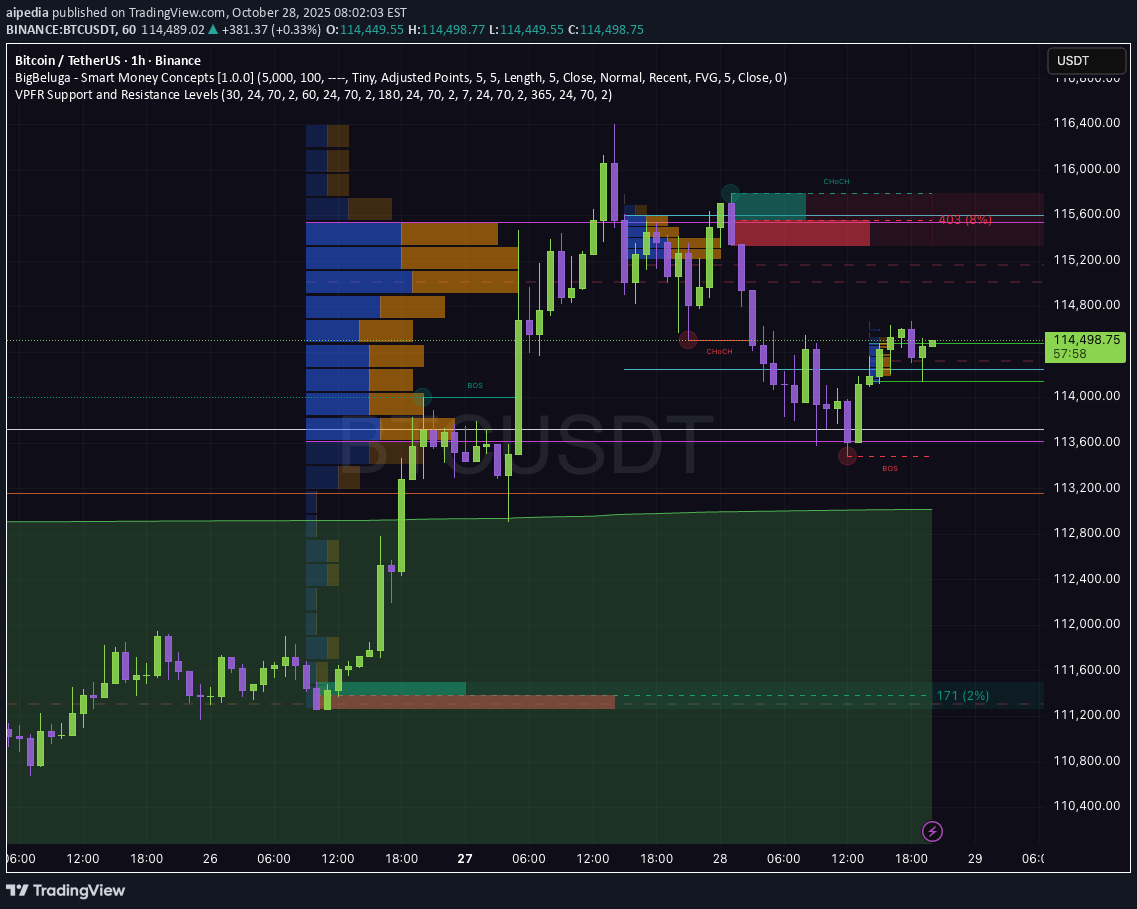
💰 Symbol: ETHUSDT.P (Binance) ⏰ Timeframe: 1H 📊 Current Price: $4,124.58 📈 Technical Analysis: Current market structure shows bullish momentum, supported by institutional buying at these levels. The main indicators in play are BigBeluga Smart Money Concepts and VPFR Support/Resistance, confirming volume areas and clear entry/exit zones. 🔍 Setup Details: - Entry (Buy): Around $4,124–$4,125 - **TP (Take Profit):** $4,216.64 (Target zone, +4%) - **SL (Stop Loss):** $3,972.13 (Safe support/volume cutoff) - **Risk/Reward Ratio:** 1.97 (Targeting almost 2x reward vs. risk, statistically optimal) 🔎 VPFR/POC Levels: - Upper POC: $4,159.35 → major upper volume node, significant resistance to watch - Lower POC: $4,110.21 → supports accumulation thesis 📝 Chart Notes: - Target: 162.07 (4%) | Amount: 1491.48 | Red resistance/volume zone noted as primary TP. - Stop: 82.44 (2.03%) | Amount: 750 | Purple support considered as SL. - Open P&L: 70.01 | QTY: 3.03 🎯 Trade Plan: - Entry: Buy when price sustains above $4,110 with bullish confirmation. - SL below major volume support, TP at upper resistance or breakout target. ⚠️ Risk Disclaimer: This is not financial advice. Always do your own due diligence and adjust your sizing according to your personal risk profile.
aipedia
تحلیل کامل جفت ارز ZORA/USDT: آمادهسازی برای صعود در صرافی MEXC (تارگت ۰.۰۹۶۰)
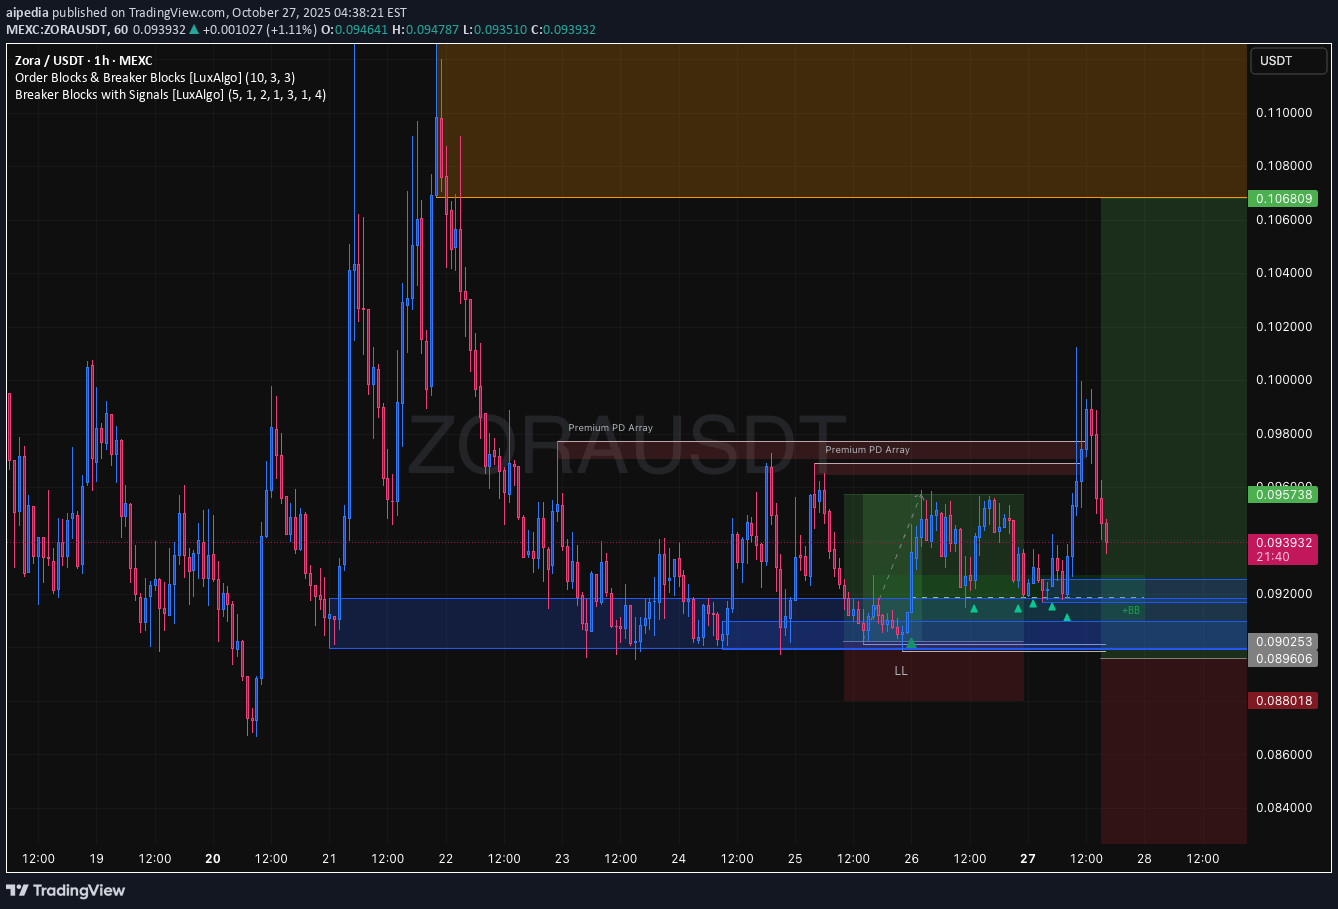
Clear bullish momentum spotted on ZORAUSDT (1h, MEXC). Setup leans on structure and reaction to recent levels. Analysis: Trend: Price is showing near-term bullish continuation, supported by higher lows and rejection wicks on current candles. Support Zone: Strong buying interest near the 0.0935–0.0940 region. Recent candles confirm buyers stepping in. Resistance: Next clear resistance around 0.0950–0.0960 as shown by previous highs and market reactions. Volume: Slight uptick on green candles, indicating healthy participation. Trade Plan: Long Bias Entry: 0.0941–0.0942 (on retest or minor dip) Stop: Below 0.0935 (invalidate if price closes below recent support) Target(s): First TP at 0.0950, extended target near 0.0960 Invalidation: Setups invalid if breakdown below 0.0935 area on strong volume. Reasoning: Setup is based on price structure, reaction at support, and minor volume confirmation. No confirmation = no trade. Risk should be strictly managed. Disclaimer: Not financial advice. Purely an analytical setup for study purposes.
aipedia
پیشنهاد فروش اتریوم (ETH) در 4 ساعته: فرصت ترید با ریسک به ریوارد عالی!
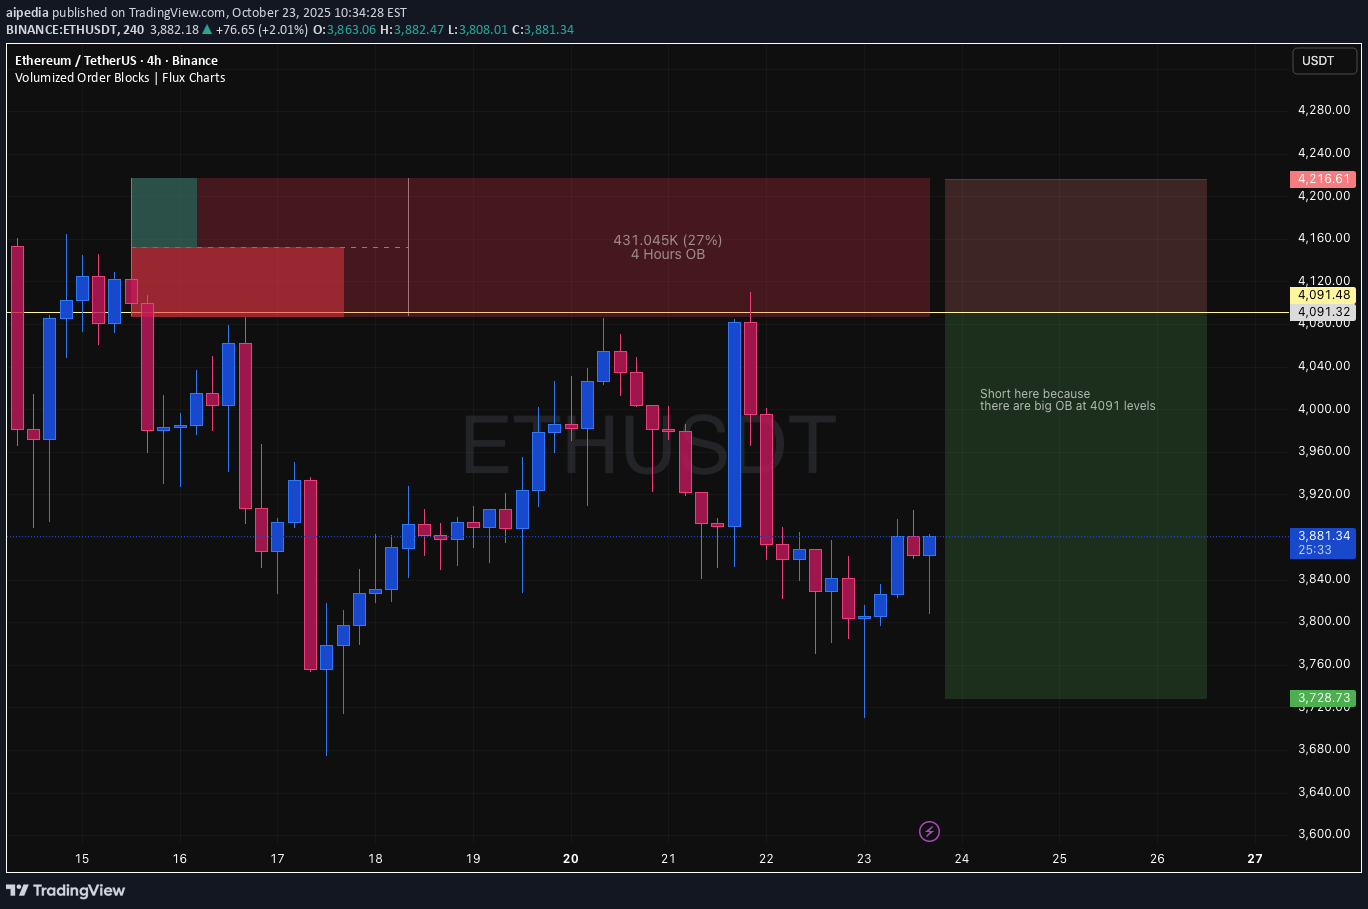
Symbol: ETHUSDT (BINANCE) Trade Type: Short Timeframe: 4 Hour (4H) Setup Details: Entry: Short at 4091 (identified order block/OB level). Stop Loss: 4216 (above OB, outside wick traps, 3.06% risk). Target: 3728 (major support, large RR potential: 2.89). Rationale: There is a significant order block resistance at 4091, historically rejected. Price recently touched and failed to break above here, giving textbook risk/reward for shorting. Conditional: If candle closes convincingly above 4091 or OB structure shifts bullish, exit trade and wait for confirmation. Position Size/Leverage: Size appropriately so stop loss is not account-threatening. Avoid over-leverage given proximity to major level. Notes: Do NOT hold if obvious breakout above 4091 or aggressive volume enters. Consider partial profit at 3840 for risk management; full TP at 3728 on momentum flush. Tags: #ETHUSDT #OrderBlock #Short #4H #TradingIdea Visual: Chart shows RR box and marked OB. Text: “Short here because there are big OB at 4091 levels.”
aipedia
سیگنال خرید MYX/USDT: سود عالی با استفاده از تحلیل حجم و نقاط کنترل (تایم فریم 1 ساعته)

This setup captures a technical trade opportunity on the MYX/USDT pair using a 1-hour chart, with a focus on market structure, volume profile fixed range (VPFR), and point of control (POC) levels for confluence. Chart Context: The trend preceding this setup is a pronounced bearish move, with sellers dominating and price breaking down key support zones. Recent candles show compression and attempted base-building around the 2.67–2.70 regions, with visible lower wicks indicating buying interest. Key Levels: Major Support Zone: 2.665–2.670 (Converges with local POC – strong liquidity area, potential demand absorption) Entry Zone: Entry taken after an LTF (lower timeframe) rejection below support, followed by quick reclaim above the VPFR support band First POC Target: 2.713 (minor intraday resistance to monitor) Main TP Zone / Target: 2.854 (next POC cluster, marking significant resistance with high previous volume transacted) Ultimate Target: 2.88–2.90 (final take profit, matches major historical resistance and aligns with the VPFR high range) Stop Loss: Just below 2.665 (invalidates the setup if reclaimed by sellers, shows failed demand zone) Strategy Rationale: Mean Reversion Play: The trade aims to capture a reversion to the mean after extended selling, targeting price inefficiencies left in the breakdown. Volume & POC Confluence: Entry leverages the recent POC as dynamic support. Price closure and holding above these high-volume nodes signal absorption of selling and willingness to move higher. Risk/Reward: The stop is placed logically under local support, and risk/reward is skewed positively (target RR > 2:1). Invalidation: A 1H close below the support/POC level invalidates the trade thesis and triggers the stop. Execution Notes: Watch for high sell spikes or sudden liquidation below support prior to entry; ideal scenario is a fast wick-and-reclaim. Scale out partial profits at interim resistance (2.713), lock the remainder towards higher POC/take profit zones. Remain adaptive; if price stalls at 2.713 for multiple candles, consider tightening stops. Antifragile Angle: This setup is built on clear structural invalidation and risk-defined entry, not chasing momentum. If it fails, the loss is limited and re-entry is possible on new reclaim signals. If successful, convexity comes from capturing a sharp reversal move off high liquidity.
Disclaimer
Any content and materials included in Sahmeto's website and official communication channels are a compilation of personal opinions and analyses and are not binding. They do not constitute any recommendation for buying, selling, entering or exiting the stock market and cryptocurrency market. Also, all news and analyses included in the website and channels are merely republished information from official and unofficial domestic and foreign sources, and it is obvious that users of the said content are responsible for following up and ensuring the authenticity and accuracy of the materials. Therefore, while disclaiming responsibility, it is declared that the responsibility for any decision-making, action, and potential profit and loss in the capital market and cryptocurrency market lies with the trader.