
MeTraderTr
@t_MeTraderTr

What symbols does the trader recommend buying?
Purchase History
پیام های تریدر
Filter
MeTraderTr
#XAU -ALTIN- |(TOBO) Devam Senaryosu ve Double FVG Riski DİKKAT

Altın için 4.534$ seviyesi net bir direnç alanı konumunda ve bu bölgeden gelen satışla birlikte piyasada ters omuz baş omuz (TOBO) formasyonunun oluştuğunu görüyoruz... -TOBO- formasyonlarında normal şartlarda boyun çizgisi derinliği kadar bir yükseliş beklenir. Ancak mevcut fiyatlama, bu yükselişi tamamlanmış saydırmıyor. Bunun temel nedeni, üst tarafta bulunan 4.534$ direncinin hâlâ açık hedef olması... Bu nedenle TOBO’nun son omuzundan itibaren yeni bir yükselen trend oluştuğunu görüyoruz. •Eğer bu yükselen trend (mavi trend çizgisi) aşağı yönlü kırılırsa, fiyatın Double FVG olarak işaretlenen 4.333$ seviyesine kadar sarkma yapması olası... Bu bölgede fiyatın fake bırakmadan, direkt likiditeye doğru çalışması beklenir. •+ Olumlu senaryoda ise mavi trend çizgisi korunur ve yapı bozulmazsa, saatlik (HTF değil, H1) zamansallıkta kademeli hedefimiz yeniden 4.534$ olacaktır... •- Negatif senaryoda, 4.333$ Double FVG alanı kaybedilirse, aşağıda ana demand (talep) bölgemiz 4.286$ seviyesi olarak takip edilmelidir... Aslında Yapı Net; Ya trend devamı ile direnç test edilir ya da likidite temizliği için FVG demand zinciri çalışır... YTD BOL ŞANS... #XAUUSD #GOLD #TOBO #InverseHeadAndShoulders #FVG #DoubleFVG #Liquidity #DemandZone #Resistance #SmartMoney #PriceAction #MarketStructure #MeTrader
MeTraderTr
#ETH Saatlik Teknik Görünüm ile FVG Dolduruyor Ama ?

A falling channel structure is clearly visible on the Ethereum side, starting at $3,447. After this decline, the price started to fill the FVG (Fair Value Gap) areas formed within the channel with a gradual accumulation process. Taking the vertex as reference, respectively: •$3,124 FVG filled •$3,226 FVG filled •Currently 3.316$ FVG is in the filling phase This structure shows that the price is moving from bottom to top in search of balance... On the RSI side, an overbought zone above 80 is seen. Although this situation shows that the rise may continue for a while, it also increases the possibility of seeking liquidity in the upper regions... With a clear close above $3,316, our first target will be the $3,447 level, which is the previously liquidated pin area. After a liquidity grab towards this region, the possibility of a short-term short / reversal is technically on the table... However, when we look at the bullish candles, we see that the movement is gradual and controlled, not impulsive. This suggests that the rise may be in a balance-distribution process rather than a strong trend continuation... If there is a rejection from the $3,447 area, the price could form a falling channel-like structure again, leaving a new FVG on the downside. The current formation seems compatible with a round bottom / bowl-like recovery structure formed after the falling channel... #ETH #ETHUSDT #Ethereum #Crypto #CryptoMarket #FVG #LiquidityGrab #PriceAction #SmartMoney #RSI #Overbought #TradingView #MeTrader
MeTraderTr
#BTC 1 Saatlik İleri Teknik Senaryo...

When we look at the general structure, there are two strong support areas on the chart. The first strong support is at $90,347, and the second and main support zone is at $86,932... Although the price is currently in an upward trend, it is not correct to say that the rise continues without exceeding the $94,490 supply zone located in the upper region. The lower high formed after this region is an important signal supporting the bearish structure in the short term... In a possible pullback scenario, the price can be expected to fill towards the FVG (Fair Value Gap) area at $91,552. With the reaction to be received from this region, upward attempts may be seen again after an in-trend liquidity buy / fake breakout, but if the $ 91,552 level is broken downwards, the first target in the decline will be $ 90,347. If there is a strong reaction from this level, we may see upward movements again. If the $90.347 level is also lost, the main 2nd support zone at $86.932 is possible in a bearish scenario... A clear close above $94,490 is required to confirm a healthy and genuine uptrend. Upward movements before this occurs should be considered as a reaction increase, not a trend continuation. #BTC #BTCUSDT #Bitcoin #Crypto #CryptoMarket #SupplyZone #FVG #Liquidity #PriceAction #SmartMoney #Trend #SupportResistance #TradingView #MeTrader YTD GOOD LUCK...
MeTraderTr
تحلیل کامل ساختار چانکی اتریوم (ETH): کلید صعود یا سقوط در 3178 دلار!

The movement starting at $3,447 on the ETH side is not a random sell; It was an in-trend correction process that followed a gradual and controlled distribution. After this decline was completed, the price entered two separate accumulation phases. At this point, the market has entered a time-based absorption process rather than a classic search for a bottom... The strongest and most structural area among these two accumulation areas is the $2,886 – $3,077 range. This band is not just a horizontal recovery; It has also worked as a major consolidation area where sellers are absorbed, volatility decreases, and the price compresses. In this structure, the formation formed by the price has a round bottom character, unlike classical bottom structures. This bowl structure is the base formation stage, which is frequently seen in cup-handle formations. However, the critical point here is this: This structure is not yet confirmed. For technical confirmation, the price must surpass the $3,178 level with volume and clear closes. Although the price has risen to $3,178 with the initial reaction above $3,077, this move is not a breakout at this stage, but only a contact to the upper band of the bowl. Critical level and Structure confirmation; •Closings above $3,178 confirm that the bowl formation is working upwards. •With this confirmation, the price is expected to produce a gradual trend continuation and the technical targets are as follows: •$3.273 (intermediate resistance / transition zone) •$3,447 (main distribution start / major target) Possible Negative scenario and Structure degradation; If the price falls below $3,077 again and closes within the accumulation area, before breaking through $3,178, then ! •We can see that the upward movement remains as a weak-volume liquidity collection attempt and then there is a risk of a harsher withdrawal. In this scenario, for the $ 2,886 level; •base of the building, •We can say that it is the buyers' last line of defense... Below this level, it may mean that the accumulation structure is disrupted and the possibility of the price moving towards more alt liquidity regions increases. Attention! Candles that appear without volume on the hourly chart represent high volatility and serious risk in alt time frames. General market situation: The current market structure involves high uncertainty. The market is currently in risk-off / red alert mode due to news flow and macro risks. In this environment, the approach should be disciplined and confirmation-oriented, not aggressive. #ETH #ETHUSDT #Ethereum #CryptoAnalysis #Accumulation #BowlFormation #RoundingBottom #PriceAction #SmartMoney #MeTrader #RiskManagement #TradeDiscipline #1HAnalysis
MeTraderTr
#BTC Teknik Görünüm - Orta Vade (Swing Senaryo) ÖNEMLİ !!!

Bitcoin formed a clear falling channel structure on the Daily Temporal post $126,200 ATH. A rising chart structure started to form with the rising lows (higher lows) formed after the needle was thrown to the $ 80.575 level in the alt band of this falling channel... The important point is; The resulting rising bottoms are progressing to test the $94.625 level, which we define as Main Resistance + BOS (Break of Structure)... Critical Approval Level; •If the closing condition of 2 4-hour candles above $94.625 is met, the structure within the falling channel is confirmed as positive BOS and the upward scenario becomes active gradually... The levels have been determined below and the most logical Long Trade for these targets is to establish RR Setup with a wide range stop... 🎯 Swing Goals (If BOS Approval is Received) •Swing Target 1: $107,518 •Swing Target 2: $116,388 •Swing Target 3 (ATH): $126,200 🚀 In the Possible Negative Scenario; 2 4-hour closes above $94.625 Must Not Come... •CSF in the falling channel is considered invalid (negative) •The structure works downward again •The possibility of a retest of the $83.483 main support zone becomes stronger... General Summary: •$94,625 = Decision Level •Above = SL (Swing Long) Scenario •Six = Falling Channel Continuation Risk Stay disciplined, don't rush until you see the closure!!! MeTrader point of view: Without confirmation, a position is Gambling... YTD Good Luck 💰 #TechnicalAnalysis #PriceAction #MarketStructure #BreakOfStructure #BOS #SwingTrade #SwingTrading #Trend #SupportResistance #MeTrader
MeTraderTr
بیت کوین در مرز انفجار! راز استراتژی 90 هزار دلاری برای صعود یا سقوط ناگهانی BTC

Bitcoin It continues to move within the rising wedge structure on the 4-hour chart... This structure normally works downwards, but right now we are still in the closing-based decision zone... At the top there is a FVG above $90,612. Attention! When we look at past price movements, we see that such gaps are often filled, but a clear 4-hour closing is required for this. Needle alone is not enough... If the price closes above $90.612, the FVG in this zone will be filled and the downside pressure may weaken for a while. The level to pay attention to at the top is $94,560, and since this is a strong resistance zone, not only contact but also a 4-hour closing is required. If this scenario occurs, the rising wedge will be broken and a new upward movement area will be opened for the price. In this case, $94,560 is now watched as support... In the downside scenario, the levels I follow gradually are: $87,556 – $83,777 – $80,593 Especially $80,593 is critical!!! The next 4-hour close below this level would make it clear that the rising wedge is operating. The measurement target of this structure falls below the average $74,500 region. This level is our worst-case scenario target for now; In summary: •Closing above $90.612 → FVG filling, pressure decreases •Closing above $94.560 → structure breaks down, rise continues •Closing below $80.593 → rising wedge active, target $74.500 The market is not telling its direction at the moment and we are waiting for the closings... #BTC #Bitcoin #BTCUSDT #PriceAction #RisingWedge #FVG #Crypto #TradingView #MeTrader
MeTraderTr
سولانا (SOL): آیا ریزش تمام شد؟ رمز عبور تغییر روند (CHoT) در ۱58 دلار!
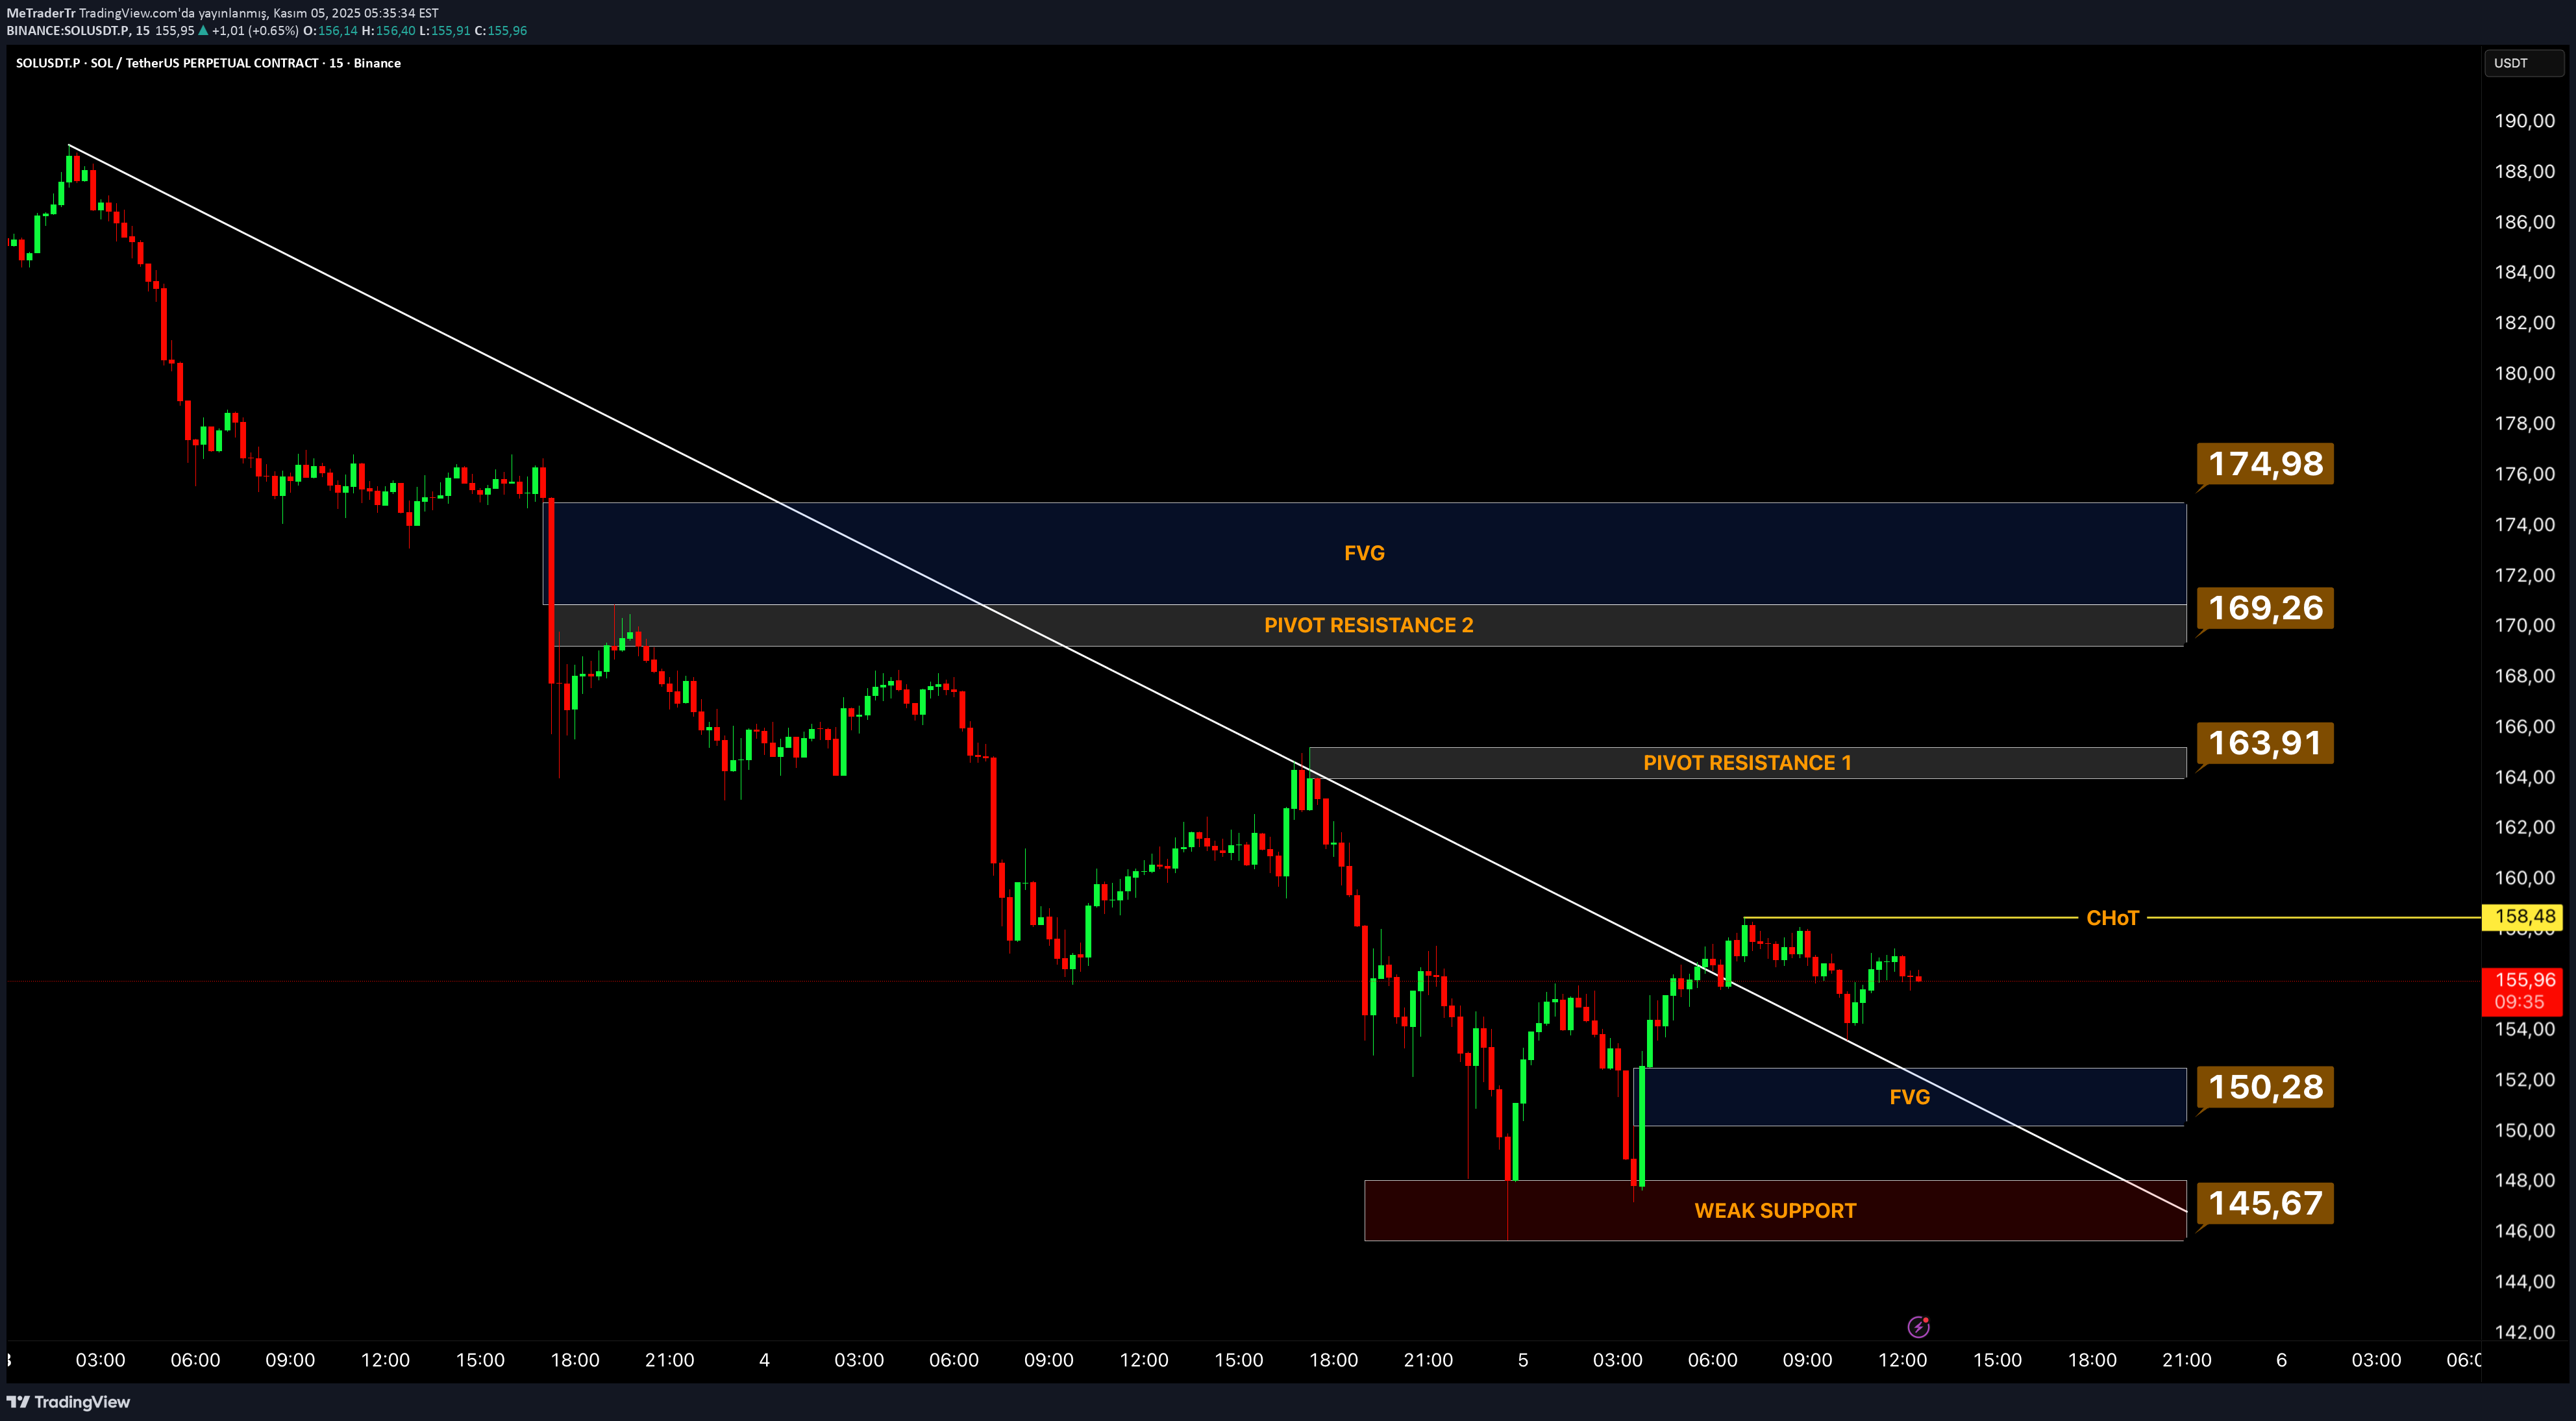
SOL It received a strong reaction from the $145.67 area (Weak Support). Following the voluminous response from buyers in this region, the price sought upward liquidity, leaving a large FVG at $150.28... Currently, the critical point is the CHoT (Change of Trend) level at $158.48. This level is essential for confirmation of the trend change and after 2 15m minute candle closings above it; The first target will be Pivot Resistance 1 ($163.91), followed by Pivot Resistance 2 ($169.26)... With a close above $169.26, the $174.98 FVG area above begins to fill. This means that the falling trend in the short term has completely broken down and the upward structure has been completed... Below, a close below $145.67 Weak Support invalidates this structure. In summary; •Close on CHoT = bullish momentum •$163.91 – $169.26 resistance range = possible take profit zone •Under $145.67 = trend invalid #MeTrader #SOL #Crypto #TechnicalAnalysis #TradingView #WolfView #FVG #CHoT #Pivot #TrendChange
MeTraderTr
اتریوم در جنگ 5 حمایت و 2 مقاومت: کدام طرف پیروز میشود؟

Ethereum has formed an approximately 18% compression zone between the $4,232 and $3,677 levels in recent days. This region should be monitored as the decision area where both liquidity pool and market direction will be determined... There are two main structures that attract attention in the chart!!! •2 resistance contacts (double top formation) at $4.232 •5 support exhaustion zones at $3,677 These two extremes form a structure where the price accumulates its energy and has a great breakout potential... 🟩 Resistance Zone ($4.232) – Strong Resistance Zone This level, tested twice, shows that the supply zone is actively protected. Each time, sellers stepped in in this area and turned down the price. Therefore, the $4,232 region is a region with a high probability of an upward liquidity sweep... 📈 If the price breaks the $3.917 (Change of Trend) level and makes a voluminous 4H close, First, the $3,842 FVG (Fair Value Gap) zone can be filled, and after this filling, the $4,032 retest usually triggers the $4,232 breakout... If this breakdown occurs, the structure will give a trend continuation (rising impulse) signal and the $4,320–$4,400 band can be targeted... ----- 🟥 Support Zone ($3.677) – Strong Support Weakening Although the support, which has been tested five times, seems strong at first glance, it is technically weakened. Each repeated contact creates buyer exhaustion and pools liquidity into the bottom. This brings the following risk; The 4H close below $3,677 was not only a simple breakout but also It opens the door to a downward movement that may extend to $ 3,399 with the liquidity flush... This movement generally occurs as a bearish continuation following a break of structure (BoS). ⚖️ Structural Balance (Market Context) •Resistance under tested - high potential for breakage •Support over tested - high risk of breakage For this reason, the price is literally stuck in a decision zone right now... 🔹 Ascension scenario: 4H closing above $3.917 → long structure with target $4.032 → $4.232 An increase in momentum can be expected after FVG filling. 🔹 Fall scenario: 4H closing below $3.677 → short structure with $3.399 target A new bottom may occur after liquidity purchase 🧠 MeTrader Review The 5 support contact shows receivers getting a little more tired with each defense. The second resistance theme is the existence of a patient supply zone. In this case the price often washes the impatient side!!! Price direction, change of trend move above $3,917 or It will become clear with the liquidity breakdown below $3,677. #MeTrader #ETH #Ethereum #Crypto #TechnicalAnalysis #TradingView #PriceAction #FVG #MarketStructure #Liquidity #SmartMoney #SupplyDemand #Breakout #SupportResistance #RiskManagement #CryptoTrading #Binance #Blockchain #Finance #MarketShift #LiquiditySweep
MeTraderTr
بیت کوین در آستانه شکاف قیمتی (FVG)؛ صعود یا ریزش بزرگ؟ تحلیل 4 ساعته
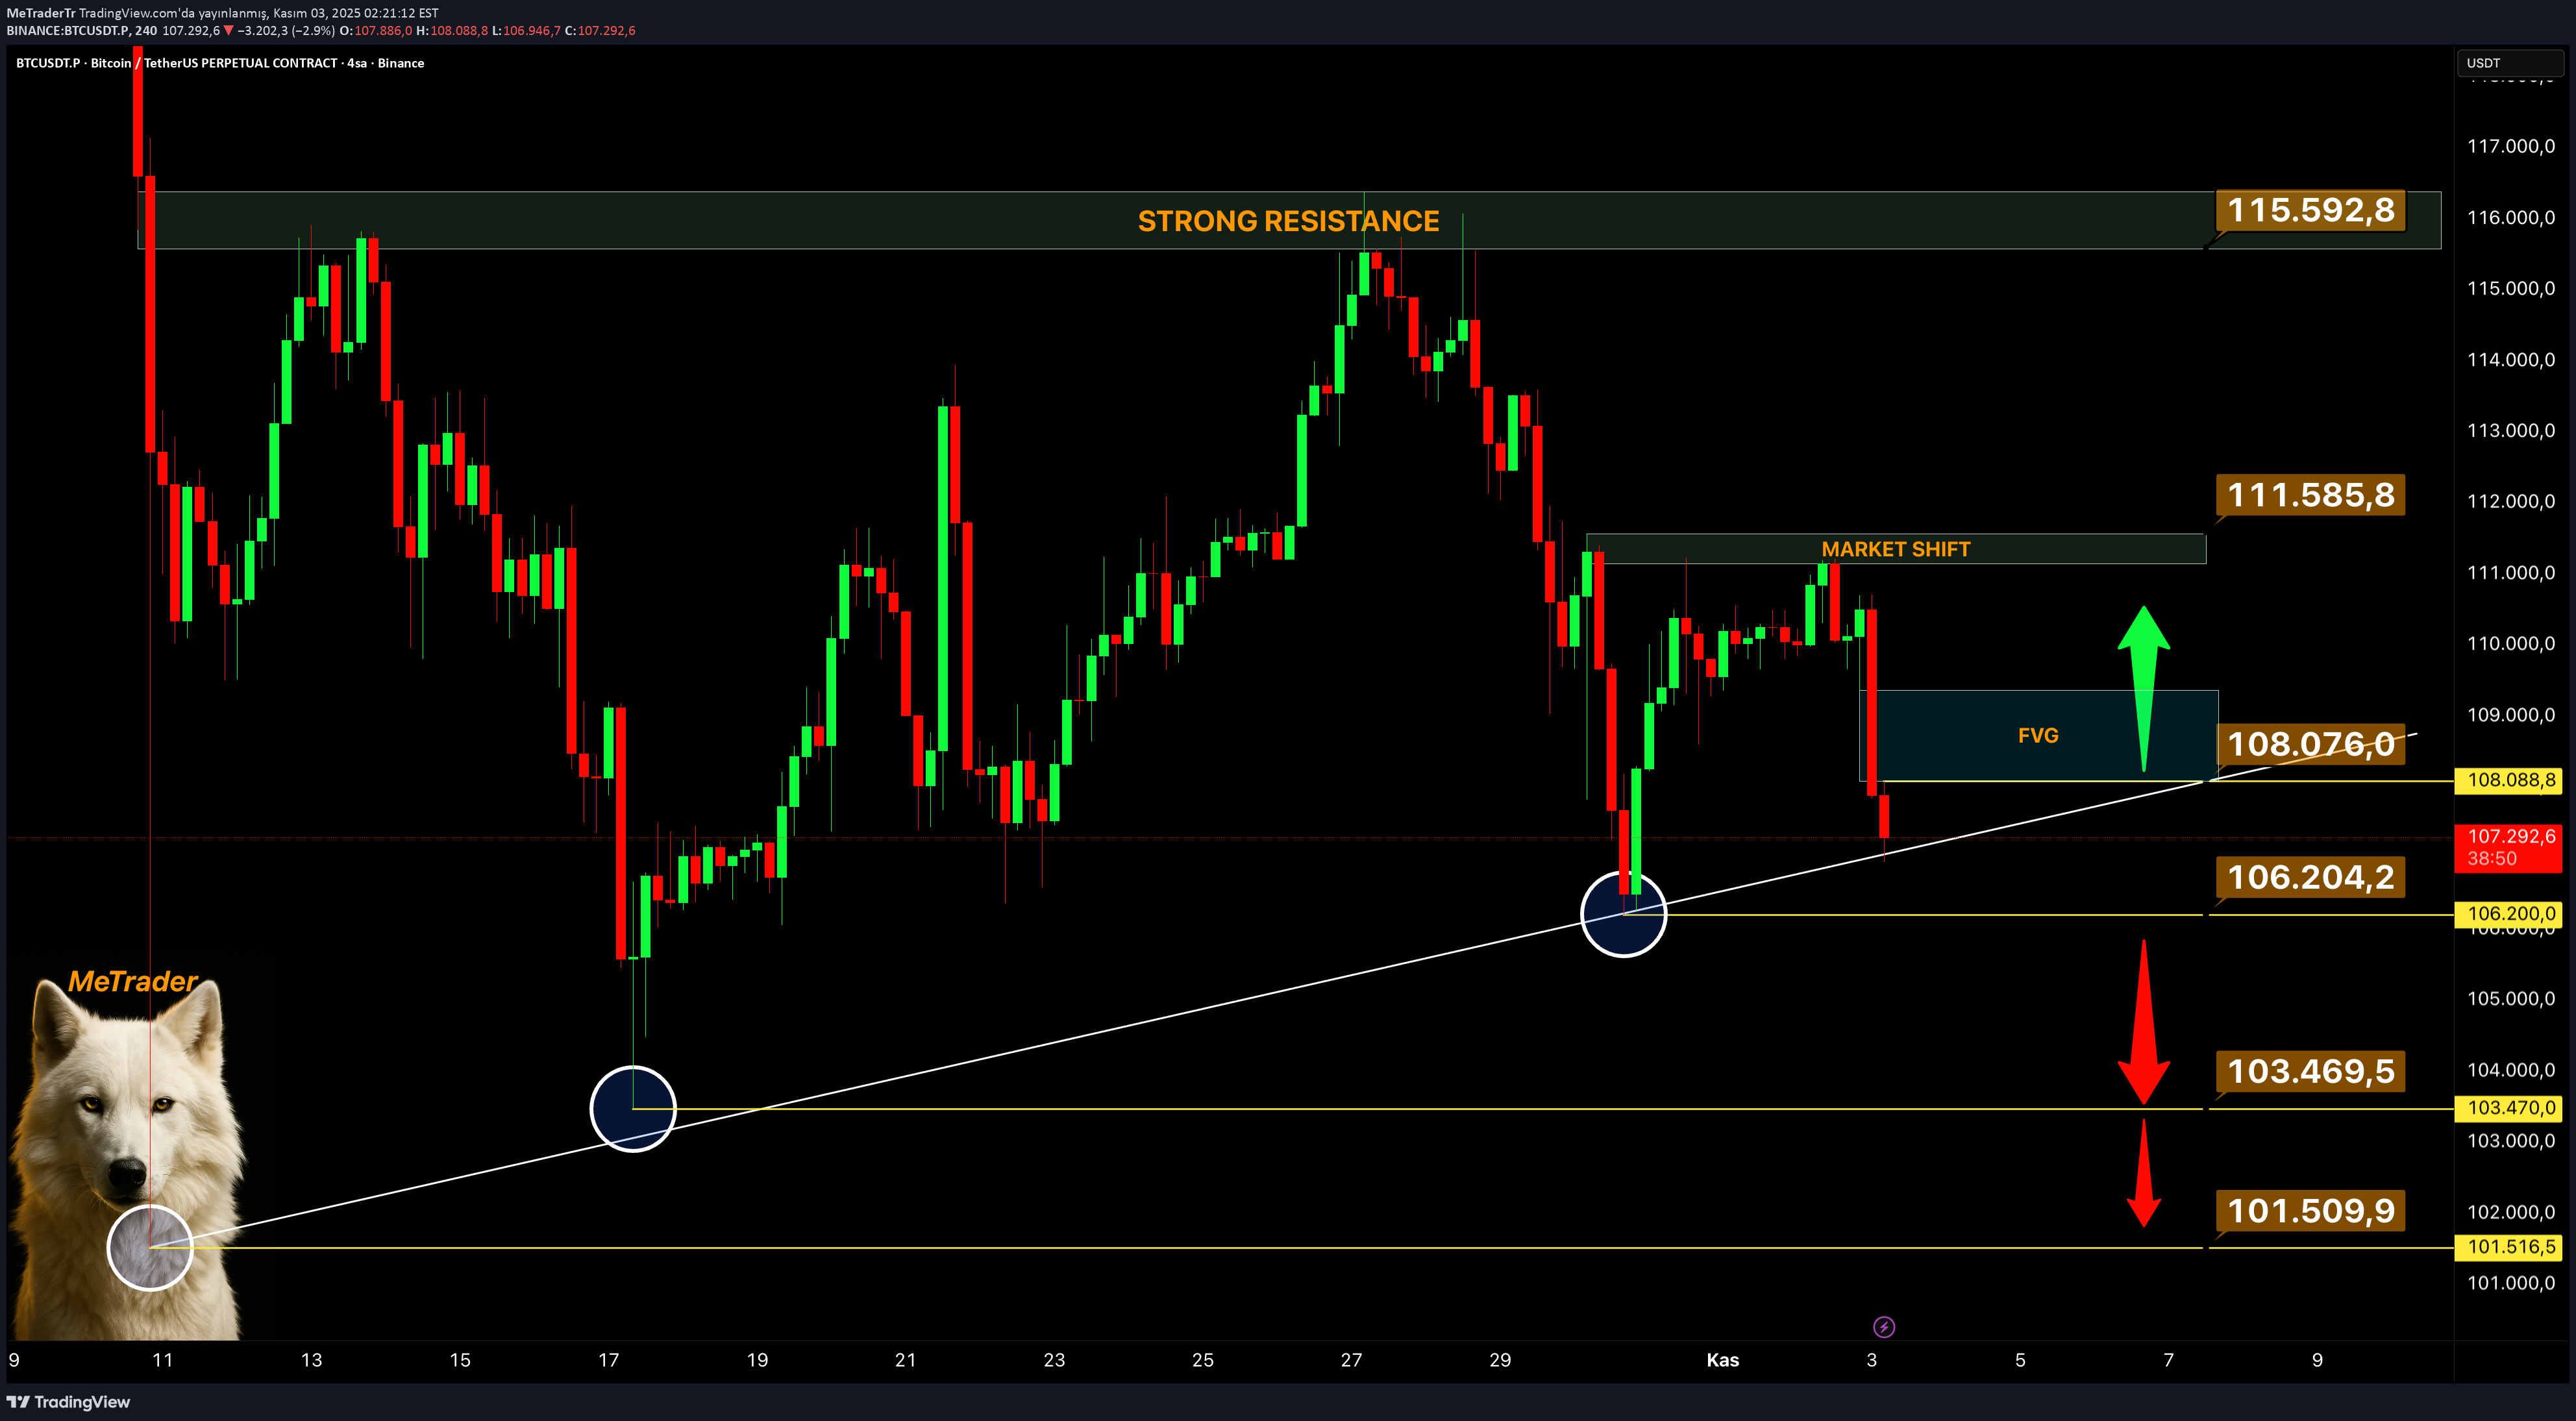
On Bitcoin's 4-hour chart, the $115,592 level appears as a strong major resistance (main resistance). Although the price tested this zone several times, it failed to break and retreated with higher lows in each rejection, and these structures generally indicate a consolidation period, that is, we can say that the price is accumulating energy... Finally, with the sale at $ 111,585, the price created a reversal area that we call market structure shift... A break below this zone indicates a short-term structure break in the trend. The price may enter an active FVG (Fair Value Gap) zone that is currently forming at $108.076. - Technical Scenarios 🚀 Ascension Scenario; •If the price holds and closes in the FVG area above $108.076! •The first target will be the $111,585 (Market Shift) level. •If this region is broken, the main resistance of $ 115,592 is tested again and if permanence is achieved above that region, it is possible to see a new impulse movement above $ 117,000... 📈 Long Region: $108,000–$108,500 🛑 Stop: 4H close below $106.200 🎯 Targets: $111,500 - $115,500 ---------- - Fall Scenario: •If there is a 4H close below $106.204, the rising trend will be broken. •In this case, the price may gradually deepen towards $103,469 and then $101,509, and this movement is a breaker structure decline that usually occurs after the liquidity sweep... 📉 Short Zone: Closing below $106,000 🛑 Stop: Close above $108,100 🎯 Targets: $103,500 - $101,500 ---------- - In summary •Rise continues with persistence above $108.076 •With a close below $106.204, the trend is broken and the downward momentum increases. •If $111,585 is broken, new high targets ($115,592 and above) #MeTrader #BTC #Bitcoin #Crypto #TradingView #BTCUSDT #FVG #MarketStructure #SmartMoney #OrderFlow #Liquidity #TechnicalAnalysis #PriceAction #CryptoTrading #Binance #Altcoins #RiskManagement #Bullish #Bearish
MeTraderTr
تحلیل تکنیکال سولانا: مثلث نزولی و راز کانال صعودی درون آن!
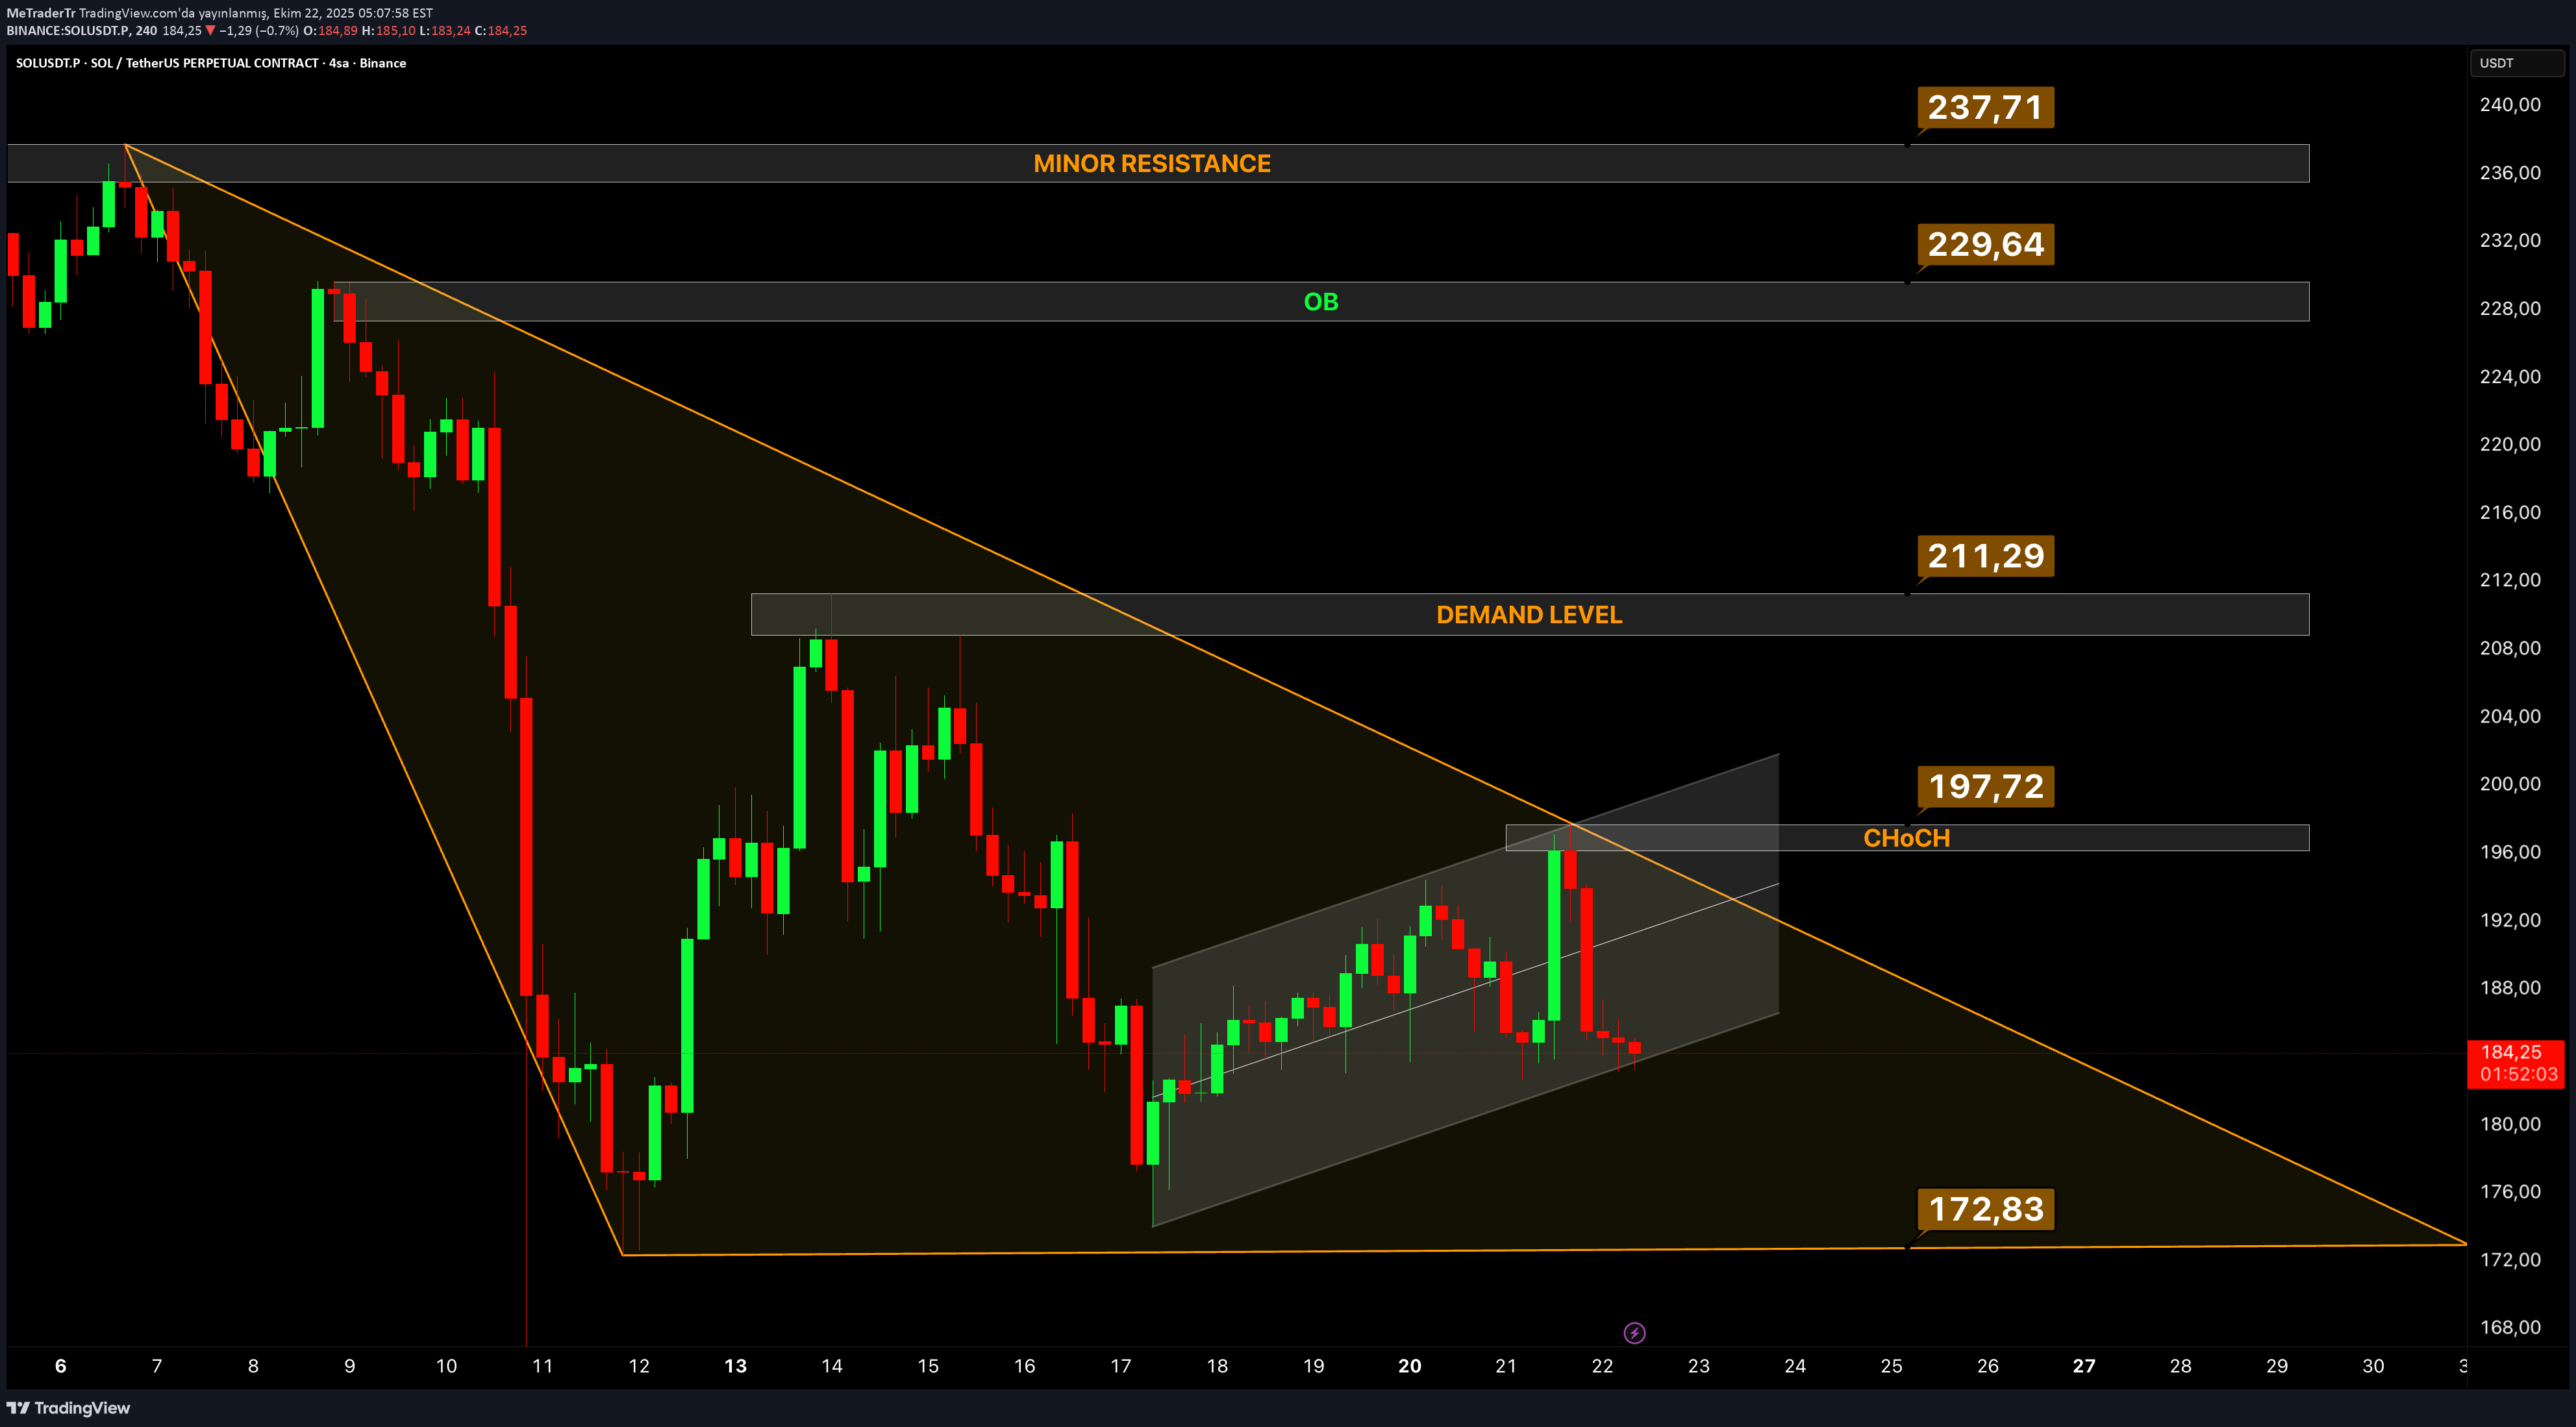
A descending triangle structure has formed in Solana over a wide period of time. This structure generally has the potential to continue in the trend direction with a narrowing price movement. A rising channel structure has now formed within the triangle. The price took red from the $197.72 CHoCH (Change of Character) level, located in the upper band of this channel, and started to retreat. This level is critical for us because it coincides with the falling trend line of the triangle. If the price can sustain above $197.72 and the CHoCH structure is active; Upstream targets are as follows: •$211.29 (Demand Level) •$229.64 (Order Block) •It will be $237.71 (Minor Resistance). However, if the price sags below the channel and fails to break the CHoCH zone, the downtrend will become stronger again. In this case, the target would be $172.83 (triangle base) and alt liquidity areas. 📍Critical Regions: •CHoCH: $197.72 •Demand Level: $211.29 •OB Zone: $229.64 •Minor Resistance: $237.71 •Triangle Base: $172.83 #MeTrader #SOLUSD #Solana #CryptoAnalysis #TechnicalAnalysis #PriceAction #SmartMoneyConcepts #CHoCH #DemandZone #OrderBlock #TrianglePattern #Breakout #Resistance #Support #MeTraderAnalysis #TradingView #CryptoMarket #TradeSetup #CryptoTrading
Disclaimer
Any content and materials included in Sahmeto's website and official communication channels are a compilation of personal opinions and analyses and are not binding. They do not constitute any recommendation for buying, selling, entering or exiting the stock market and cryptocurrency market. Also, all news and analyses included in the website and channels are merely republished information from official and unofficial domestic and foreign sources, and it is obvious that users of the said content are responsible for following up and ensuring the authenticity and accuracy of the materials. Therefore, while disclaiming responsibility, it is declared that the responsibility for any decision-making, action, and potential profit and loss in the capital market and cryptocurrency market lies with the trader.