Technical analysis by MeTraderTr about Symbol BTC on 11/3/2025

MeTraderTr
بیت کوین در آستانه شکاف قیمتی (FVG)؛ صعود یا ریزش بزرگ؟ تحلیل 4 ساعته

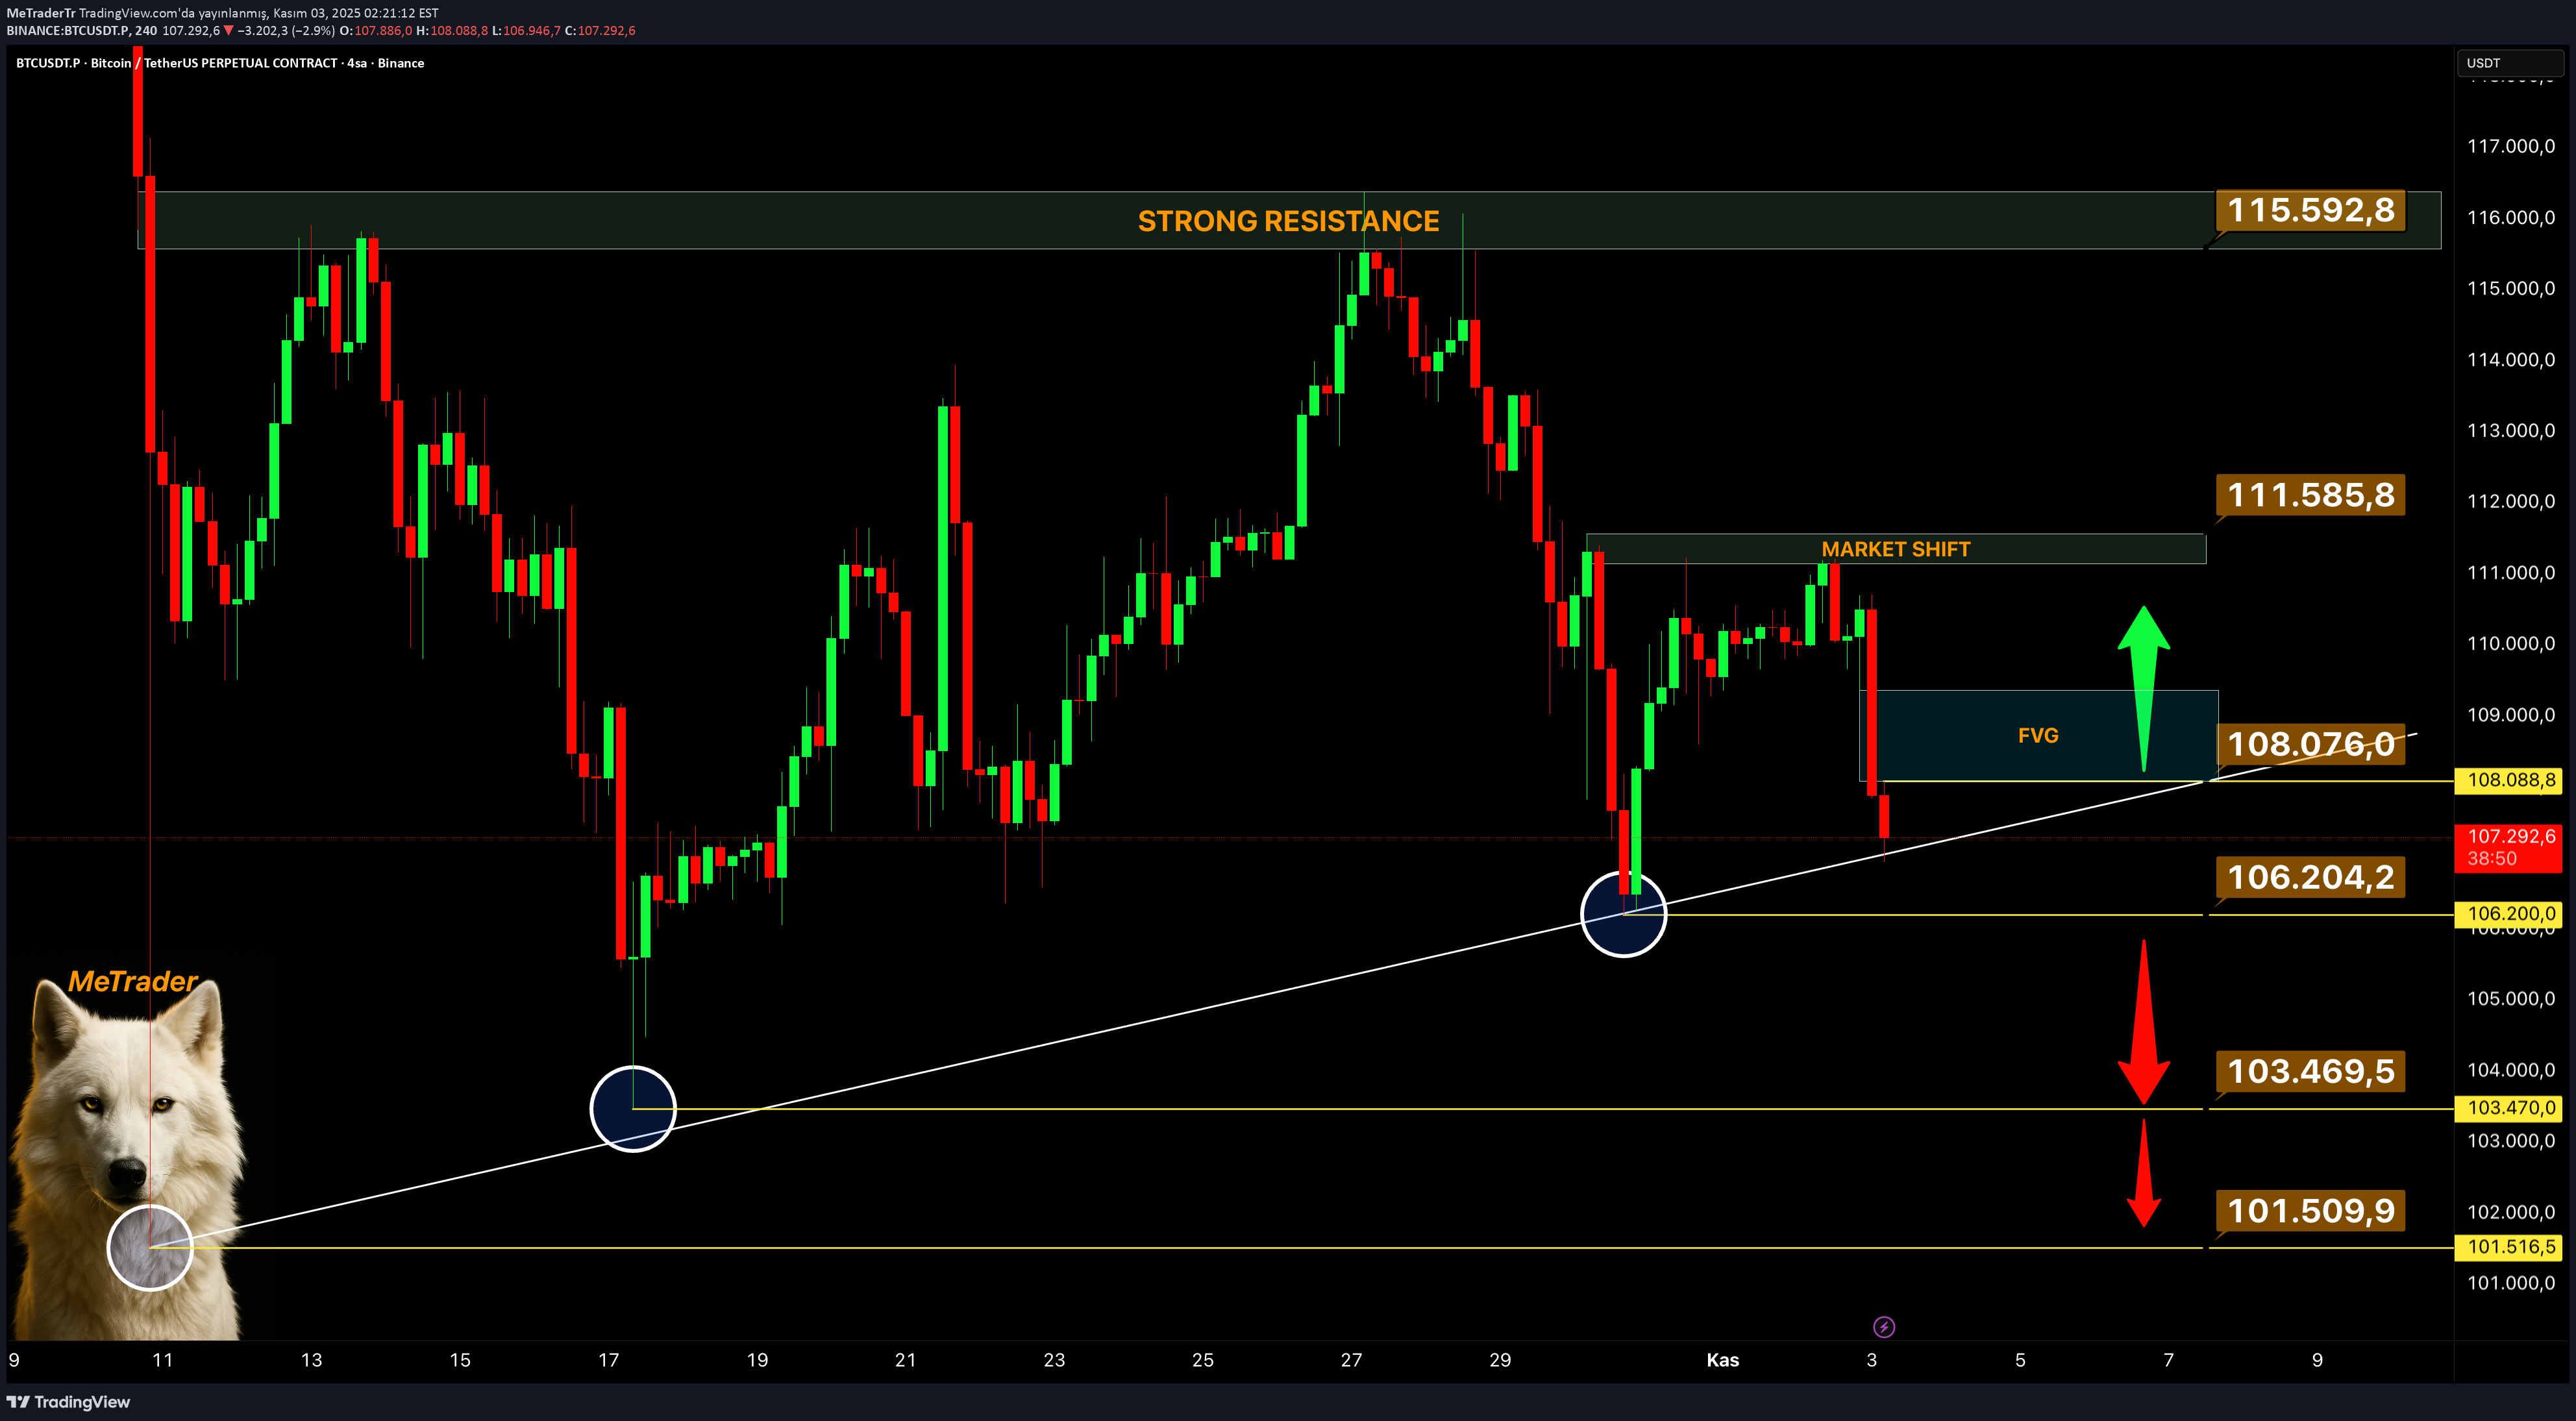
On Bitcoin's 4-hour chart, the $115,592 level appears as a strong major resistance (main resistance). Although the price tested this zone several times, it failed to break and retreated with higher lows in each rejection, and these structures generally indicate a consolidation period, that is, we can say that the price is accumulating energy... Finally, with the sale at $ 111,585, the price created a reversal area that we call market structure shift... A break below this zone indicates a short-term structure break in the trend. The price may enter an active FVG (Fair Value Gap) zone that is currently forming at $108.076. - Technical Scenarios 🚀 Ascension Scenario; •If the price holds and closes in the FVG area above $108.076! •The first target will be the $111,585 (Market Shift) level. •If this region is broken, the main resistance of $ 115,592 is tested again and if permanence is achieved above that region, it is possible to see a new impulse movement above $ 117,000... 📈 Long Region: $108,000–$108,500 🛑 Stop: 4H close below $106.200 🎯 Targets: $111,500 - $115,500 ---------- - Fall Scenario: •If there is a 4H close below $106.204, the rising trend will be broken. •In this case, the price may gradually deepen towards $103,469 and then $101,509, and this movement is a breaker structure decline that usually occurs after the liquidity sweep... 📉 Short Zone: Closing below $106,000 🛑 Stop: Close above $108,100 🎯 Targets: $103,500 - $101,500 ---------- - In summary •Rise continues with persistence above $108.076 •With a close below $106.204, the trend is broken and the downward momentum increases. •If $111,585 is broken, new high targets ($115,592 and above) #MeTrader #BTC #Bitcoin #Crypto #TradingView #BTCUSDT #FVG #MarketStructure #SmartMoney #OrderFlow #Liquidity #TechnicalAnalysis #PriceAction #CryptoTrading #Binance #Altcoins #RiskManagement #Bullish #Bearish