
XLM
Stellar
| تریدر | نوع سیگنال | حد سود/ضرر | زمان انتشار | مشاهده پیام |
|---|---|---|---|---|
FxProRank: 1963 | فروش | حد سود: تعیین نشده حد ضرر: تعیین نشده | 18 hour ago | |
 SwallowAcademyRank: 30616 | خرید | حد سود: تعیین نشده حد ضرر: تعیین نشده | 12/12/2025 | |
خرید | حد سود: تعیین نشده حد ضرر: تعیین نشده | 12/5/2025 | ||
 SaykoCryptoRank: 16577 | خرید | حد سود: تعیین نشده حد ضرر: تعیین نشده | 11/26/2025 |

Price Chart of Stellar
سود 3 Months :
خلاصه سیگنالهای Stellar
سیگنالهای Stellar
Filter
Sort messages by
Trader Type
Time Frame
FxPro
Stellar Wave Analysis – 24 December 2025
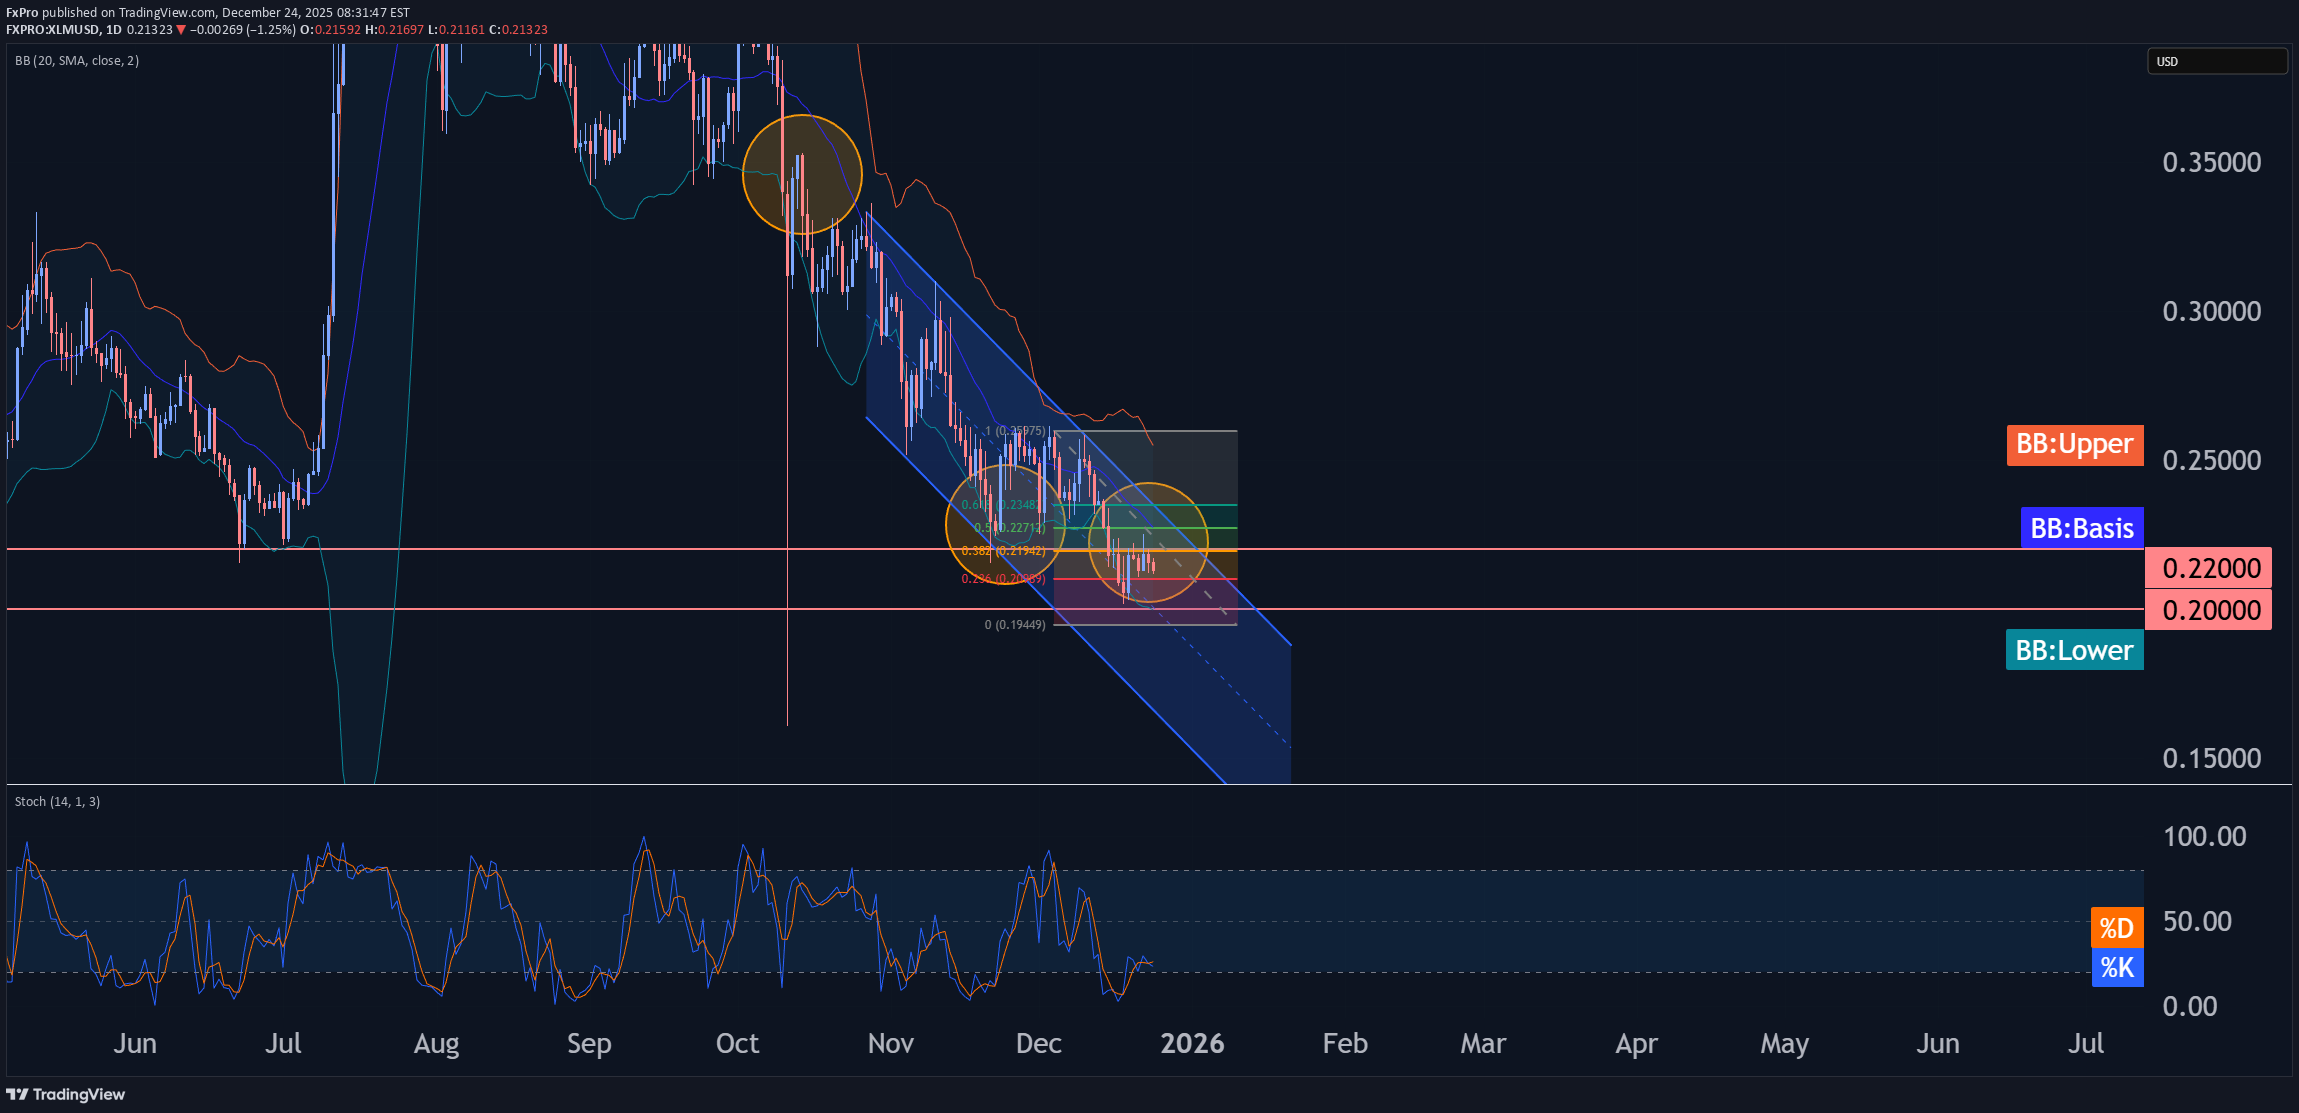
- Stellar broke key resistance level 0.6690 - Likely to rise to resistance level 0.6800 Stellar cryptocurrency recently reversed down from the pivotal resistance level 0.2200 (former monthly low from November, as can be seen from the daily Stellar chart below). The resistance zone near the resistance level 0.2200 was strengthened by the 38.2% Fibonacci correction of the downward impulse from November. Given the strong multi-month downtrend, Stellar cryptocurrency can be expected to fall to the next round support level 0.2000 (low of the previous wave B).

citexco_trade
XLM.USDT
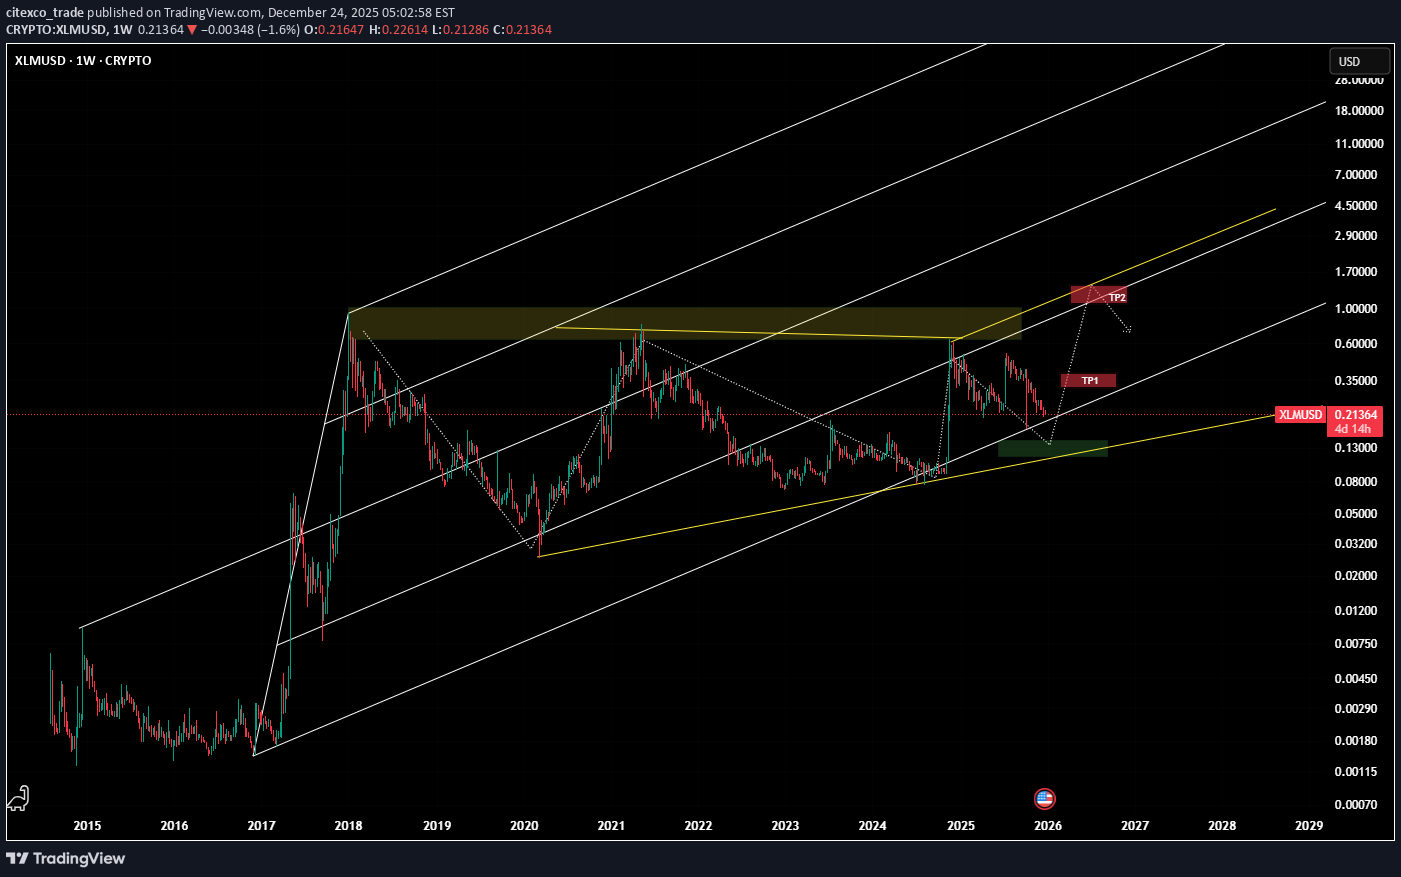
Stellar is one of the currencies that is very good in the long term and seems to have good and profitable movements. If it reaches the specified range, it seems like a buy for the high targets that have been specified.

MrWhale
XLM/USD – Monthly Level Analysis
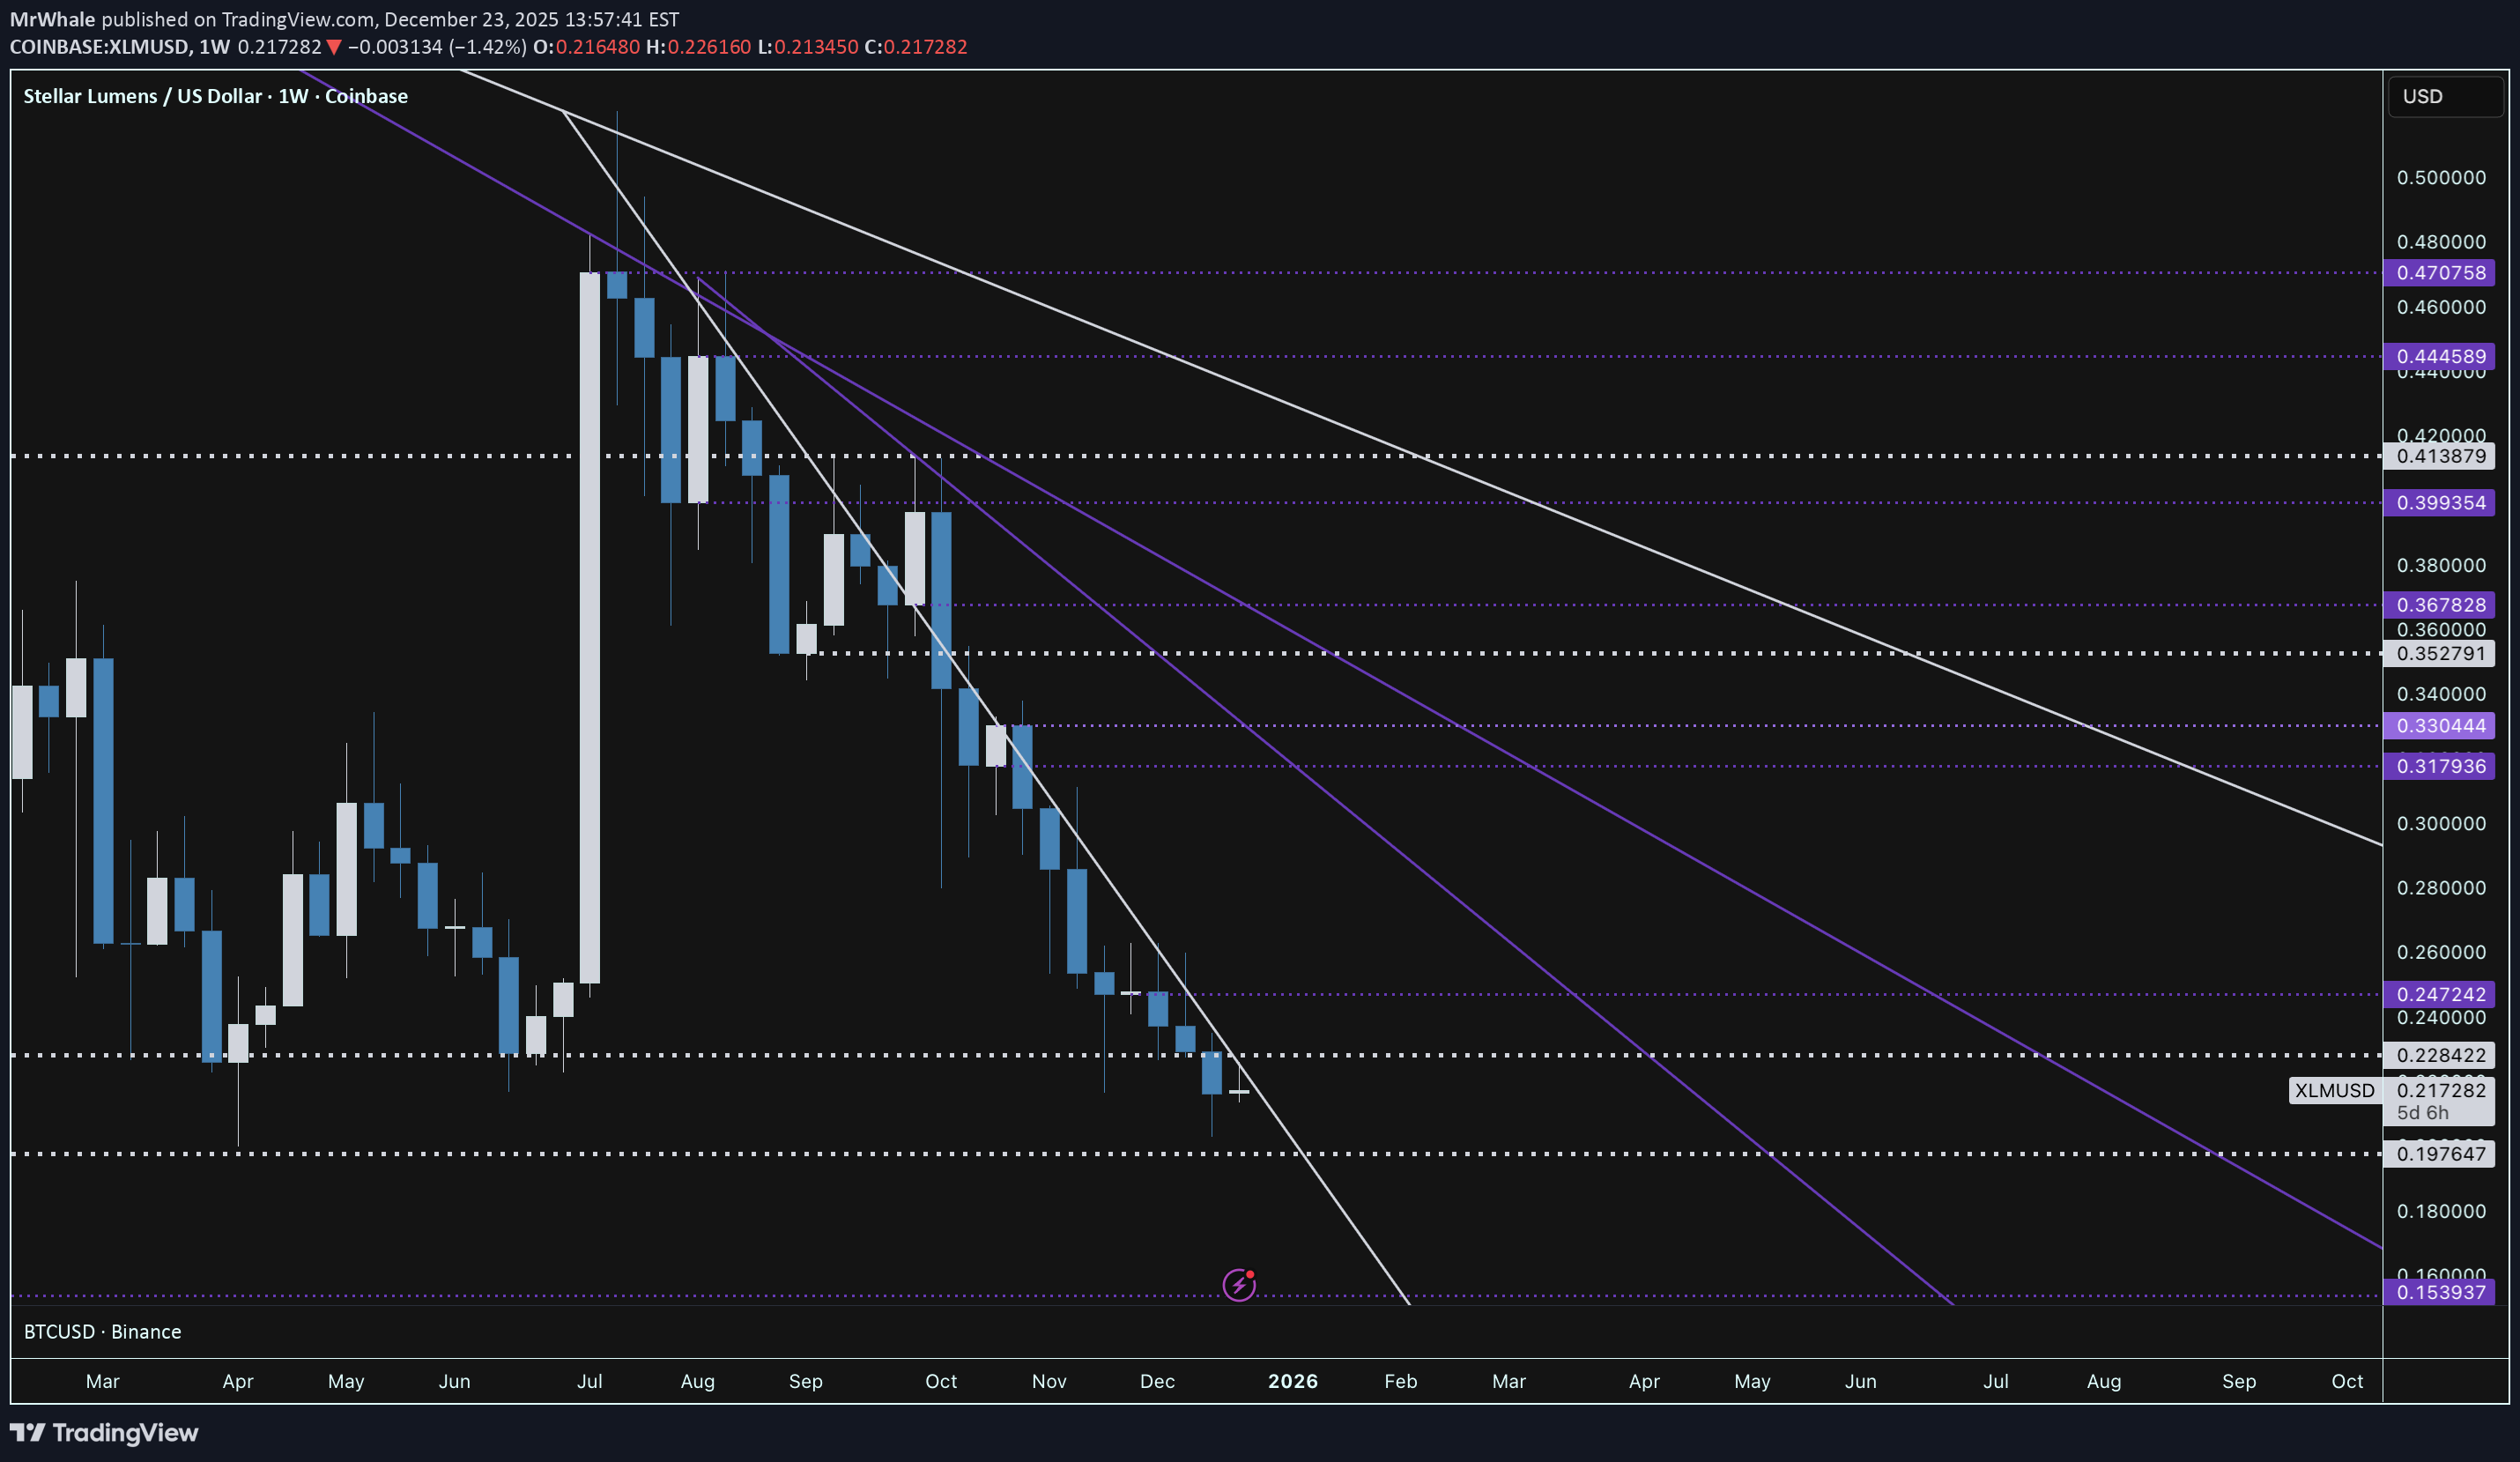
XLM is currently holding a critical monthly support zone. As long as this range holds, the downside remains limited. However, a clear break and close below this support would open the door to a move toward $0.15, and a subsequent break of that level could lead to $0.09–$0.10 area. Price is now approaching the apex of a long-term monthly triangle/symmetrical consolidation, which makes the coming weeks particularly interesting – a decisive breakout direction is likely soon. As always in the crypto market, Bitcoin leads the way. If BTC manages to break upward from its current local apex/range, it should provide the momentum needed to lift altcoins, including XLM. Long-term outlook: I don't expect XLM to retest its all-time high anytime soon – that cycle top appears intact for now. There's significant overhead resistance and structural damage from the multi-year downtrend that would take considerable time and volume to overcome. Near-term upside potential: In a bullish scenario, I see $0.35–$0.41 as realistic targets (previous monthly resistances). A convincing break and hold above $0.41 would invalidate my current bearish-to-neutral bias and force me to reassess. Watching closely for the resolution of these key levels. Trade safe! 🚀

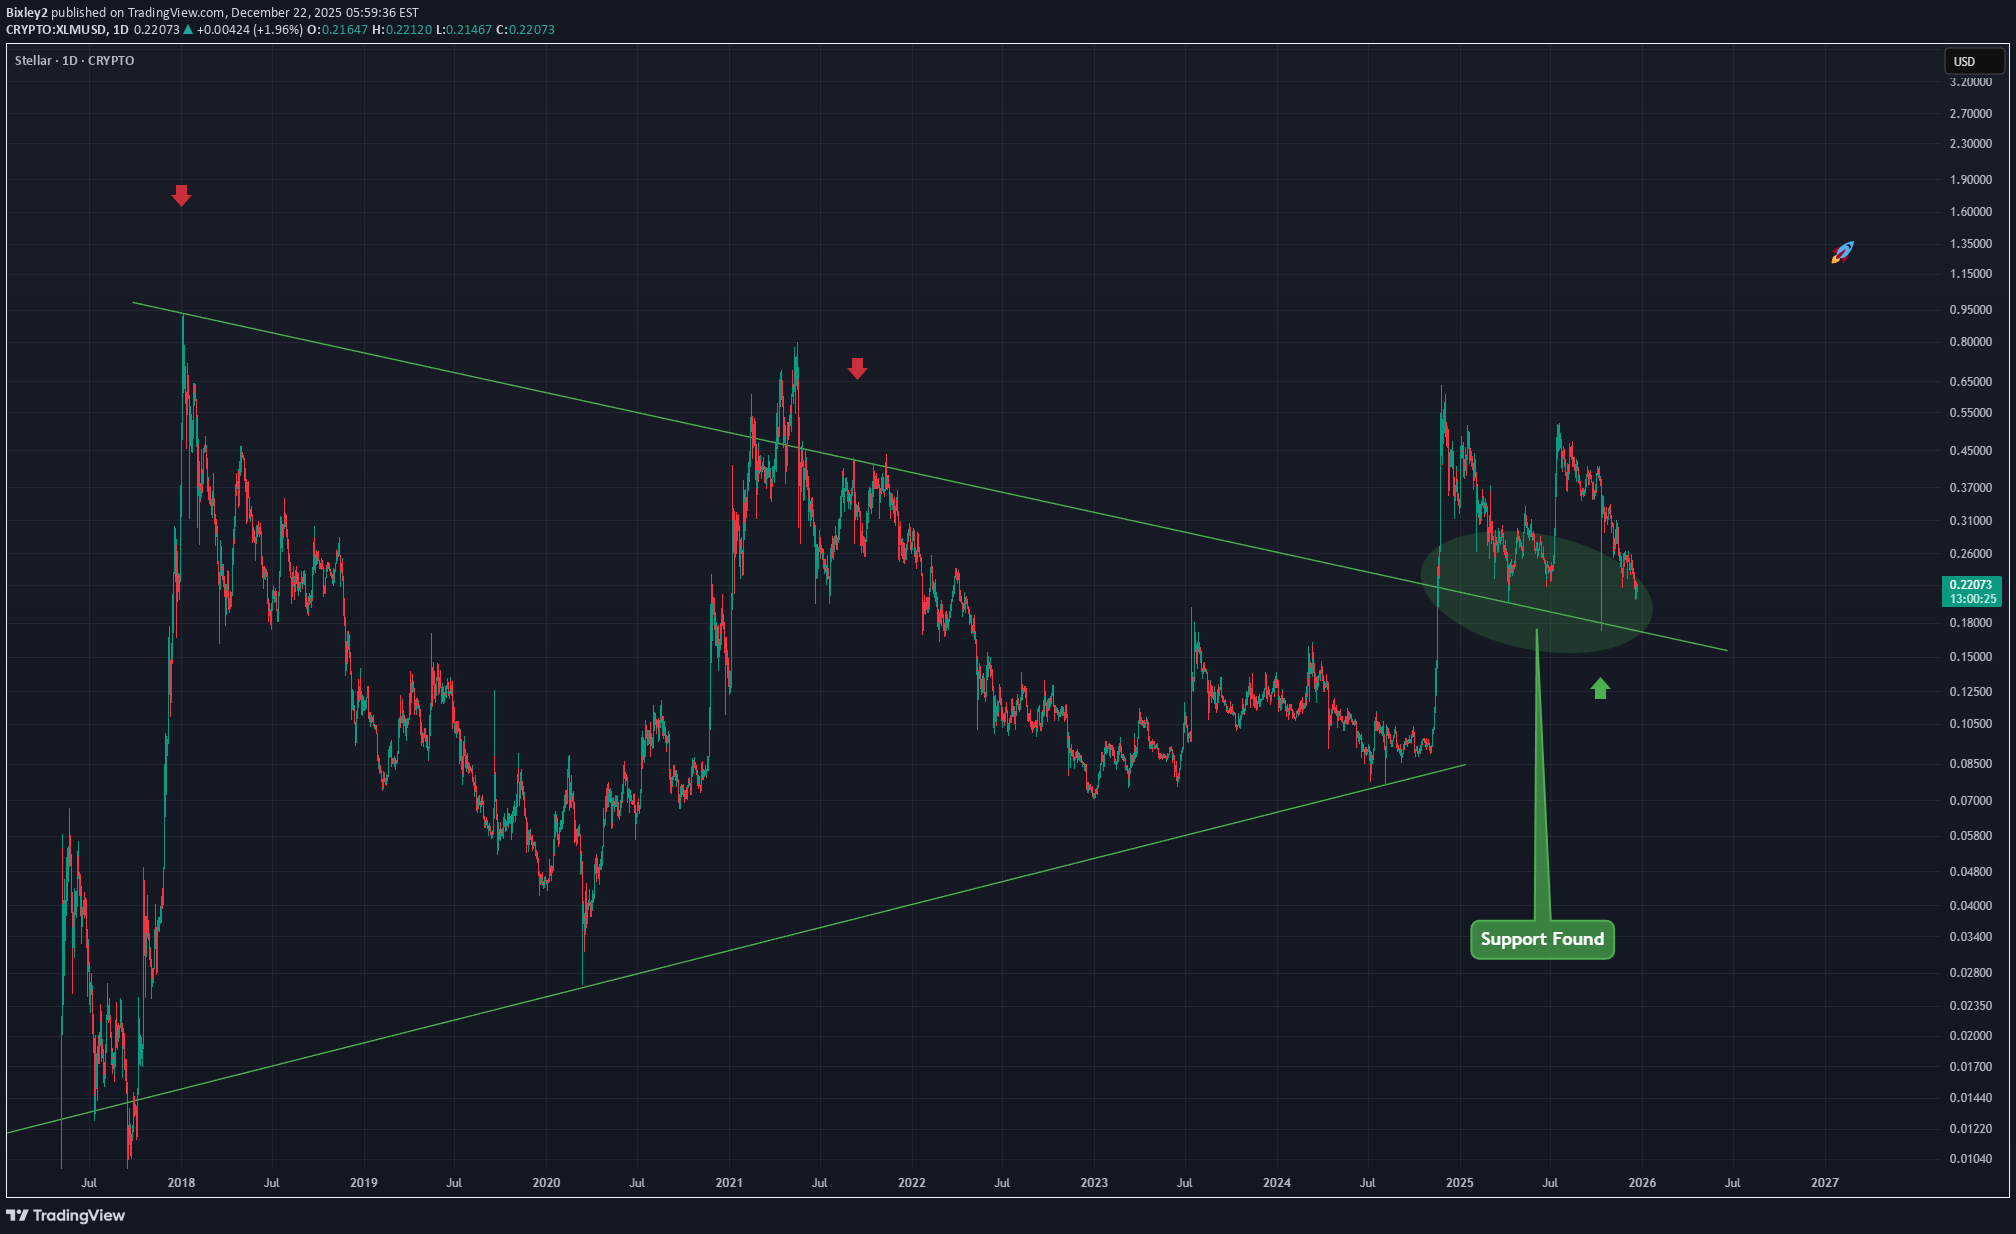
Bixley2

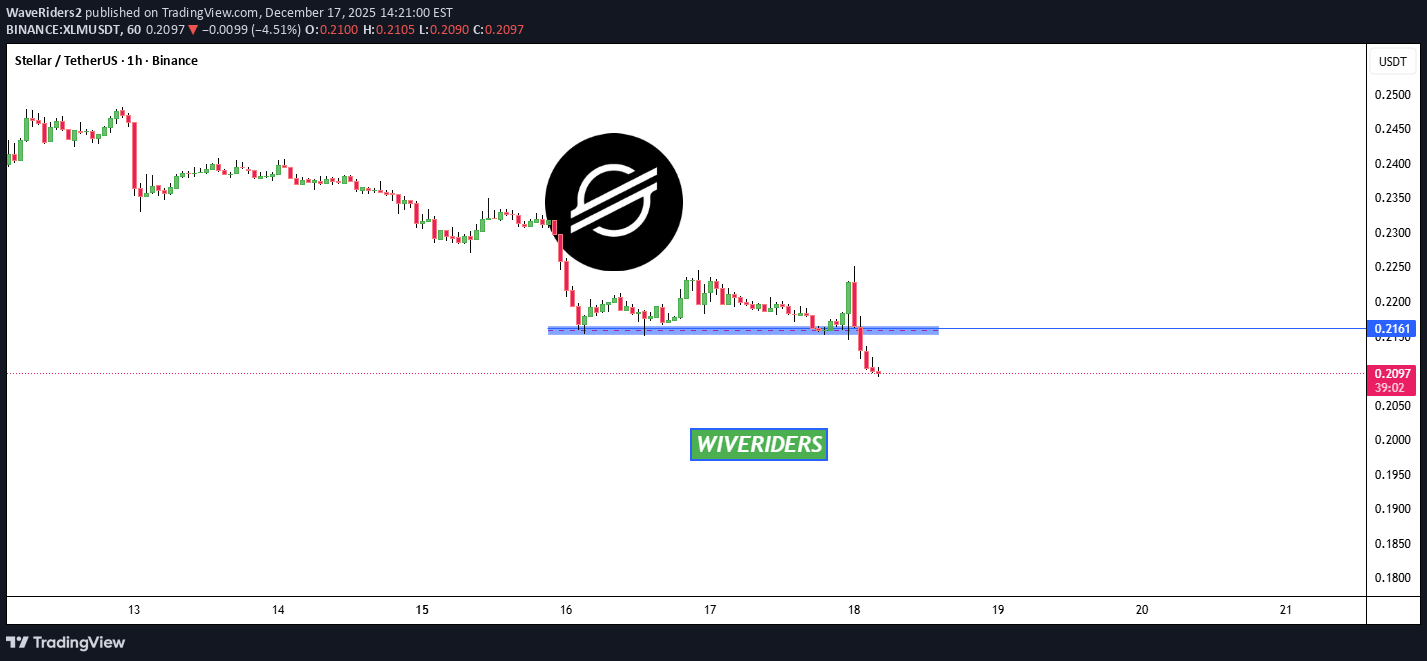
WaveRiders2

tradecitypro
TradeCityPro | XLM Trapped in Range, Awaiting Breakout Trigger
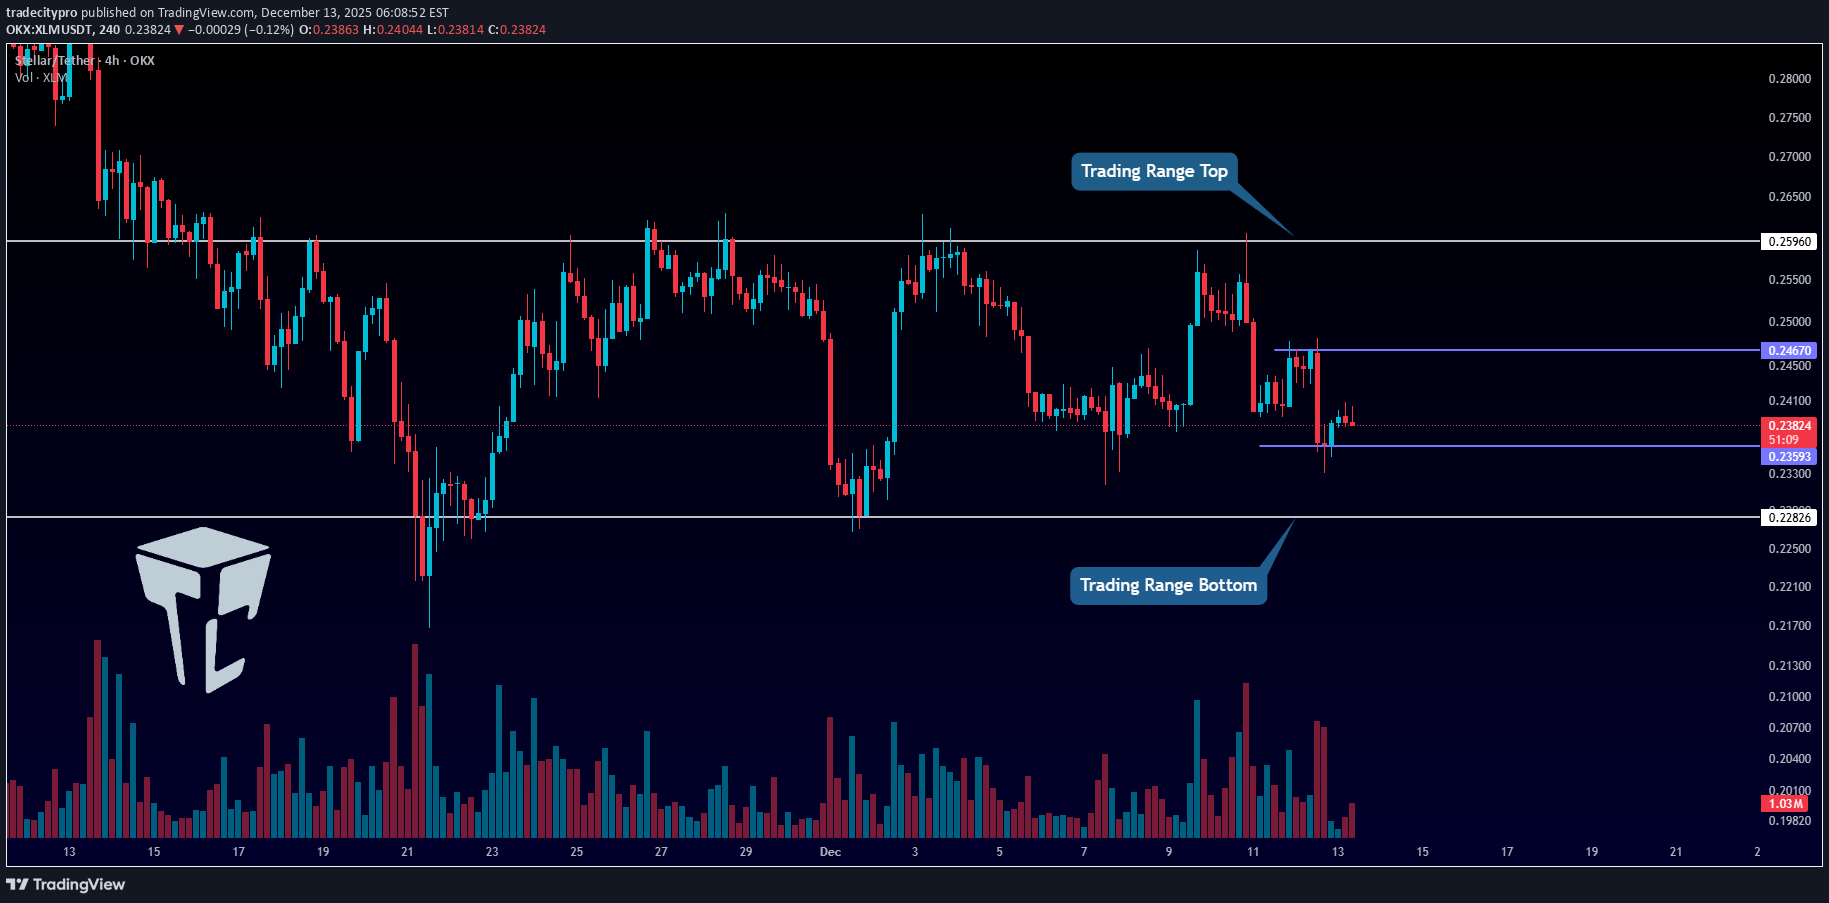
👋 Welcome to TradeCity Pro! In this analysis, I want to review XLM, one of the DeFi and RWA coins, which with a market cap of $7.72 billion is ranked 15th on CoinMarketCap. ⏳ 4-hour timeframe On the 4-hour timeframe, this coin has formed a large range box, and for several weeks it has been moving inside this range. ✔️ The bottom of this box is at 0.22826, and the top of the box is at 0.25960, and currently the price is moving in the middle of this box. 📊 A smaller range box has also formed inside the main box, which is between the zones 0.23593 and 0.2467. ⛏ If either 0.23593 or 0.2467 breaks, we can open a short-term position with low risk. However, the main triggers are the break of the main box’s support and resistance. ⭐ So for a short position, the main trigger is 0.22826, and the early trigger is 0.23593. ⚖️ For a long position, breaking 0.2596 is the main trigger, and breaking 0.2467 is the early trigger. 📝 Final Thoughts Stay calm, trade wisely, and let's capture the market's best opportunities! This analysis reflects our opinions and is not financial advice. Share your thoughts in the comments, and don’t forget to share this analysis with your friends! ❤️
SwallowAcademy
Stellar (XLM): Looking For Break of Structure Near Neckline
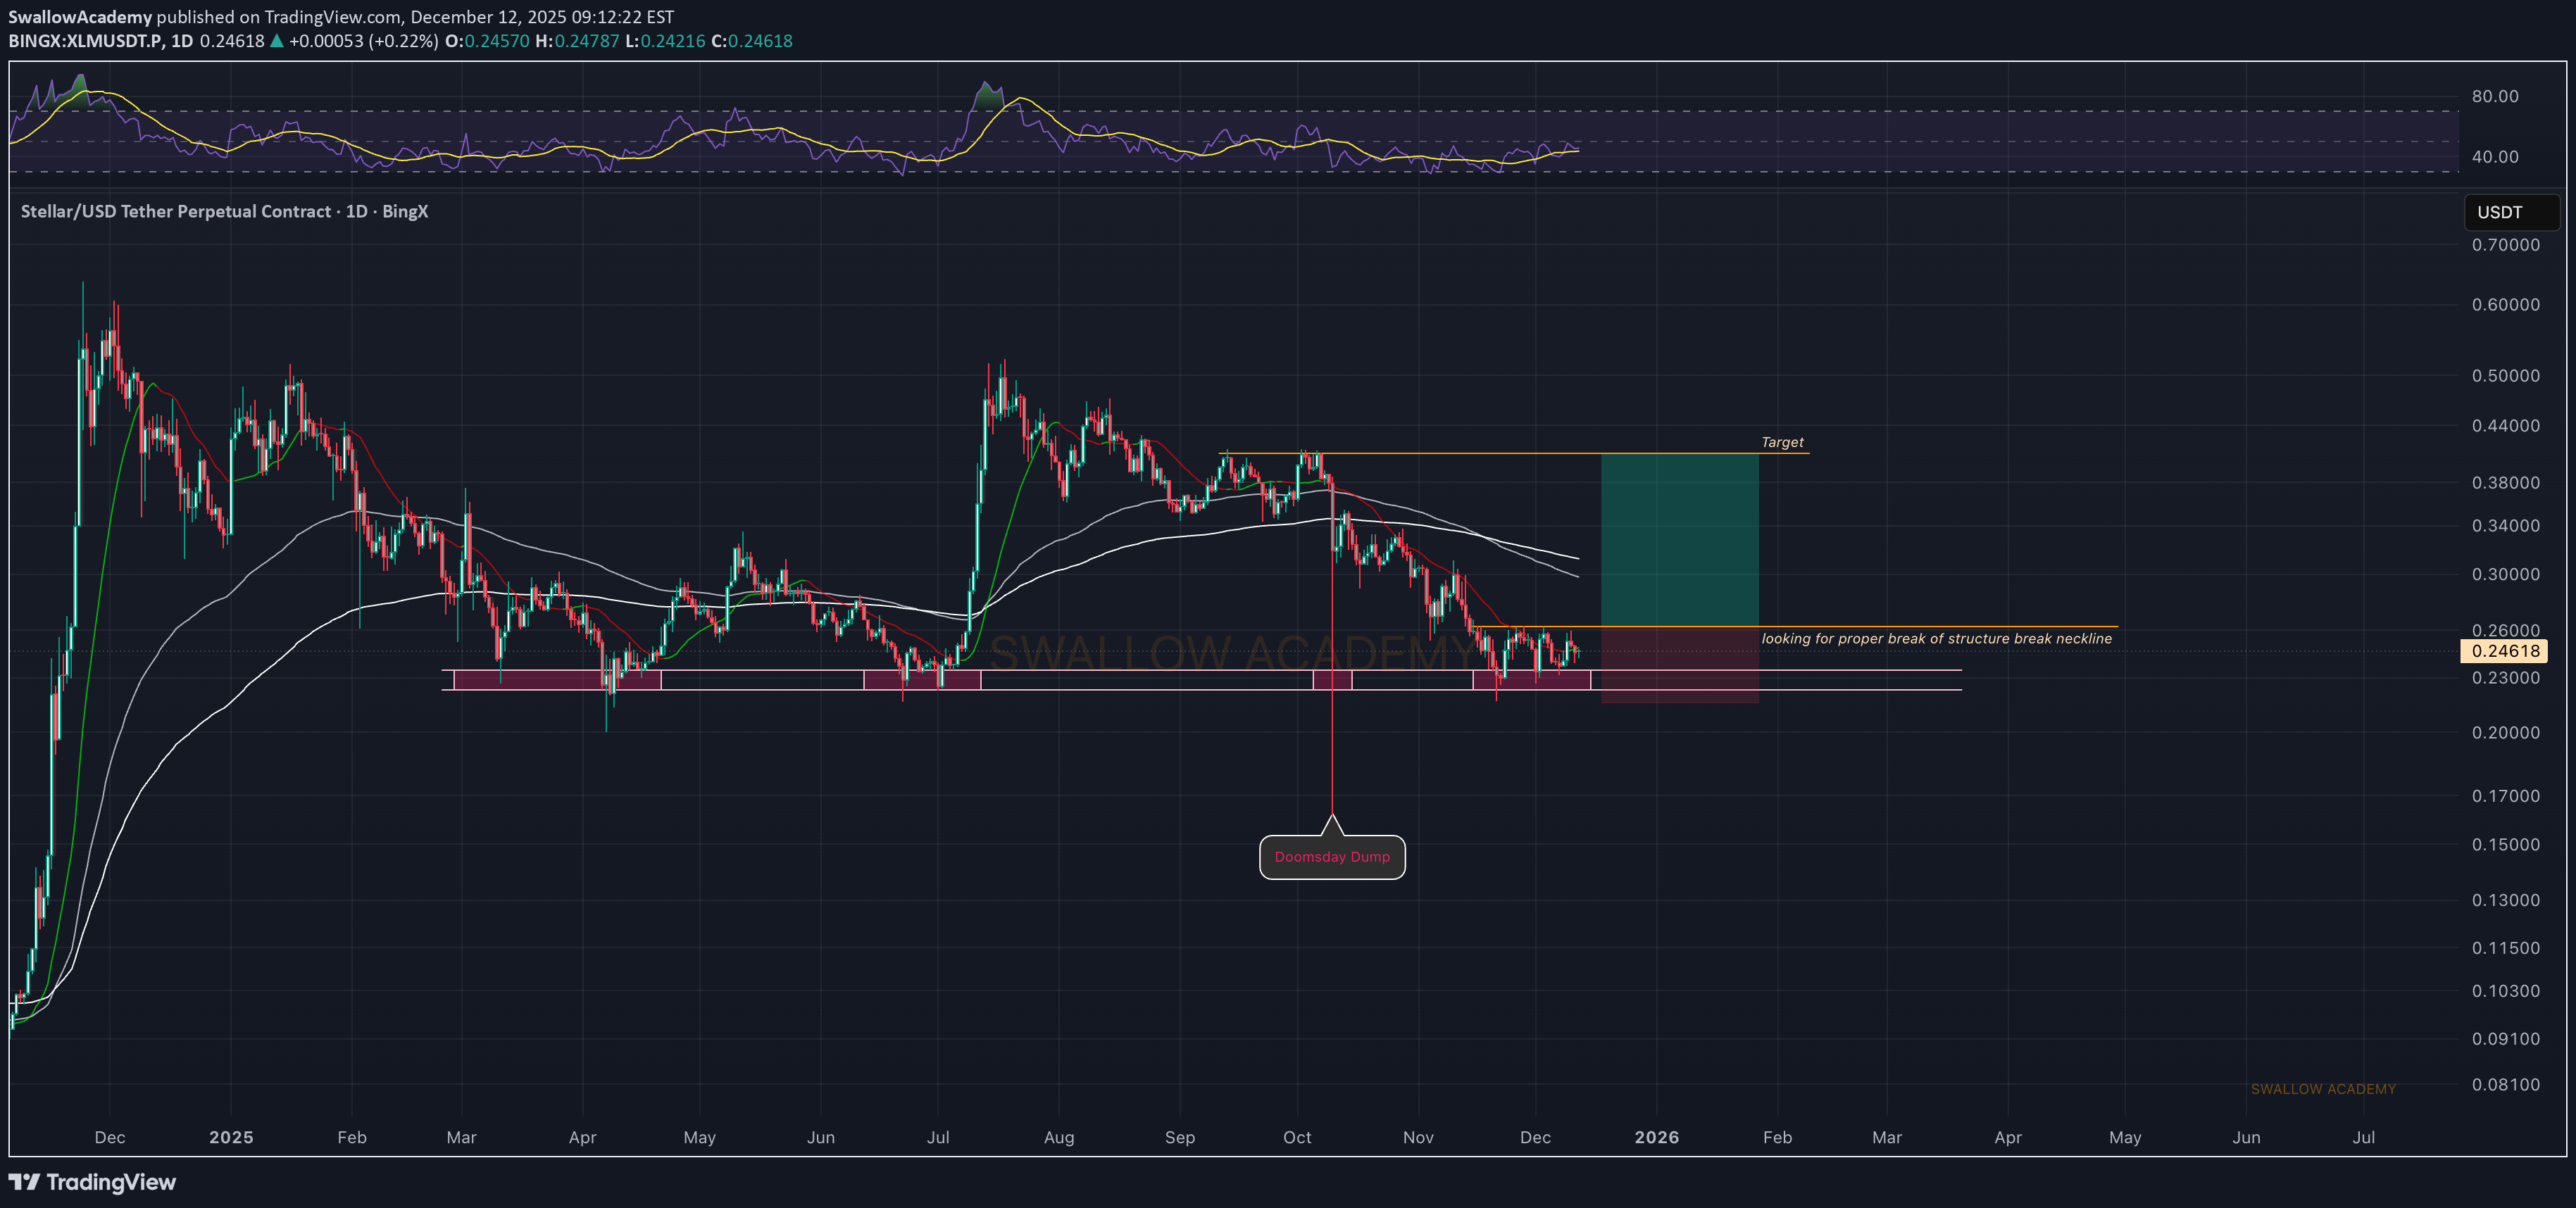
XLM is sitting right on a key support/neckline area, and so far buyers are holding it. We already saw one deeper sweep below, and price managed to get back above that zone, which tells me sellers are losing momentum down here. For longs, we want a clean BOS and a reclaim of the nearby EMAs. If buyers manage to secure that, then a move back into the upper range becomes likely, with the marked target zone as the main objective. Until that happens, this remains a wait-for-confirmation area, but the structure is starting to look constructive. Swallow Academy

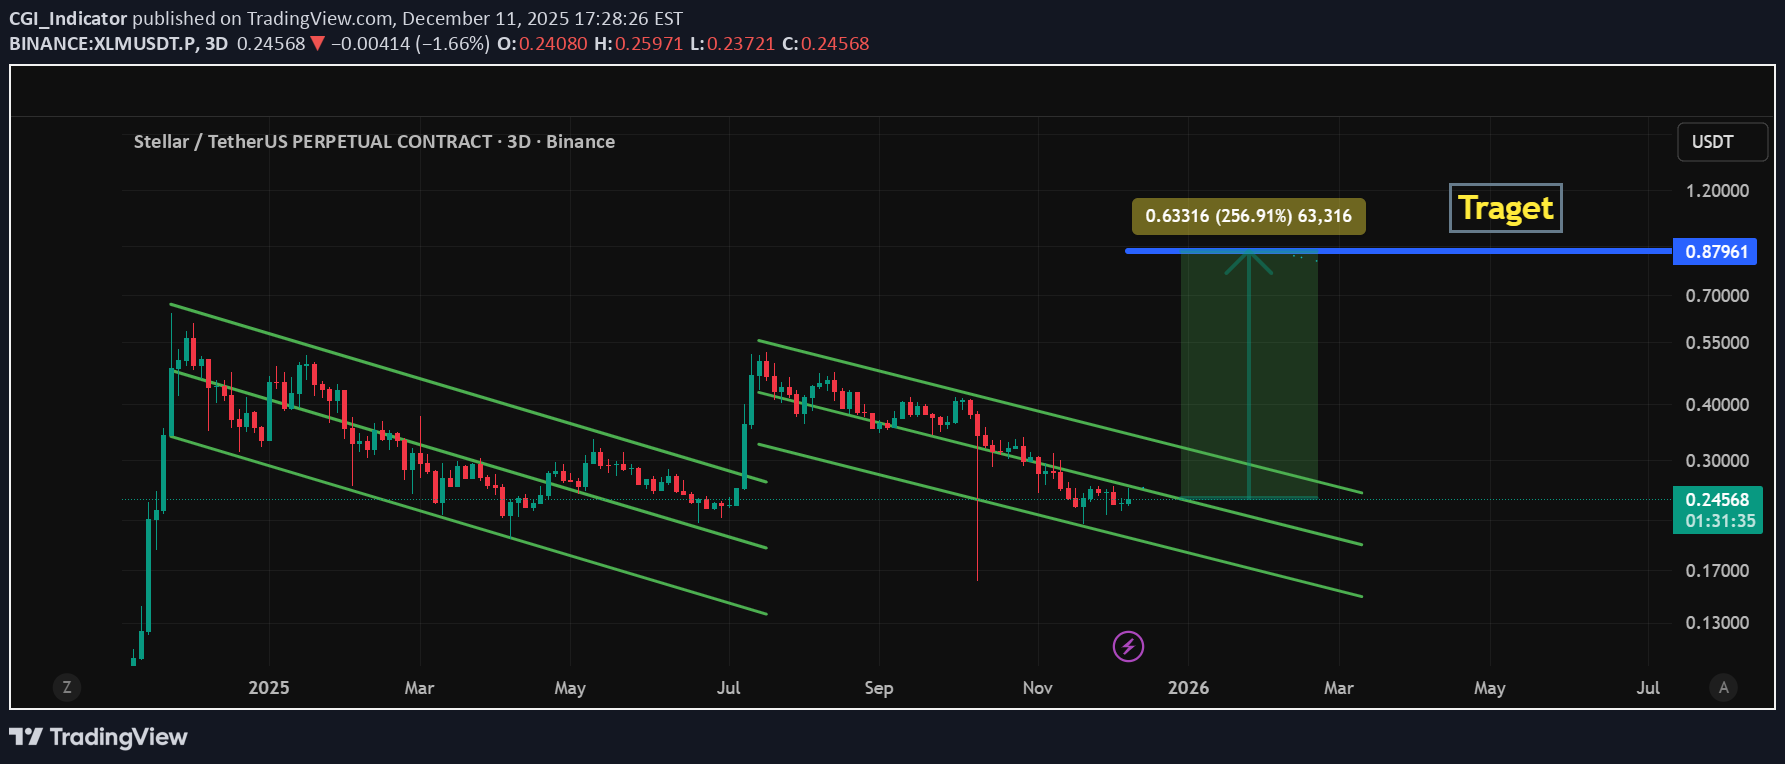
CGI_Indicator

tomas_jntx
XLM Struggles to Build Momentum – Structure Still Neutral
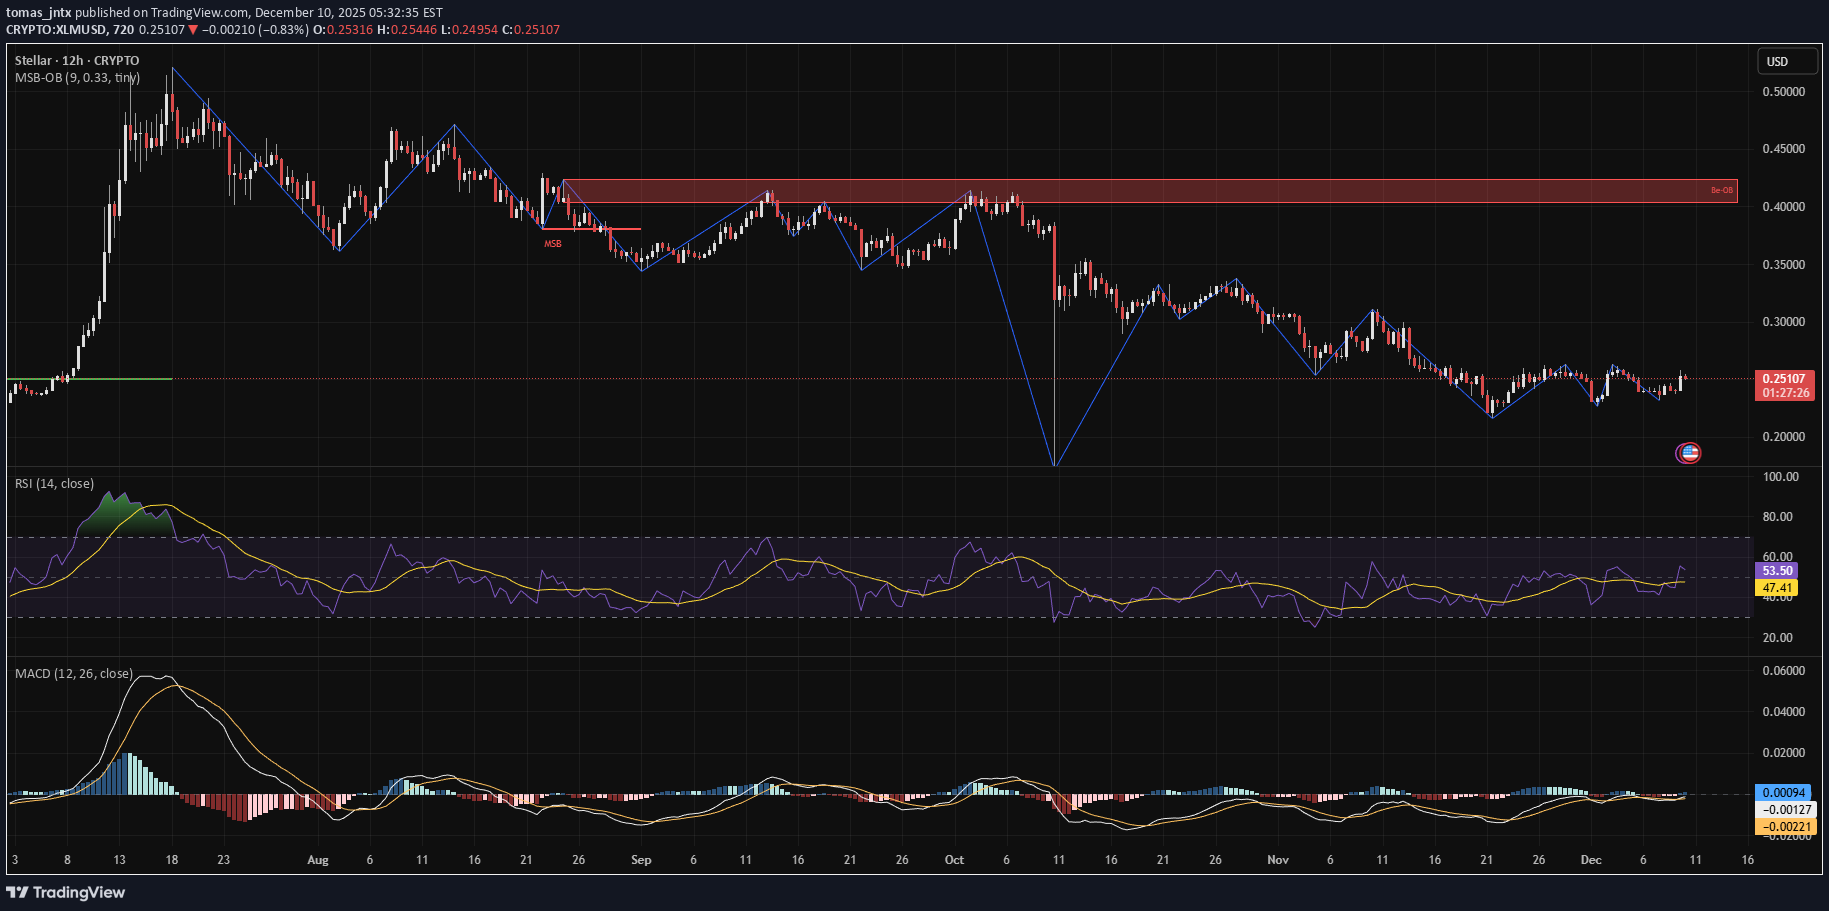
Stellar is bouncing slightly off lows but remains under heavy resistance at $0.35–$0.40. RSI is trying to reclaim 50, but MACD is flat and unconvincing. There’s no MSB flip yet — and recent attempts have lacked volume. A break above $0.27 is required to shift momentum upward. Bias: Neutral Pair: XLM/USDT Timeframe: 12H

ARCHI_TRADES
long xlm
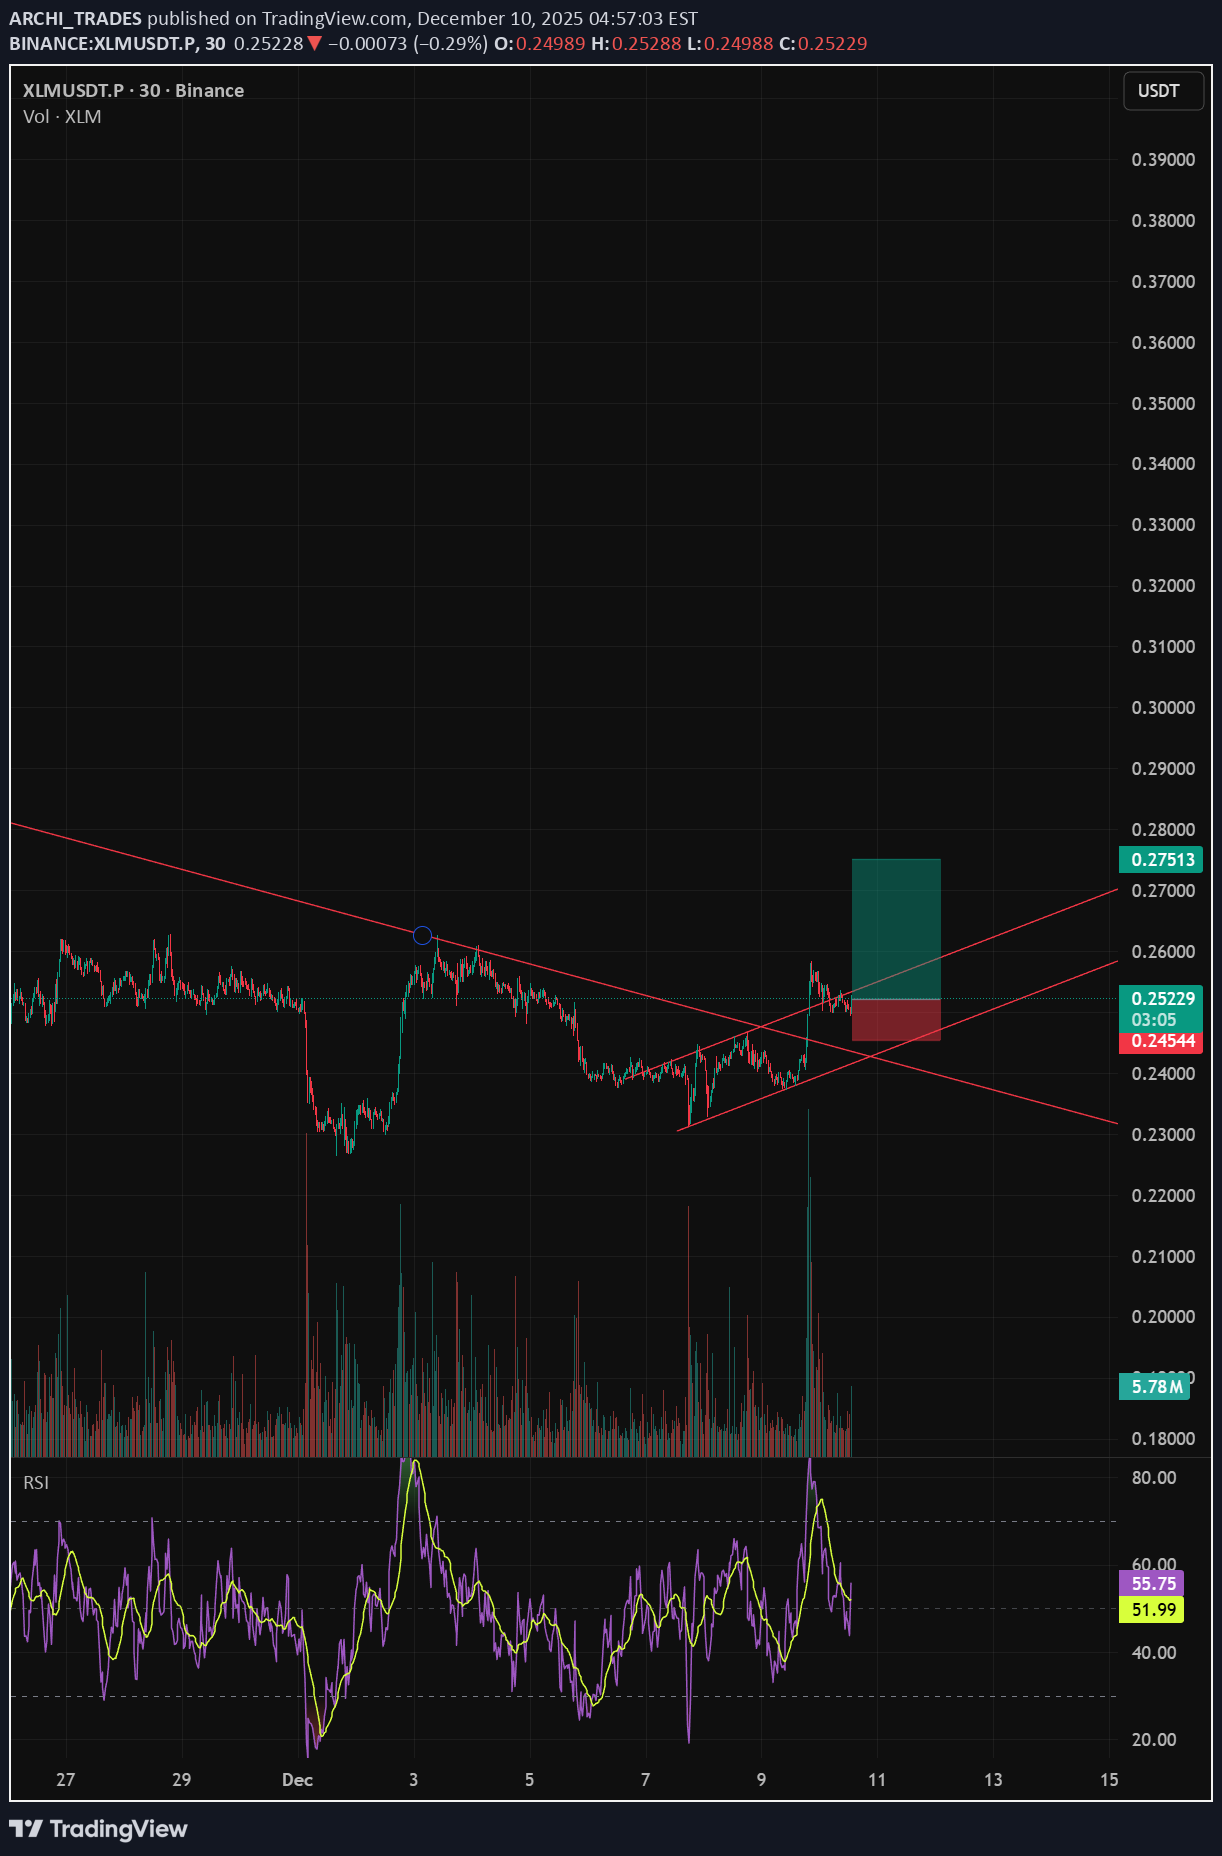
xlm looks bulish It looks very bullish. It is also clear that it has crossed the downtrend line, created a flag, and has also suffered at the flag's location, ready to rise.
Disclaimer
Any content and materials included in Sahmeto's website and official communication channels are a compilation of personal opinions and analyses and are not binding. They do not constitute any recommendation for buying, selling, entering or exiting the stock market and cryptocurrency market. Also, all news and analyses included in the website and channels are merely republished information from official and unofficial domestic and foreign sources, and it is obvious that users of the said content are responsible for following up and ensuring the authenticity and accuracy of the materials. Therefore, while disclaiming responsibility, it is declared that the responsibility for any decision-making, action, and potential profit and loss in the capital market and cryptocurrency market lies with the trader.