
Sohaib_zafar007
@t_Sohaib_zafar007

What symbols does the trader recommend buying?
Purchase History
پیام های تریدر
Filter
Sohaib_zafar007
SUIUSD 30Min Chart Analysis 6-Jan-26

Stop Loss: 2.01 Sell Stop: 1.94 Take Profit 1: 1.86 Take Profit 2: 1.78 Take Profit 3: 1.70 After a sustained bullish trend, a bearish divergence has formed, indicating weakening upward momentum and a potential trend reversal. If the price breaks below the Sell Stop level at 1.94, it may confirm a bearish move, with downside targets at 1.86, 1.78, and 1.70. ⚠️ Always remember to protect your capital with a proper stop-loss and disciplined risk management.
Sohaib_zafar007
Gold 30Min Chart Analysis 6-Jan-2026

Stop Loss: 4,475 Sell Stop: 4,445 Take Profit 1: 4,413 Take Profit 2: 4,383 Take Profit 3: 4,353 After a strong bullish move, a bearish divergence has formed on the 30-minute and 15-minute timeframes, signaling weakening upward momentum and a potential downside reversal. If the price breaks below the Sell Stop level at 4,445, it may confirm a bearish move toward the listed take-profit targets. ⚠️ Always remember to protect your capital with a proper stop-loss and disciplined risk management.
Sohaib_zafar007
ETHUSD 29-Dec-25
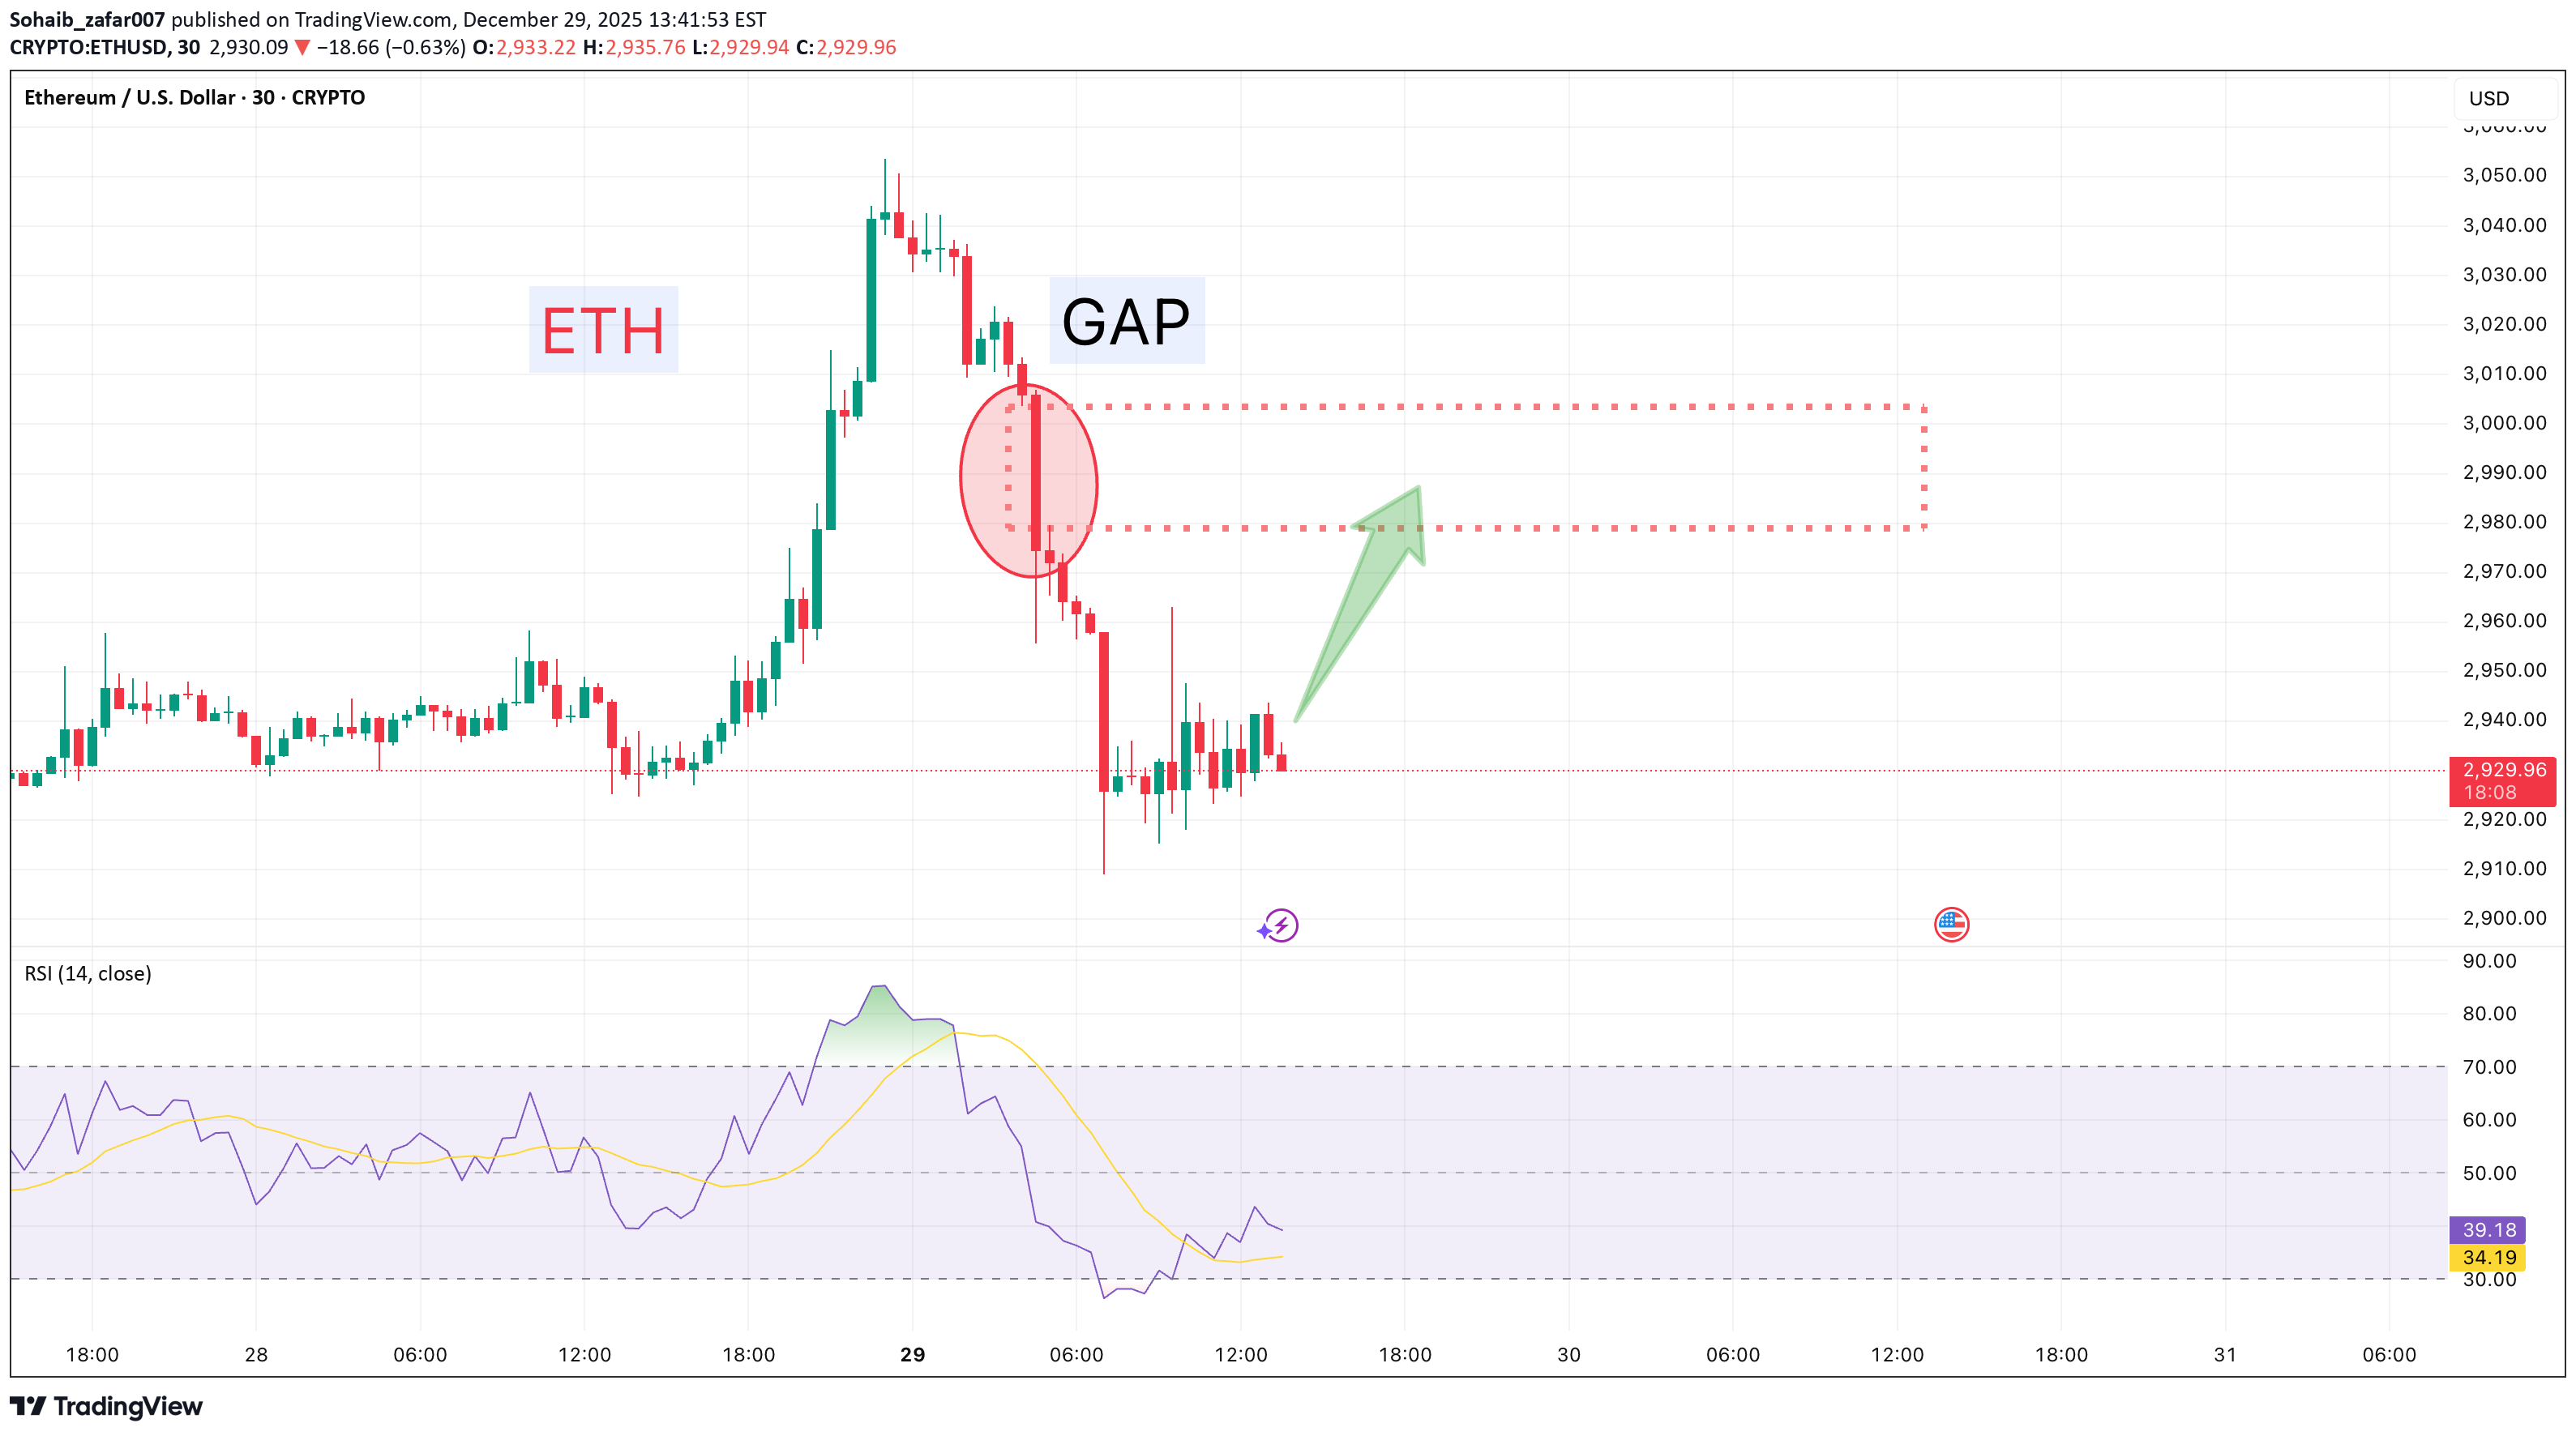
During chart analysis, a gap has been identified, similar to the structure previously observed on BTC. Based on this behavior, ETH appears to be following BTC’s price pattern, suggesting a potential bullish move as the market may attempt to fill the gap. ⚠️ Always remember to protect your capital with a proper stop-loss and disciplined risk management.Gap Filled
Sohaib_zafar007
BTCUSD CHART ANALYSIS 29-Dec-25

A gap pattern has emerged on the chart, suggesting a potential bullish move as price may attempt to fill the gap. If momentum supports this scenario, the market could continue upward to cover the gap area. ⚠️ Always remember to protect your capital with a proper stop-loss and disciplined risk management.Gap filled
Sohaib_zafar007
TAOUSDT Chart Analaysis 25-Dec-25
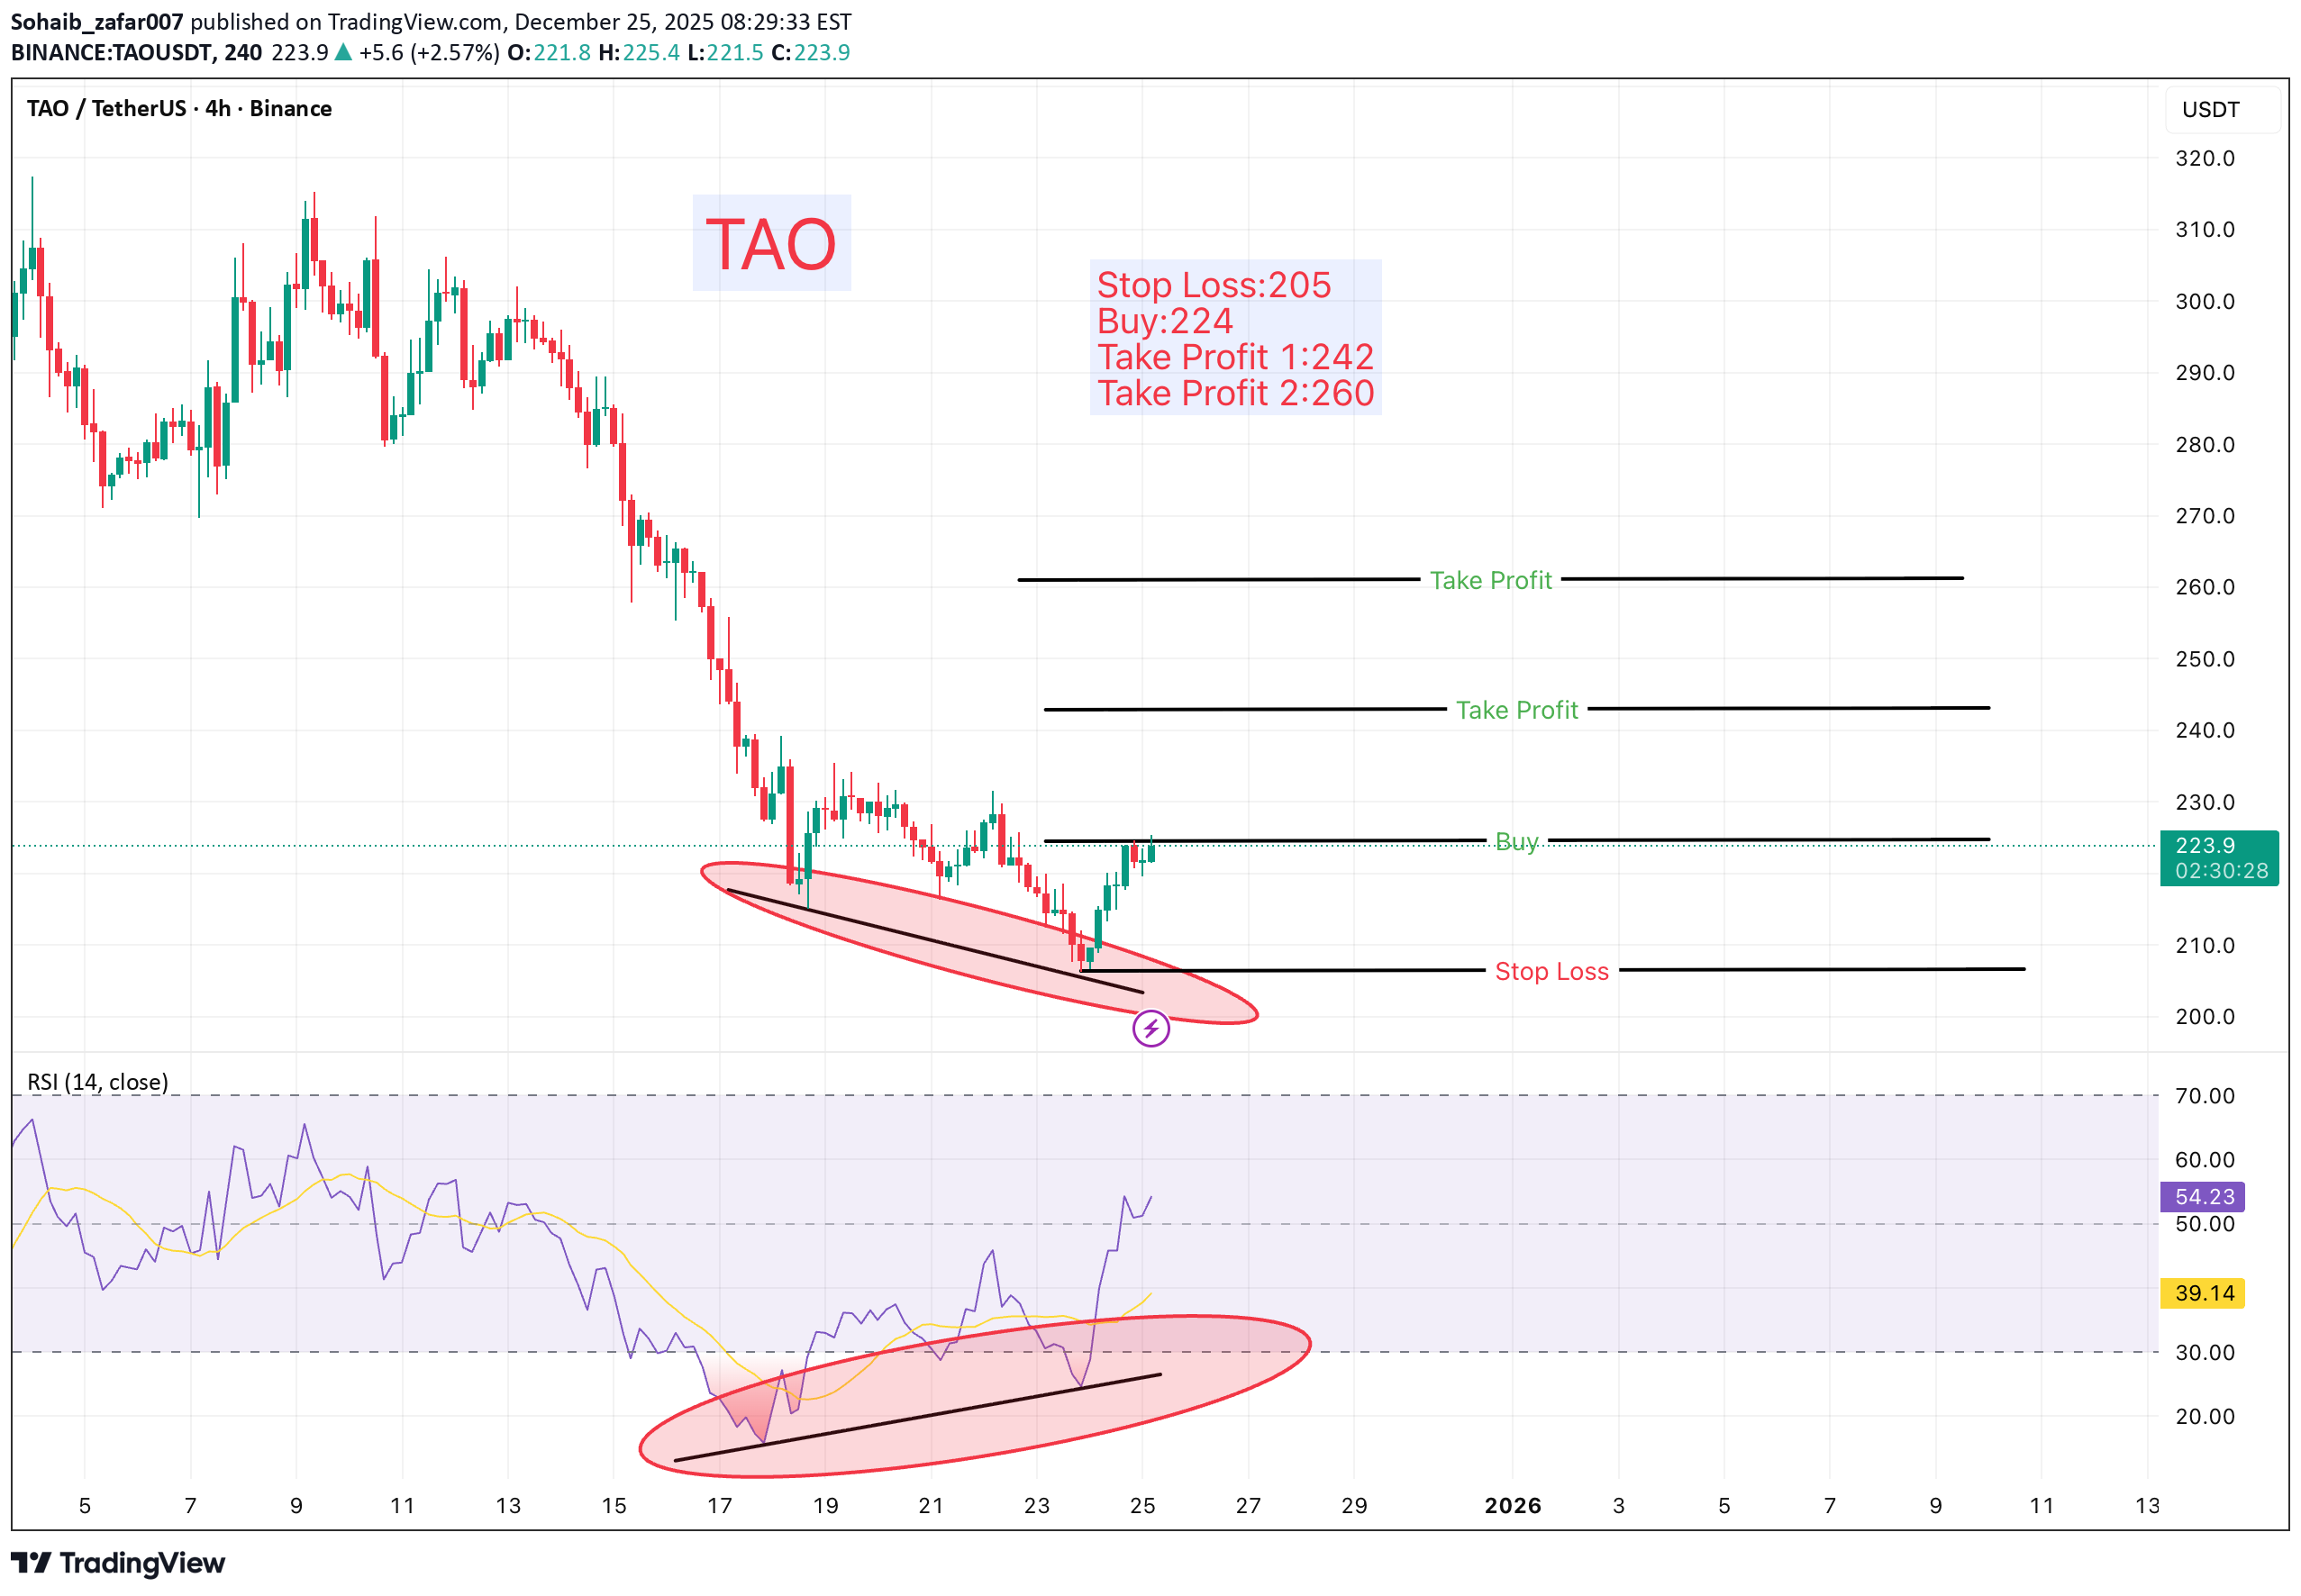
Stop Loss: 205 Buy Entry: 224 Take Profit 1: 242 Take Profit 2: 260 Following a bearish phase, a clear bullish divergence has formed across the 1H, 4H, and 1D timeframes, signaling a potential trend reversal from bearish to bullish. The suggested buy entry is around 224, with upside targets at 242 and 260. ⚠️ Always remember to protect your capital with a proper stop-loss and disciplined risk management.
Sohaib_zafar007
UNIUSDT 30Min Chart Analysis 21-Dec-25

Stop Loss: 6.50 Sell Stop: 6.30 Take Profit 1: 6.10 Take Profit 2: 5.90 After a sustained bullish trend, a bearish divergence has formed across the 4H, 1H, 45-minute, and 30-minute timeframes, signaling weakening bullish momentum and a potential trend reversal. If the price breaks below the Sell Stop level at 6.30, it may confirm a bearish move, with downside targets at 6.10 and 5.90. ⚠️ Always remember to protect your capital with a proper stop-loss and disciplined risk management.
Sohaib_zafar007
AXLUSDT 1D Chart Analysis 18-Dec-25
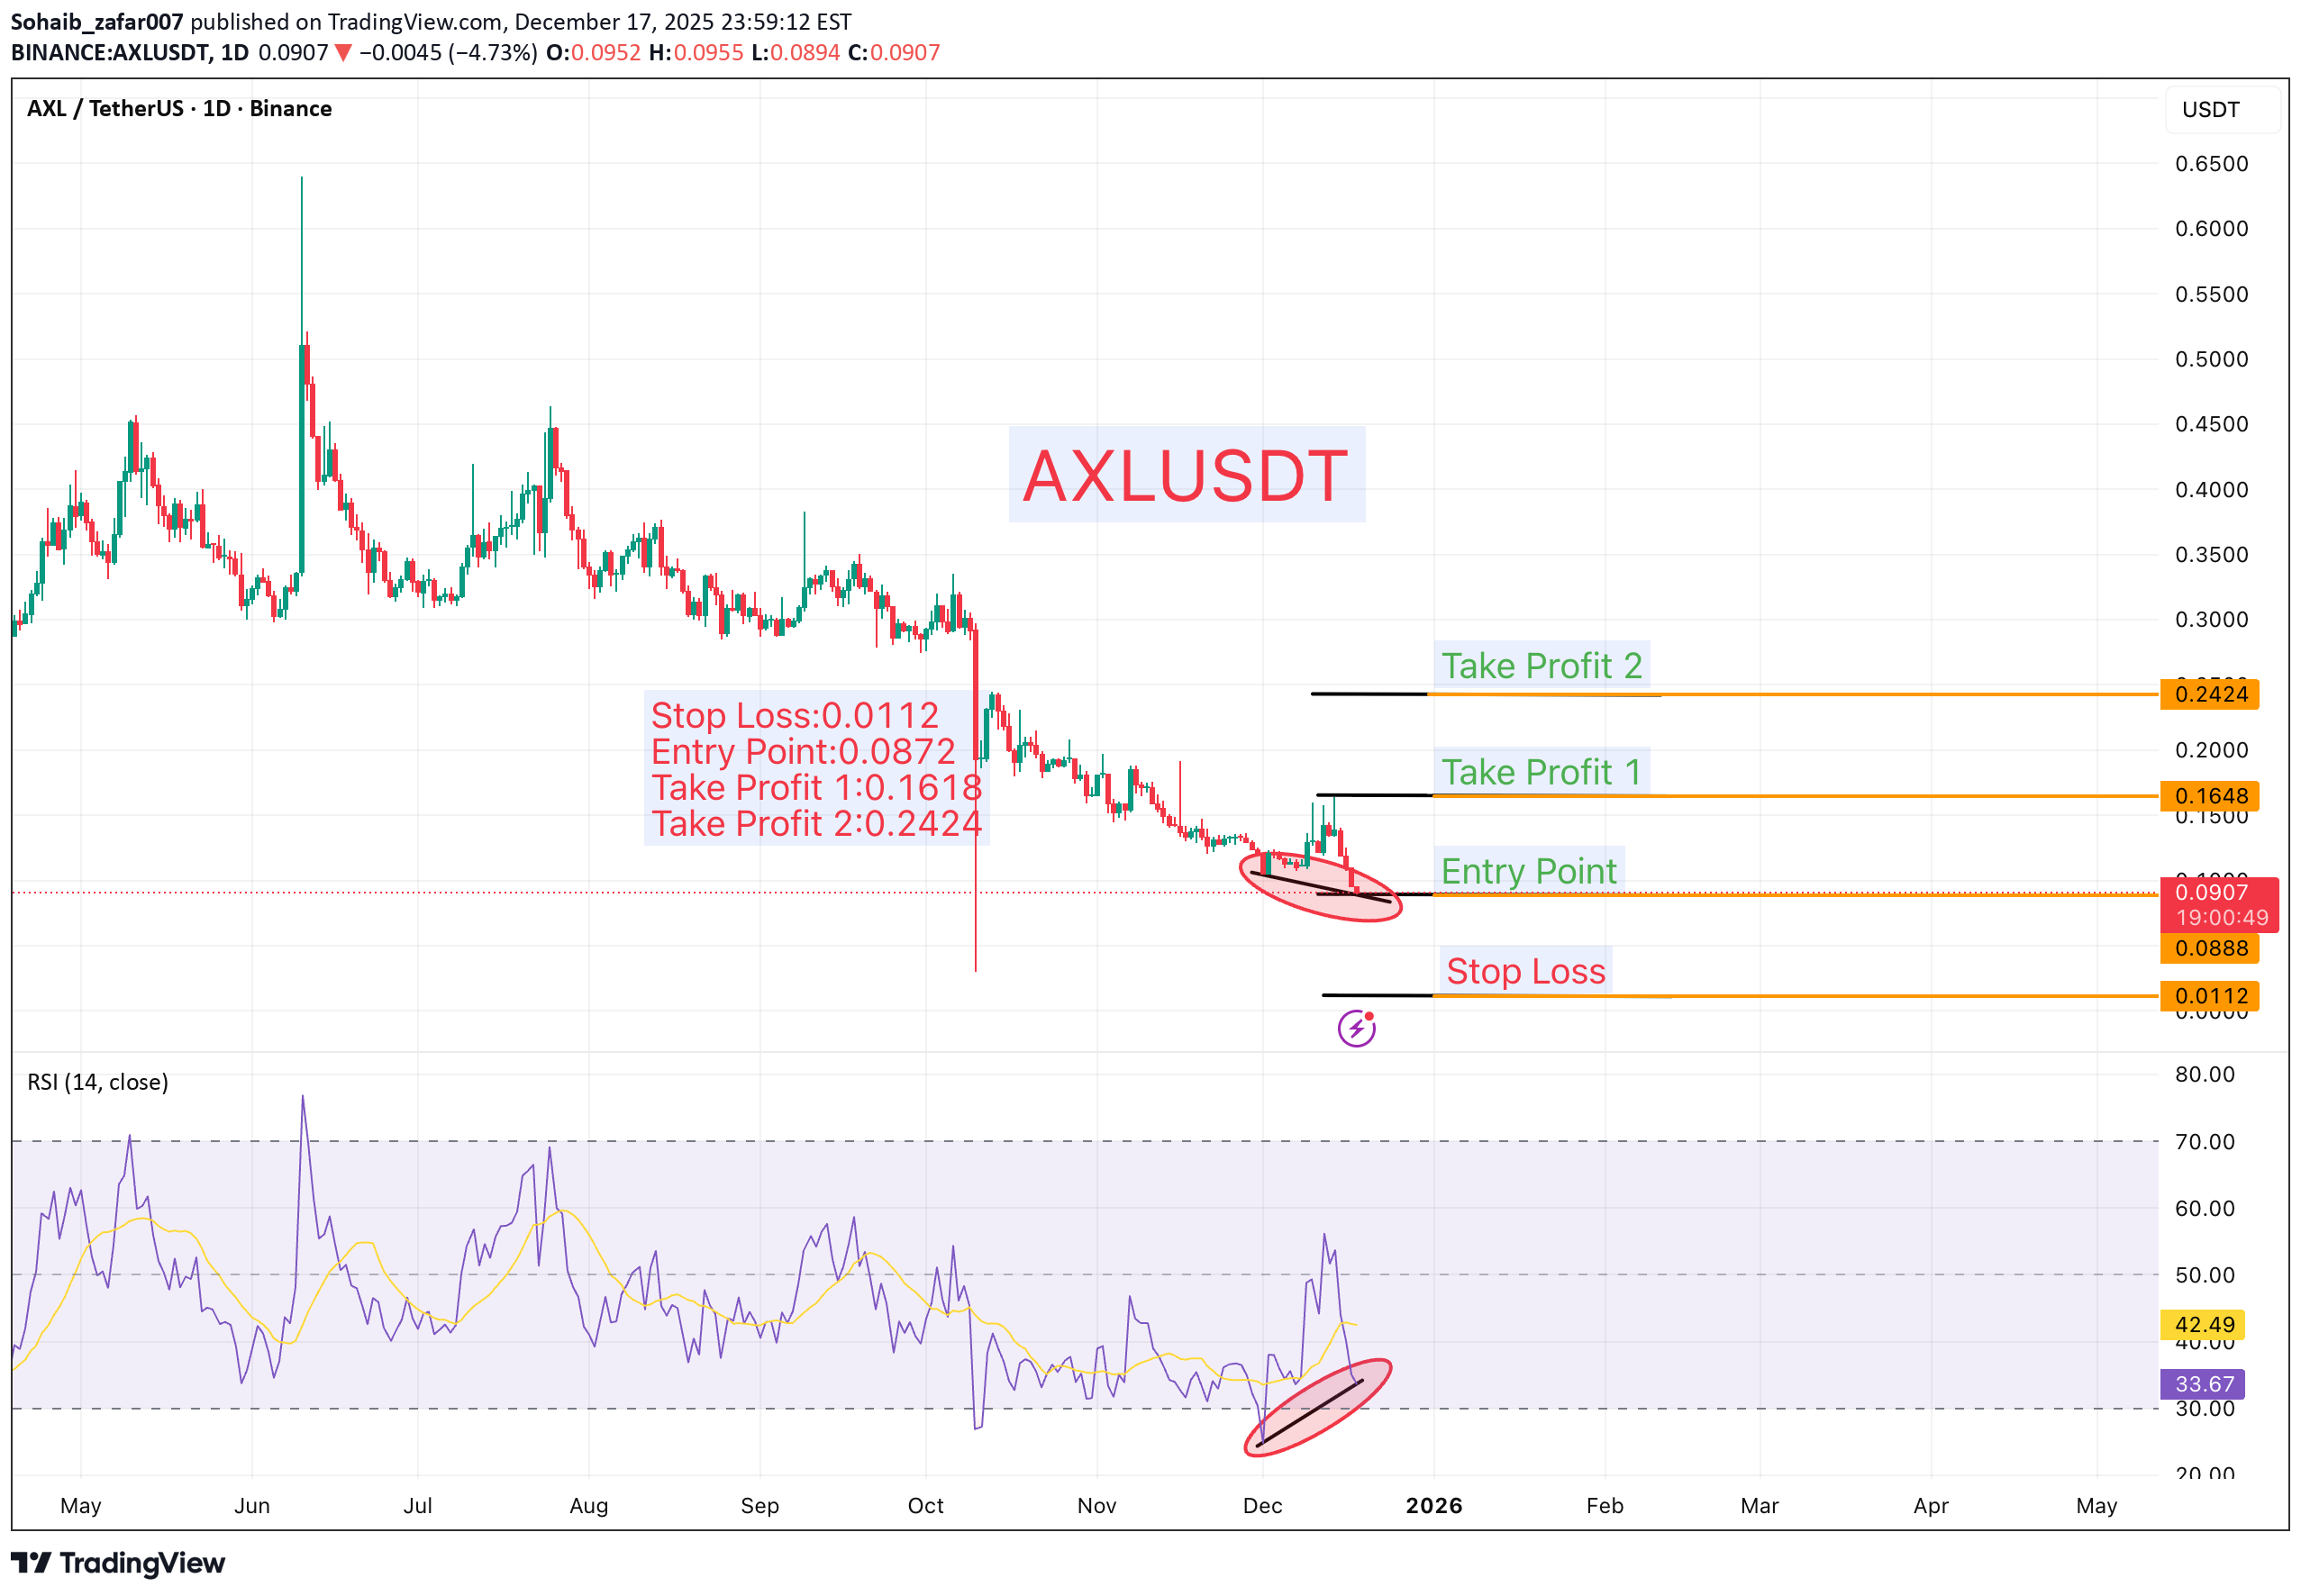
Stop Loss: 0.0112 Entry Point: 0.0872 Take Profit 1: 0.1618 Take Profit 2: 0.2424 Based on 1D and 4H chart analysis, a clear bullish divergence has formed, indicating a potential trend reversal from bearish to bullish. The suggested entry is around 0.0872, with expectations for the price to move toward the projected targets at 0.1618 and 0.2424. ⚠️ Always remember to protect your capital with a proper stop-loss and disciplined risk management.
Sohaib_zafar007
تحلیل تکنیکال DOTUSDT: سیگنال صعودی قوی با واگرایی مثبت! (اهداف و حد ضرر)
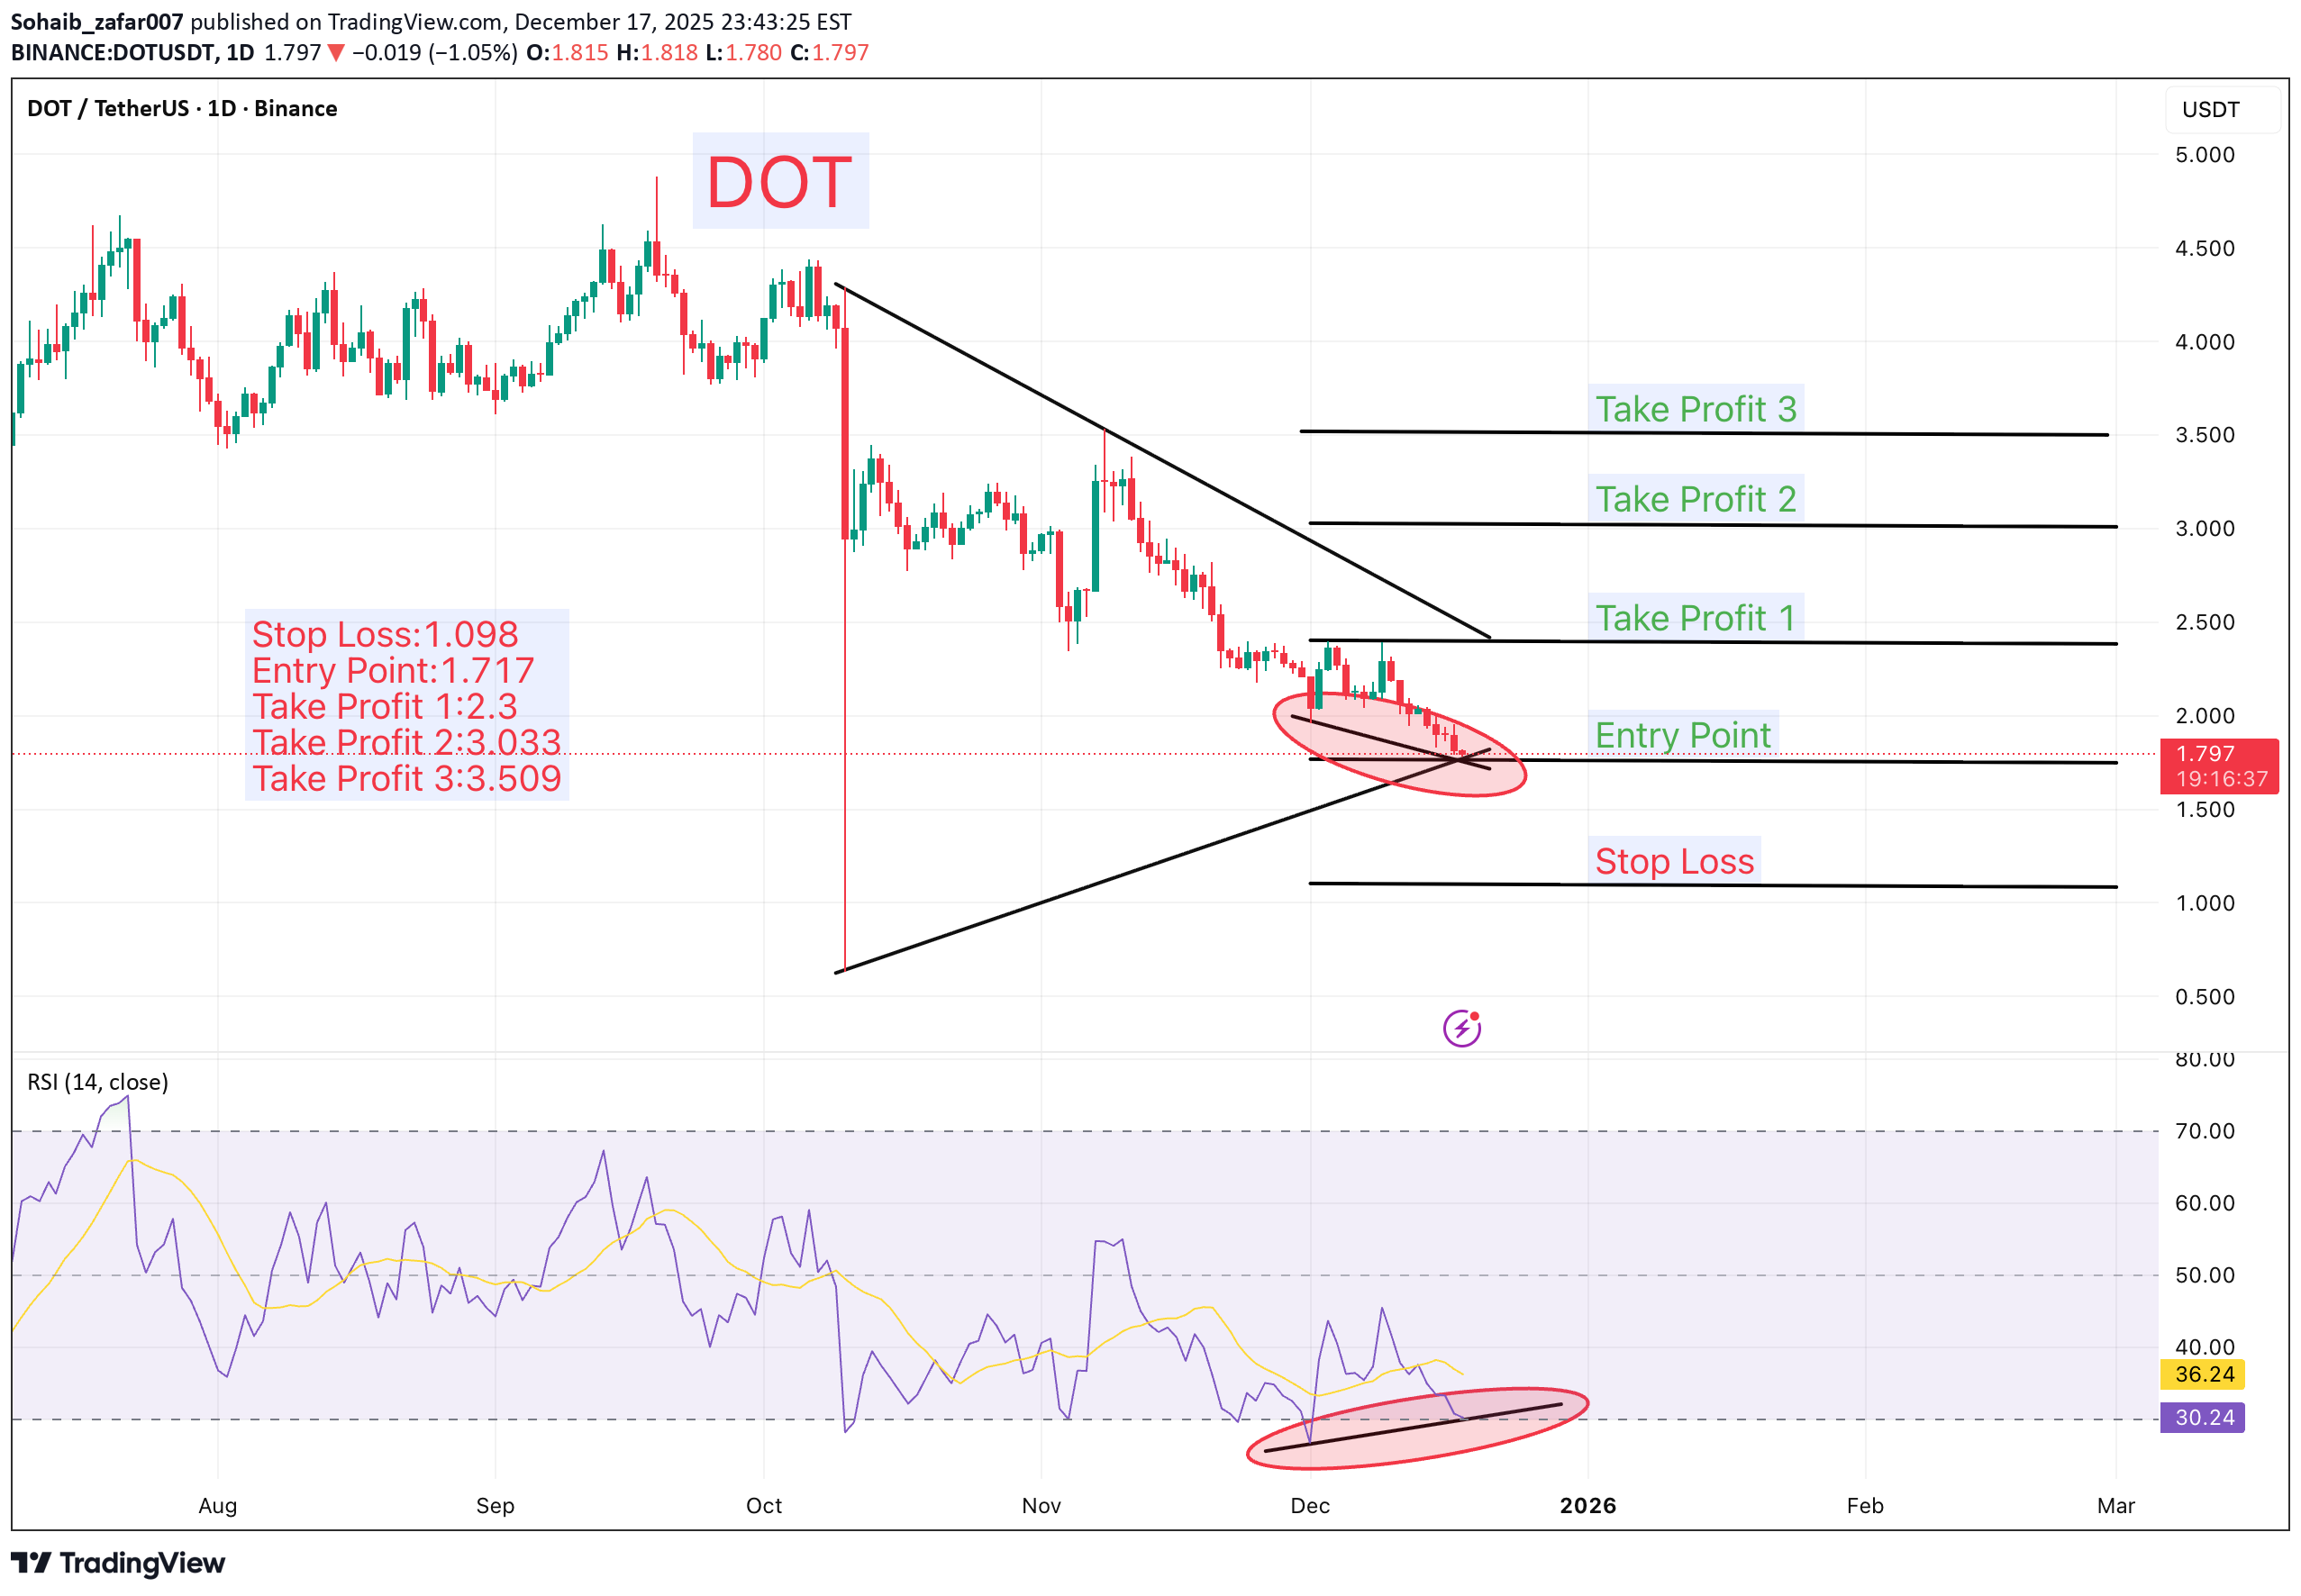
Stop Loss: 1.098 Entry Point: 1.717 Take Profit 1: 2.300 Take Profit 2: 3.033 Take Profit 3: 3.509 Bullish divergence has formed across the 1D, 4H, and 1H timeframes, indicating a potential reversal from a bearish to a bullish trend. The suggested entry is around 1.717, with expectations for price to move toward the projected targets at 2.300, 3.033, and 3.509. ⚠️ Always remember to protect your capital with a proper stop-loss and disciplined risk management.
Sohaib_zafar007
ZROUSDT Chart Anlaysis W 13-Dec-25
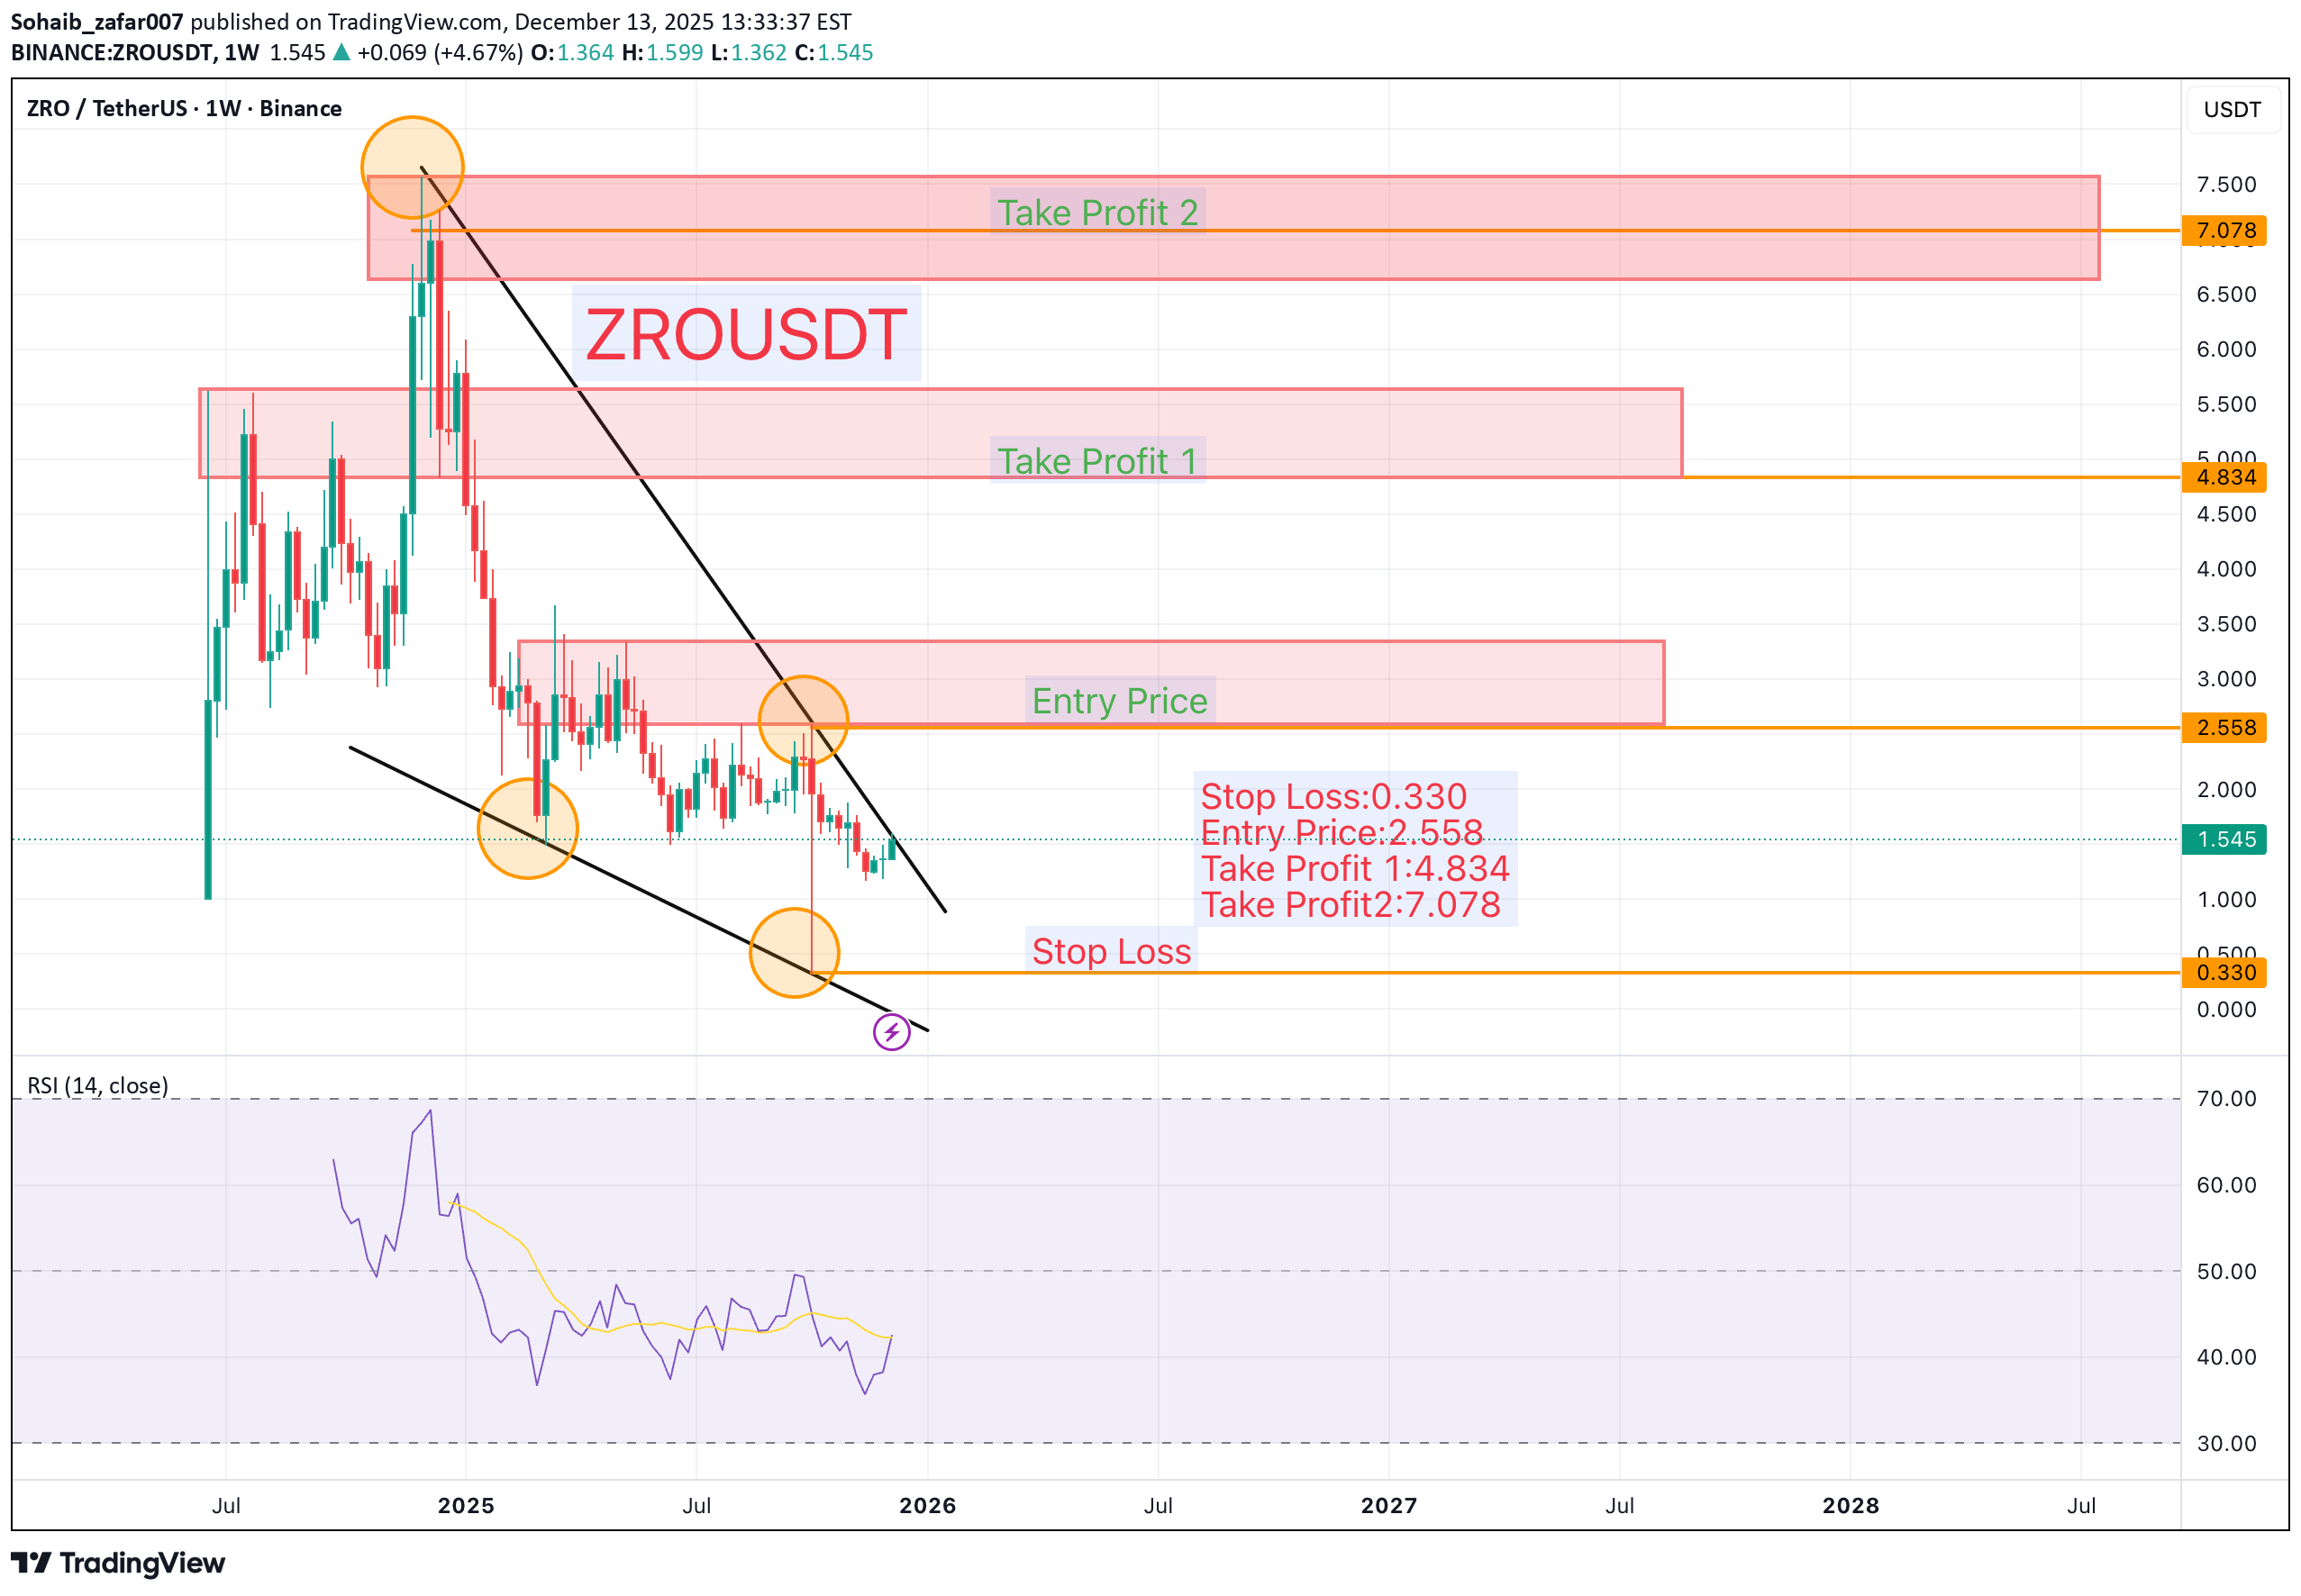
Stop Loss: 0.330 Entry Price: 2.558 Take Profit 1: 4.834 Take Profit 2: 7.078 On the weekly chart, a Falling Wedge pattern has formed, indicating a potential shift in trend from bearish to bullish. The suggested entry is at 2.558, with expectations for the price to move toward the projected take-profit levels at 4.834 and 7.078 as bullish momentum develops. ⚠️ Always remember to protect your capital with a proper stop-loss and disciplined risk management.
Sohaib_zafar007
تحلیل تکنیکال INJ/USDT: مثلث متقارن و سیگنال تغییر روند صعودی (سطوح ورود و خروج دقیق)

Stop Loss: 4.93 Buy Stop: 7.02 Take Profit 1: 8.92 Take Profit 2: 11.07 Take Profit 3: 13.34 A Symmetrical Triangle has formed following a bearish phase, supported by a clear bullish RSI divergence, indicating a potential trend reversal. If the price breaks above the Buy Stop level at 7.02, it may confirm bullish momentum, with upside targets at 8.92, 11.07, and 13.34. ⚠️ Always remember to protect your capital with a proper stop-loss and disciplined risk management.
Disclaimer
Any content and materials included in Sahmeto's website and official communication channels are a compilation of personal opinions and analyses and are not binding. They do not constitute any recommendation for buying, selling, entering or exiting the stock market and cryptocurrency market. Also, all news and analyses included in the website and channels are merely republished information from official and unofficial domestic and foreign sources, and it is obvious that users of the said content are responsible for following up and ensuring the authenticity and accuracy of the materials. Therefore, while disclaiming responsibility, it is declared that the responsibility for any decision-making, action, and potential profit and loss in the capital market and cryptocurrency market lies with the trader.