
Bixley2
@t_Bixley2

What symbols does the trader recommend buying?
Purchase History
پیام های تریدر
Filter
Bixley2
HOOD - Speculative Cup and Handle
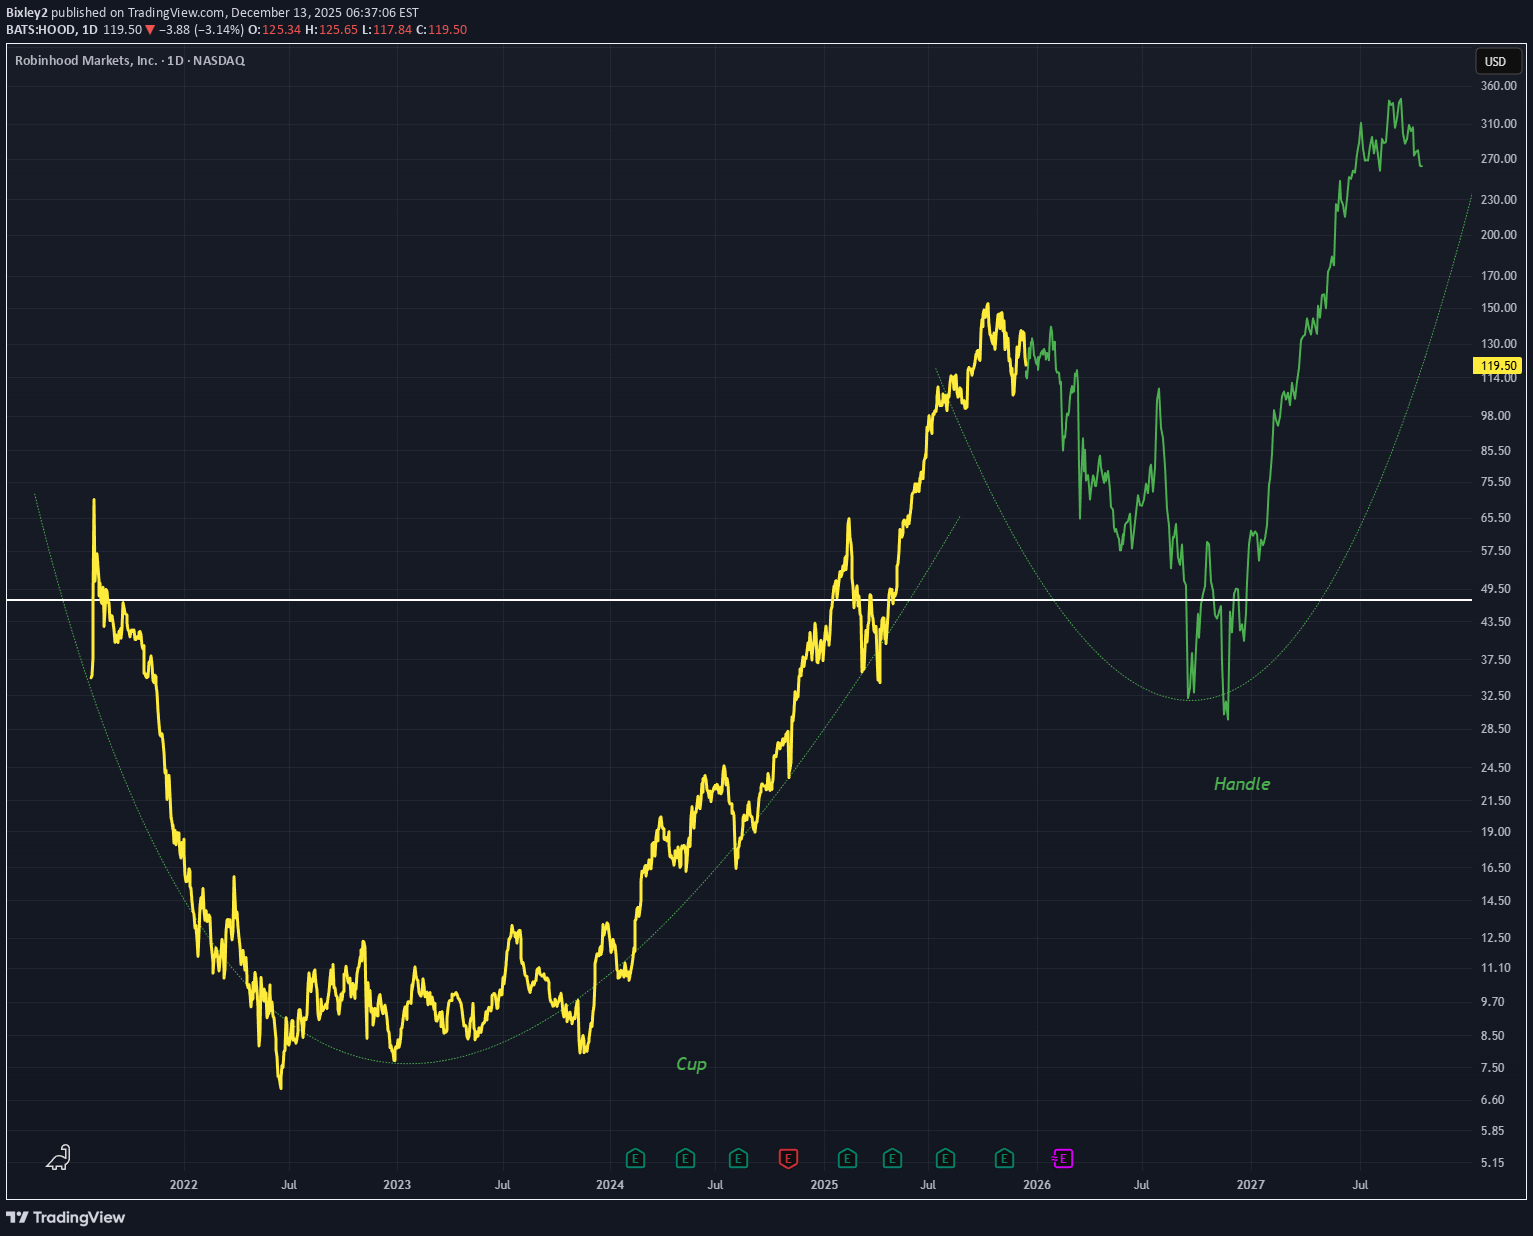
Using bars patterns to plot a handle to the current massive cup looking structure on HOOD I think price will hit the horizontal white line again before it continues to rise again Daily timeframe
Bixley2
TSLA - Huge Ascending Triangle to Push New Highs
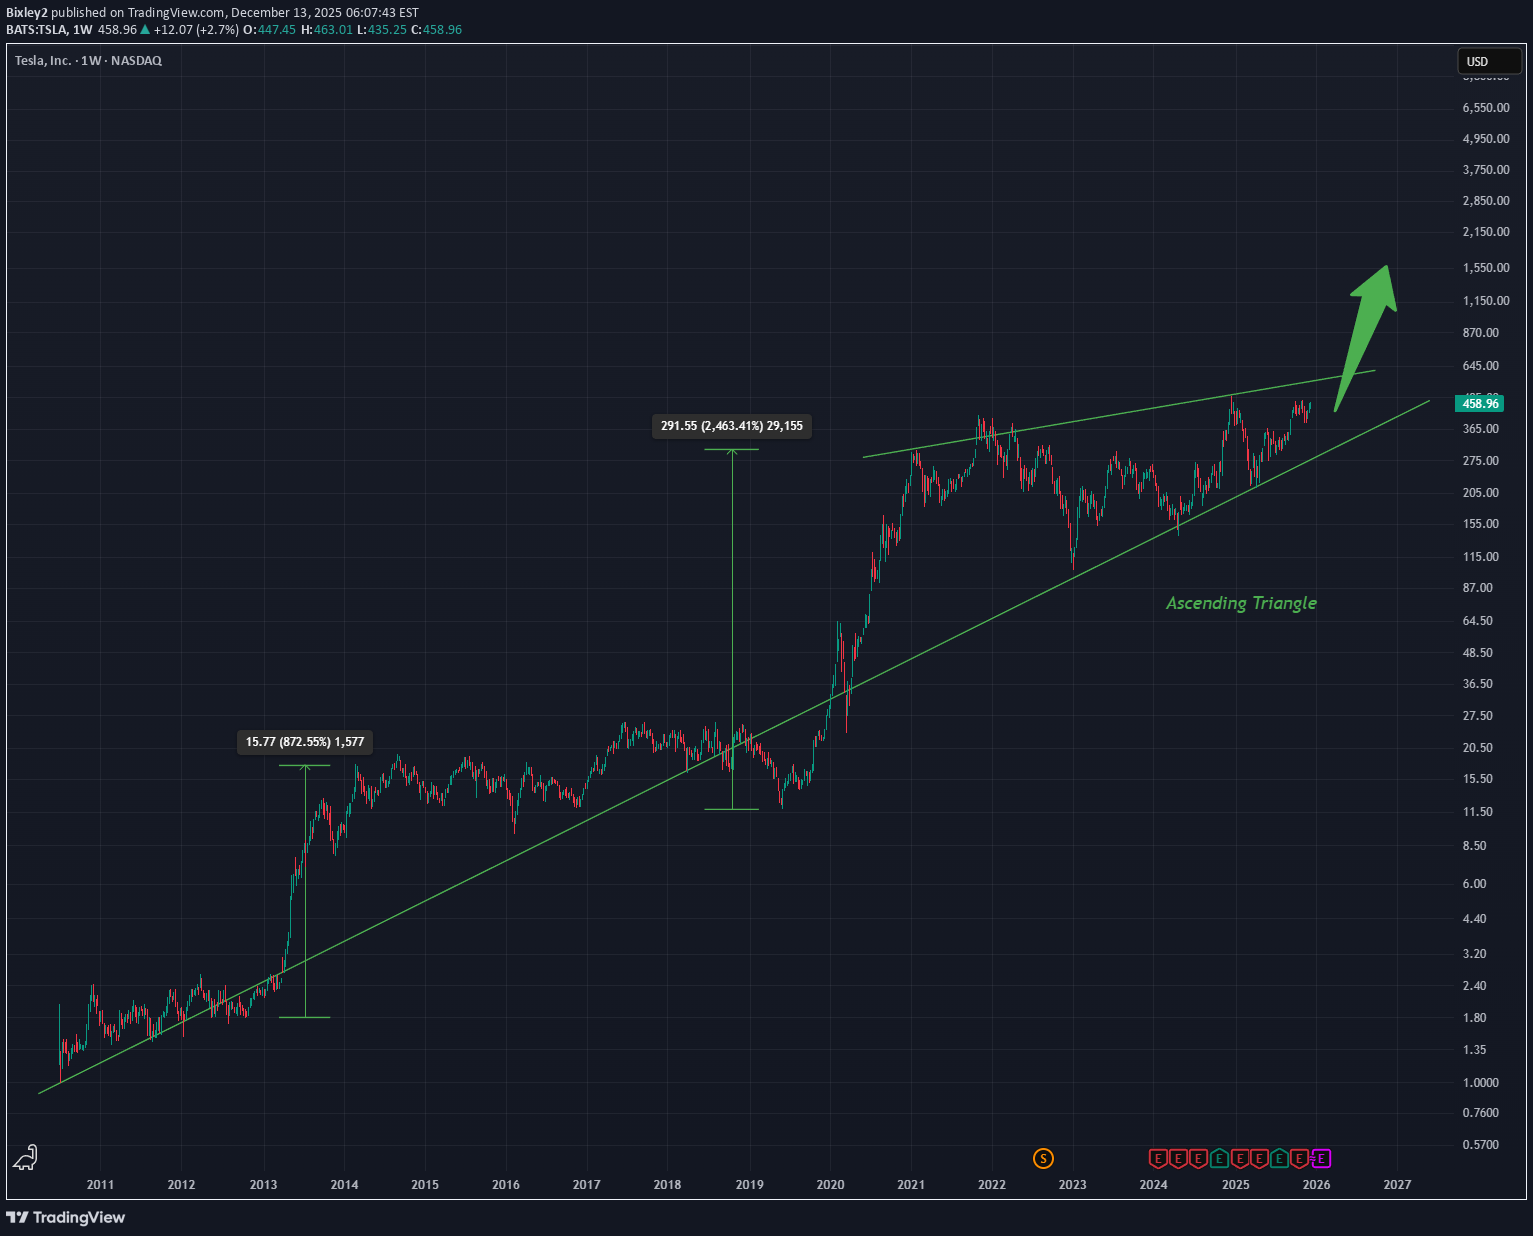
Im seeing this pattern all over gold and silver and now I see it on TSLA I expect the same outcome as gold with a huge breakout of the triangle to the upside Weekly timeframe is poised for upside
Bixley2
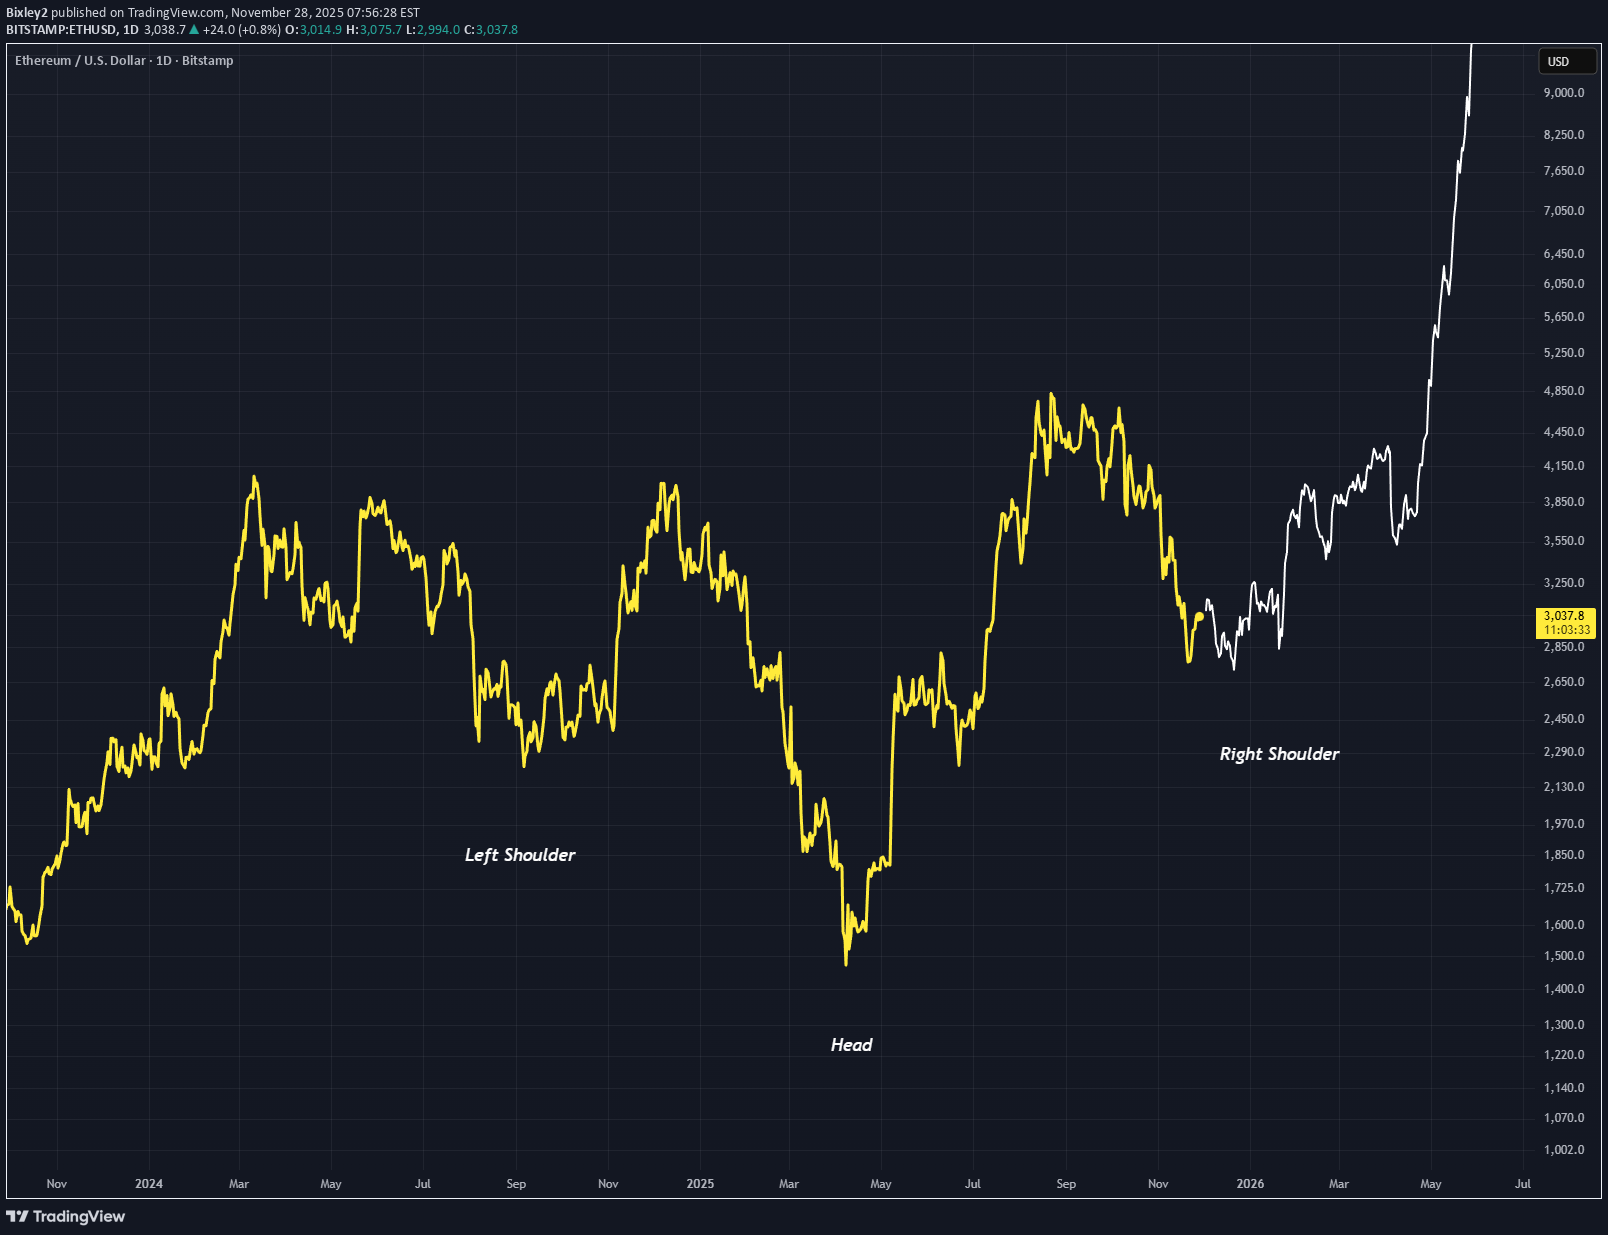
ETHUSD - Waiting for Breakout
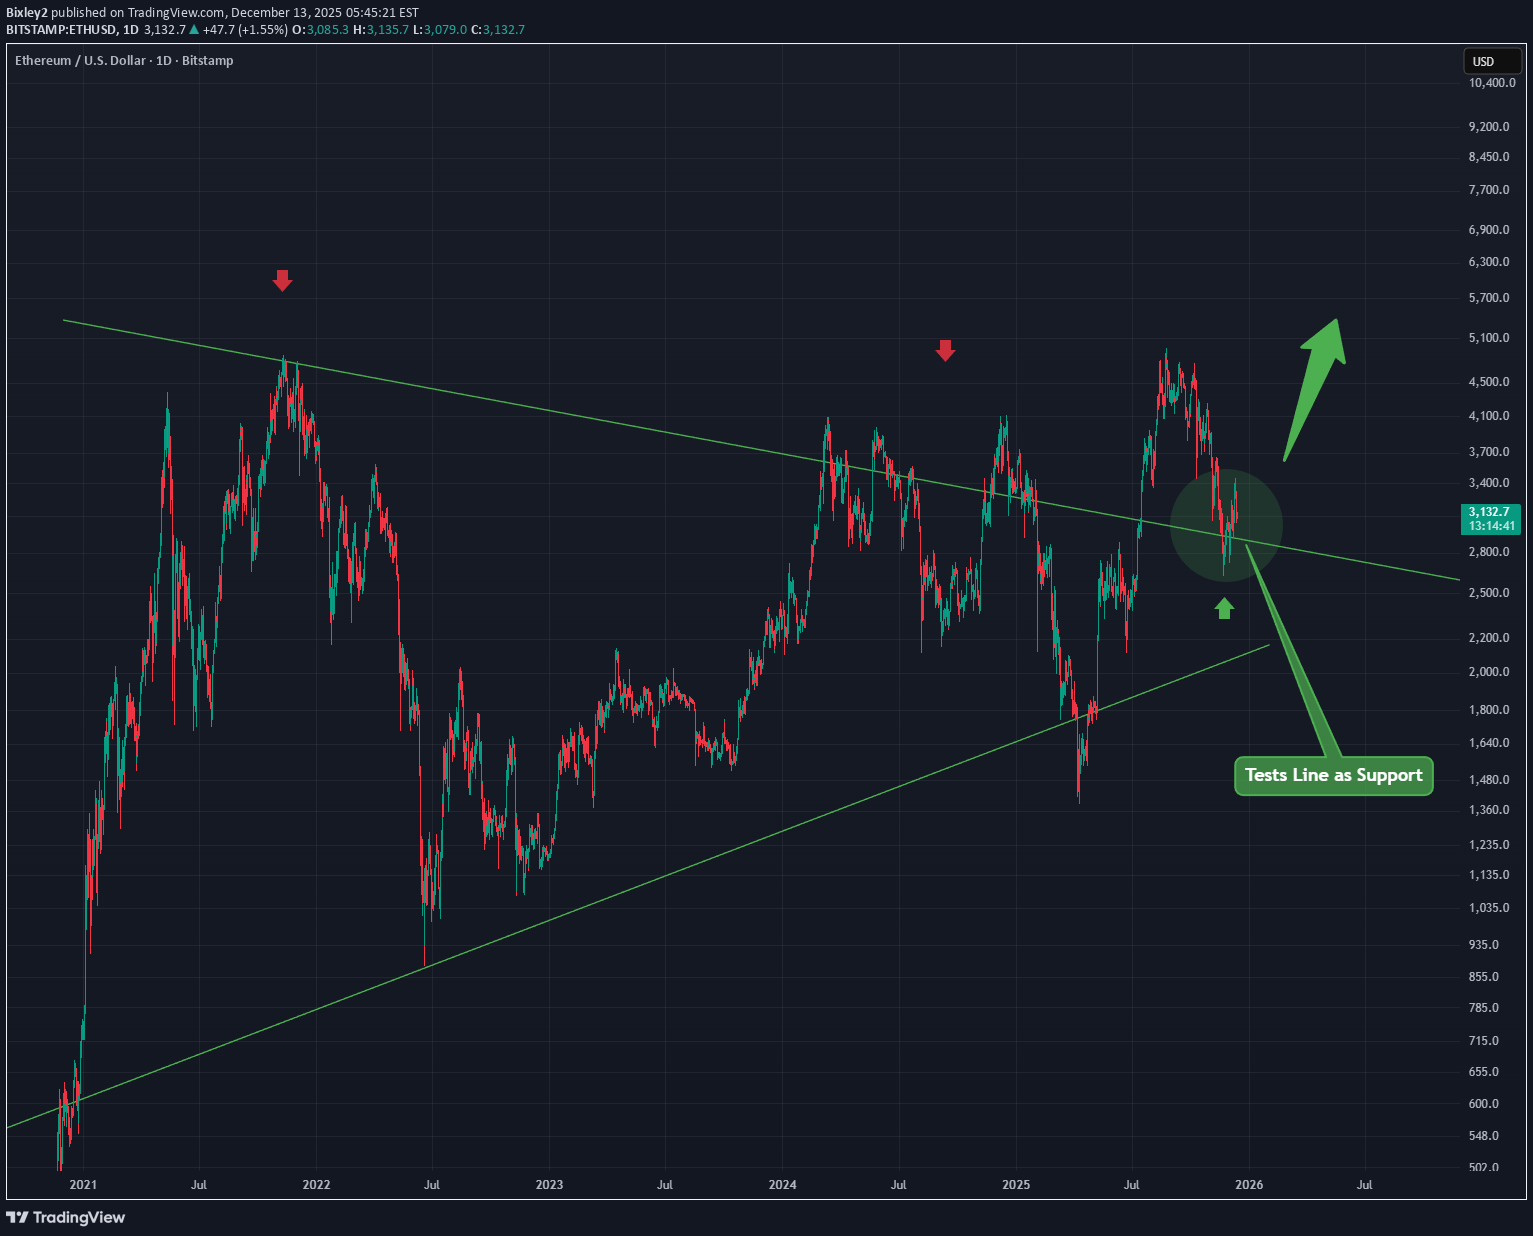
This resistance line is being tested for the final time right now as support. Prior this line has been seen as strong resistance since the last bull run. Price will likely break out strongly after the retest is done due to no resistance. Still hodling out for an alt season Daily timeframe
Bixley2
BTCUSD - Bullish Scenario
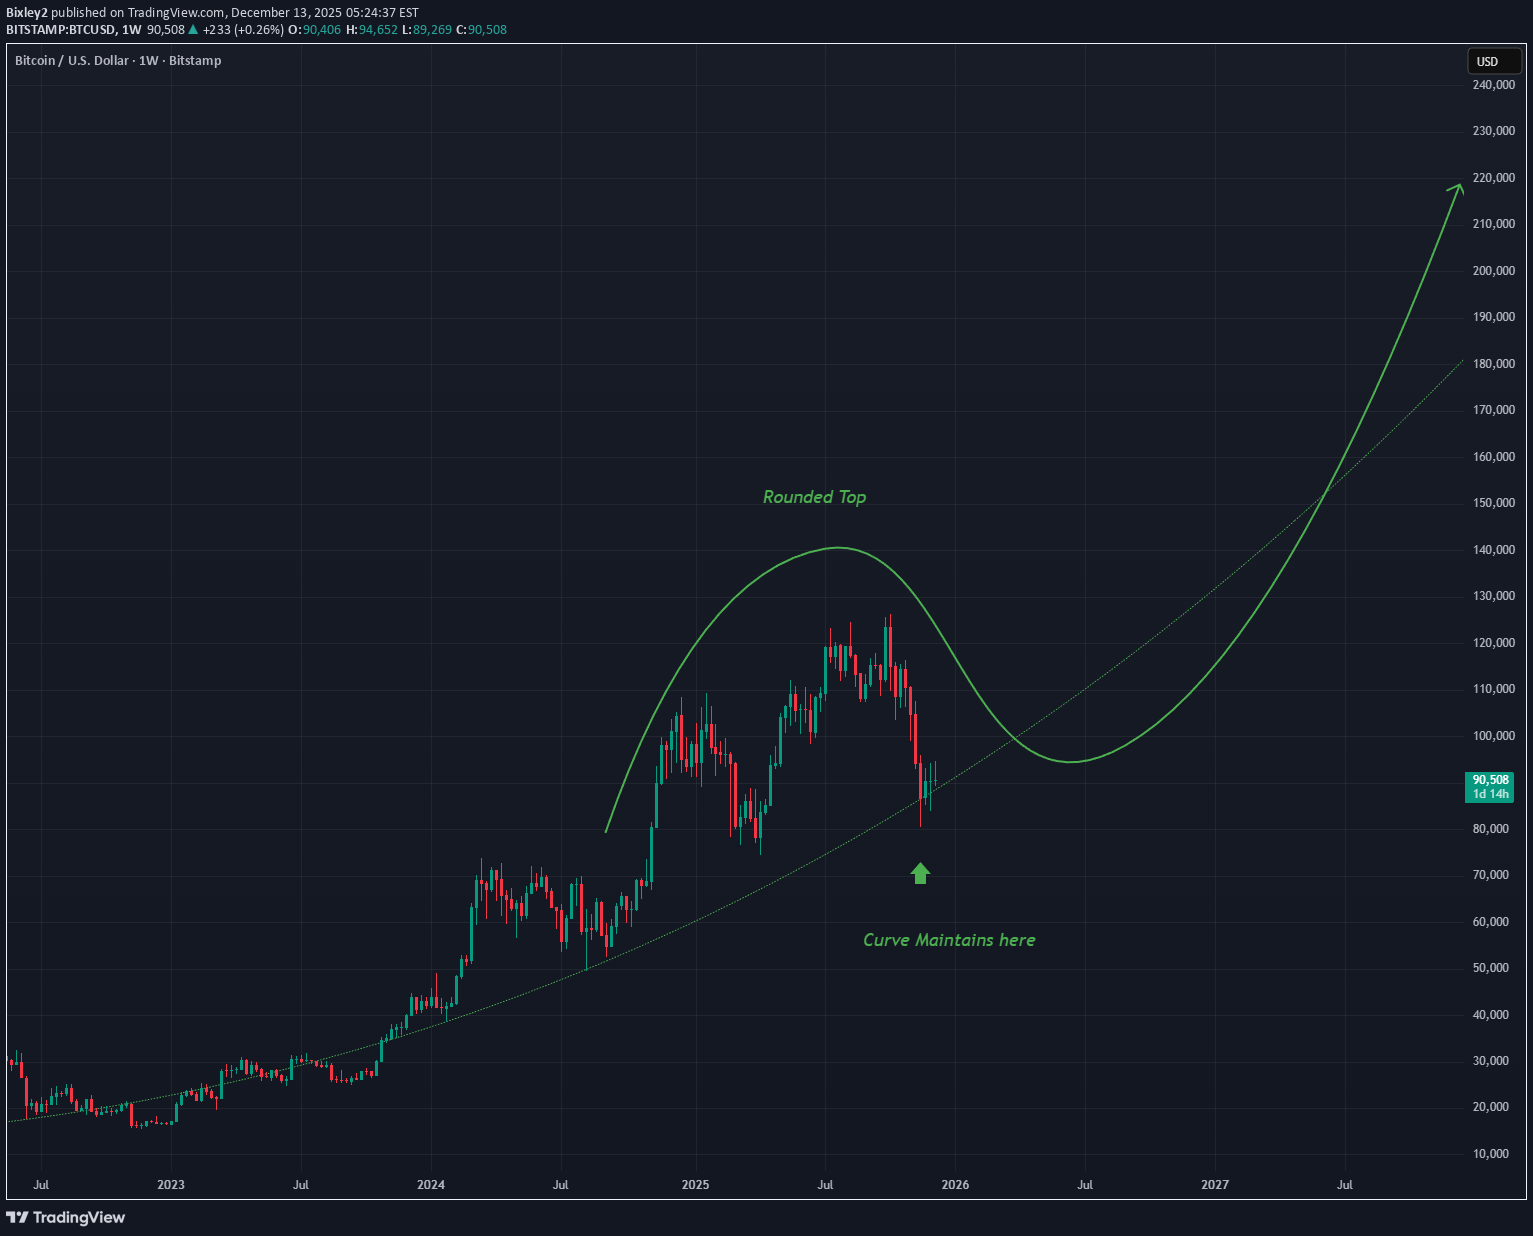
A scenario where a curved trend line is respected and new highs are established This curve often gets drawn lower and lower and its hard to know where the support actually resides (ive done my best) The rounded top is a bullish pattern that ive noticed recently on BTC non-log scale on this timeframe which is the Weekly.
Bixley2
GOLD and SILVER going through similar Breakouts
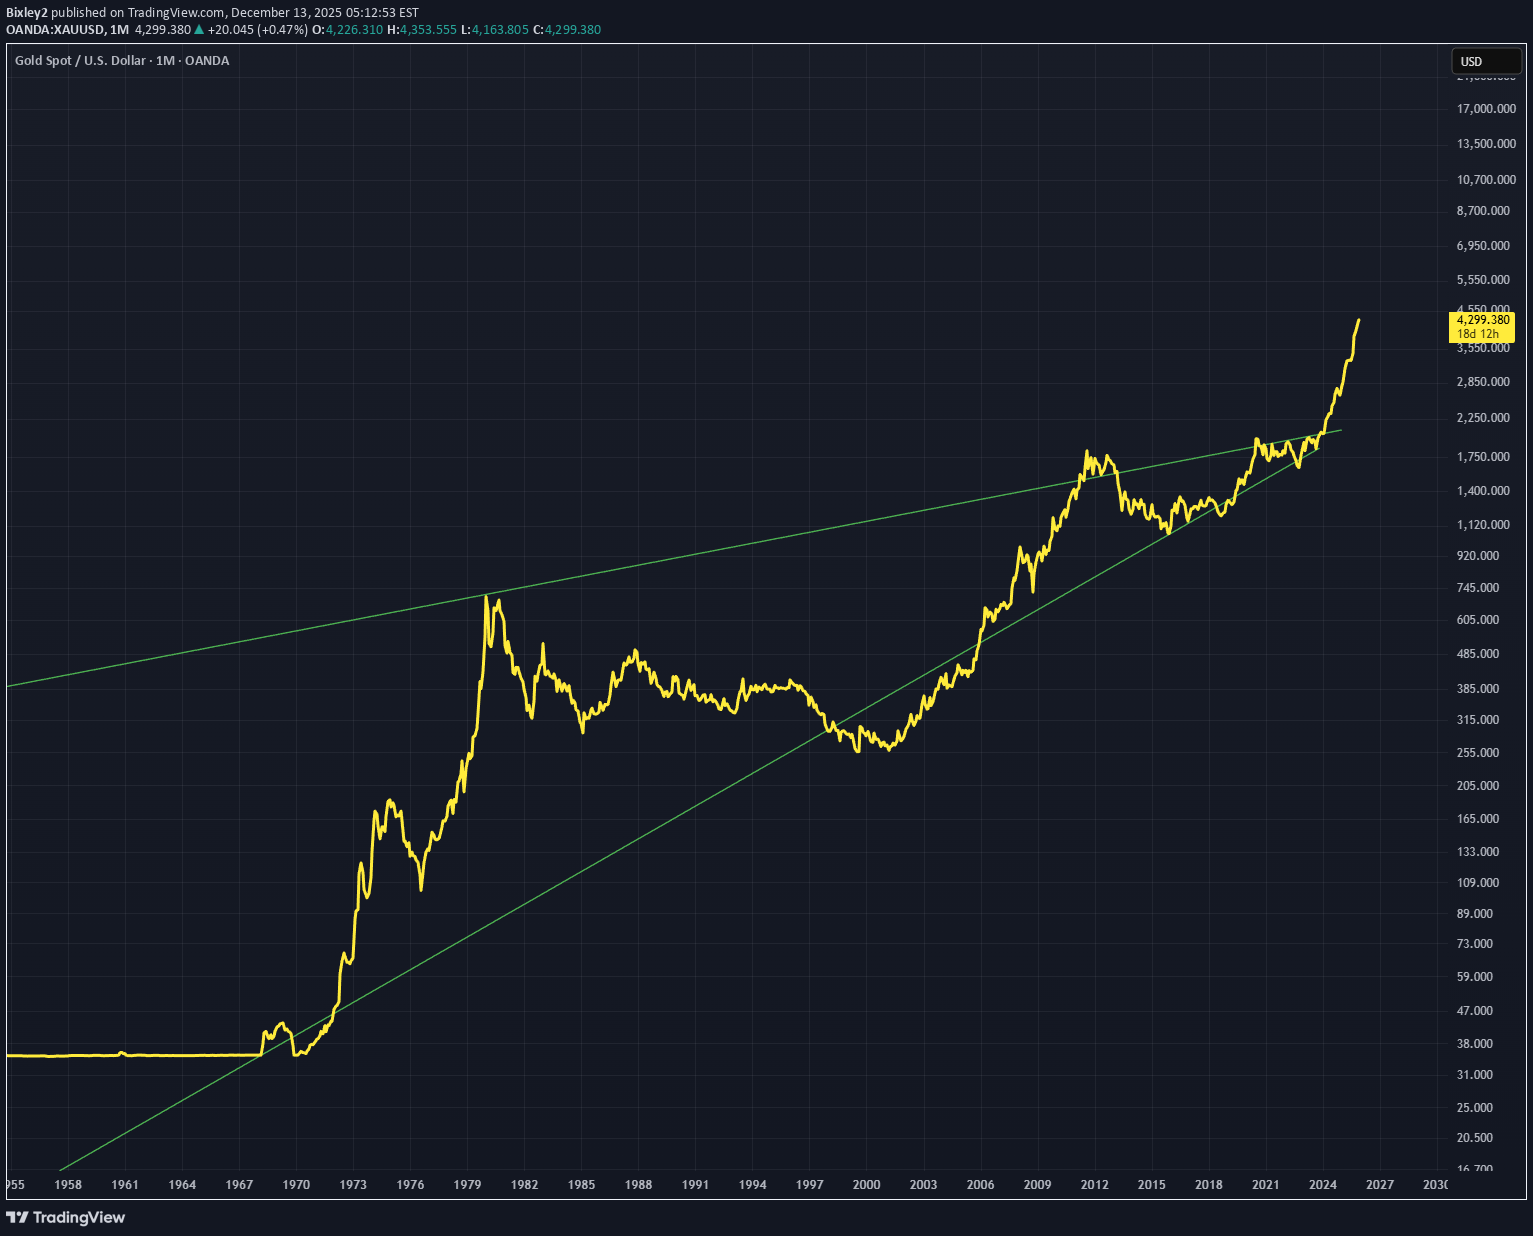
Large ascending triangle patterns are being broken out of on both GOLD and SILVER This is the pattern for gold and the next chart posted will be the similar one, being silver. Monthly timeframe breakout
Bixley2
مثلث صعودی سولانا (SOL/USD): آماده انفجار بزرگ در تایم فریم هفتگی!
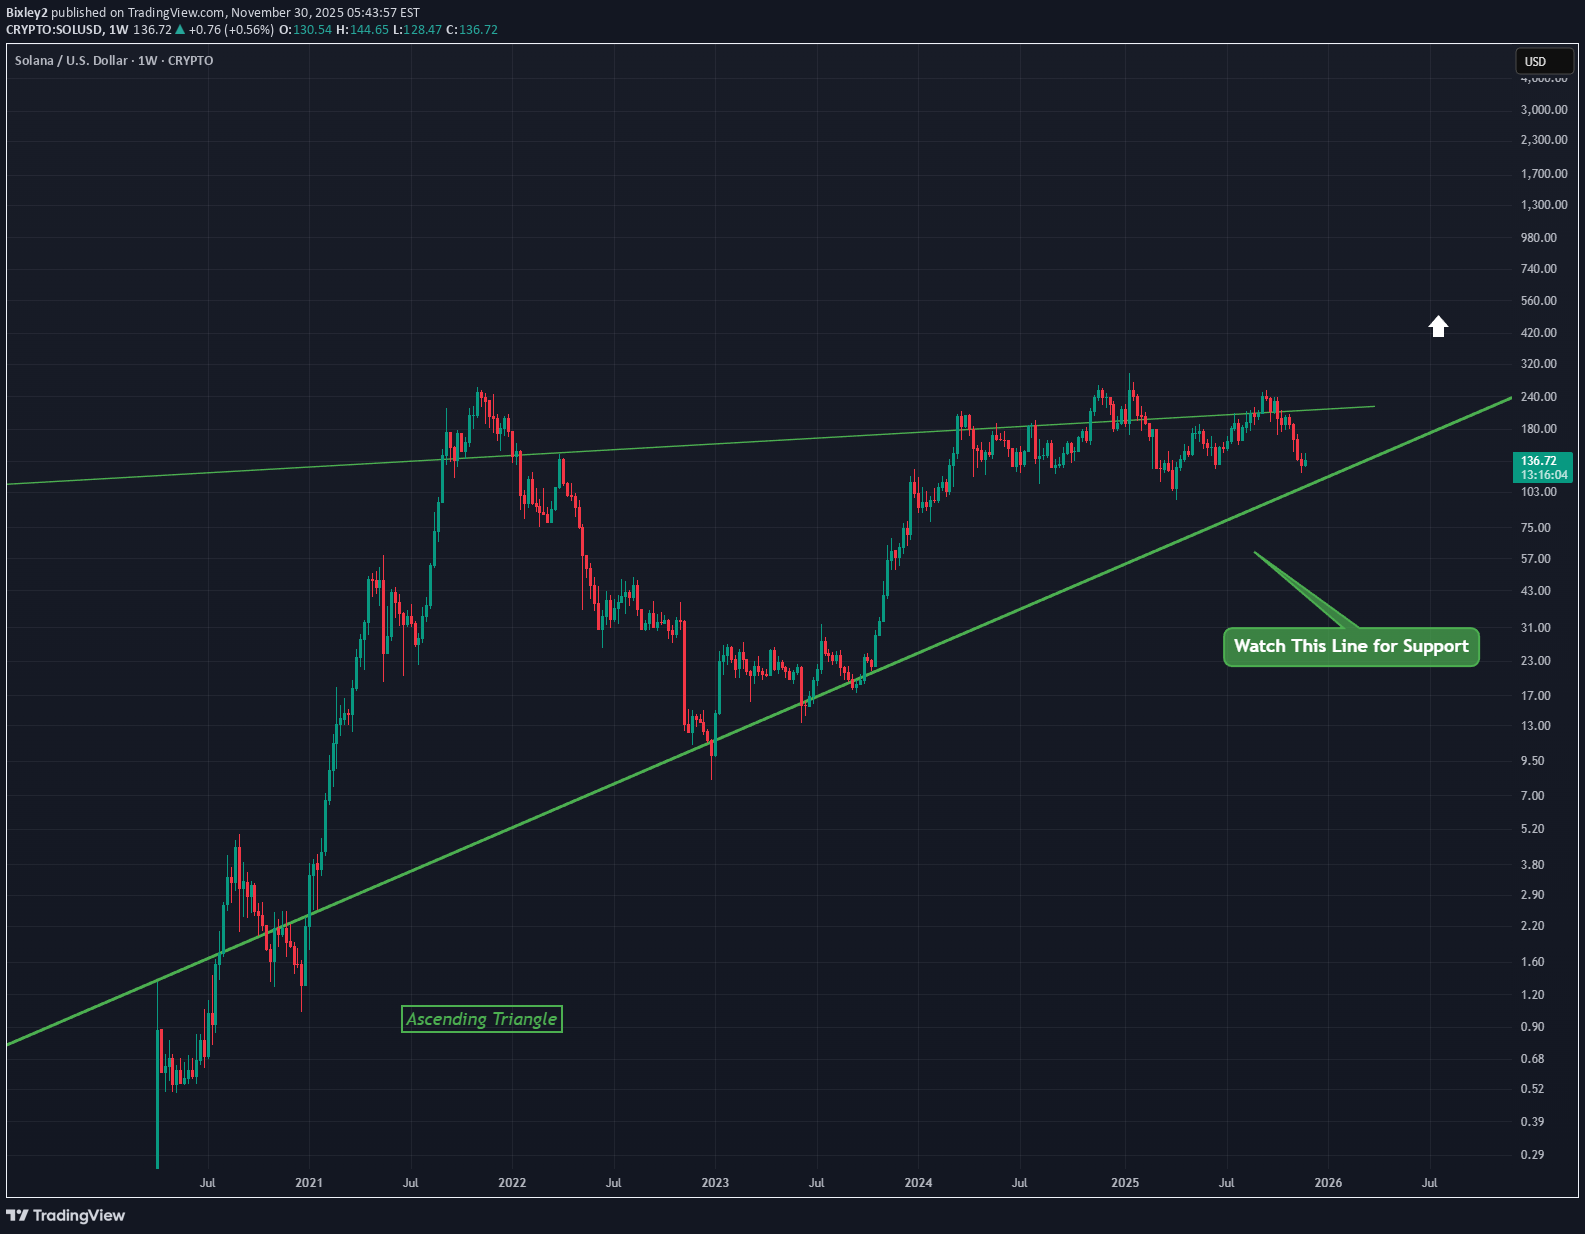
A bullish ascending triangle on SOLUSD Watch the lower line to confirm support and then break out potential This is the Weekly chart so long term good for Solana
Bixley2
زودتر از همه، پامپ بزرگ بعدی ریپل (XRP) را پیشبینی کنید!
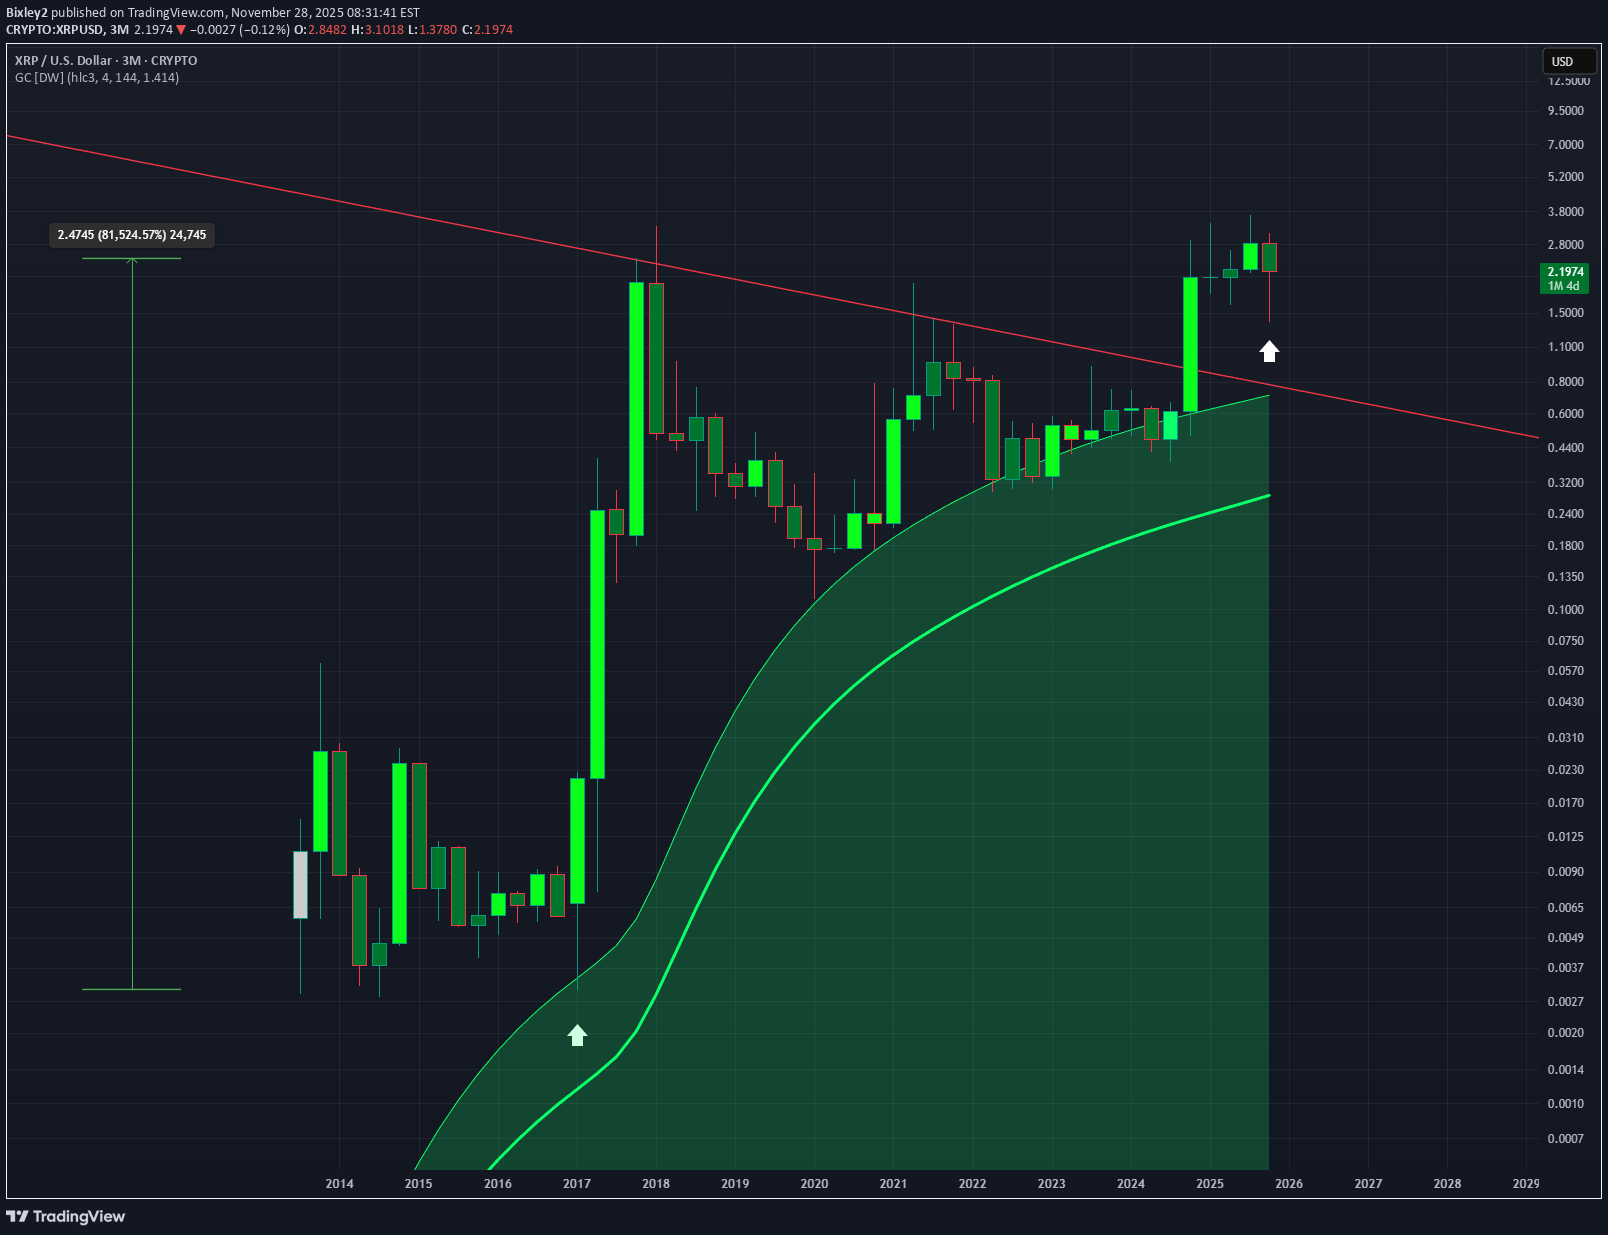
This is the 3 month timeframe for XRP but it shows a clear pattern of support along the upper line of the Gaussian Channel indicator A breakout has already begun but there is potentially more to this run if you compare it to the first bull run. Support will be found above the broken trend line in red
Bixley2
تحلیل تکنیکال اتریوم: آیا الگوی سر و شانه معکوس نویدبخش آغاز فصل آلتکوینهاست؟
Bixley2
مثلث متقارن لایت کوین: آماده انفجار قیمتی بزرگ بعدی؟
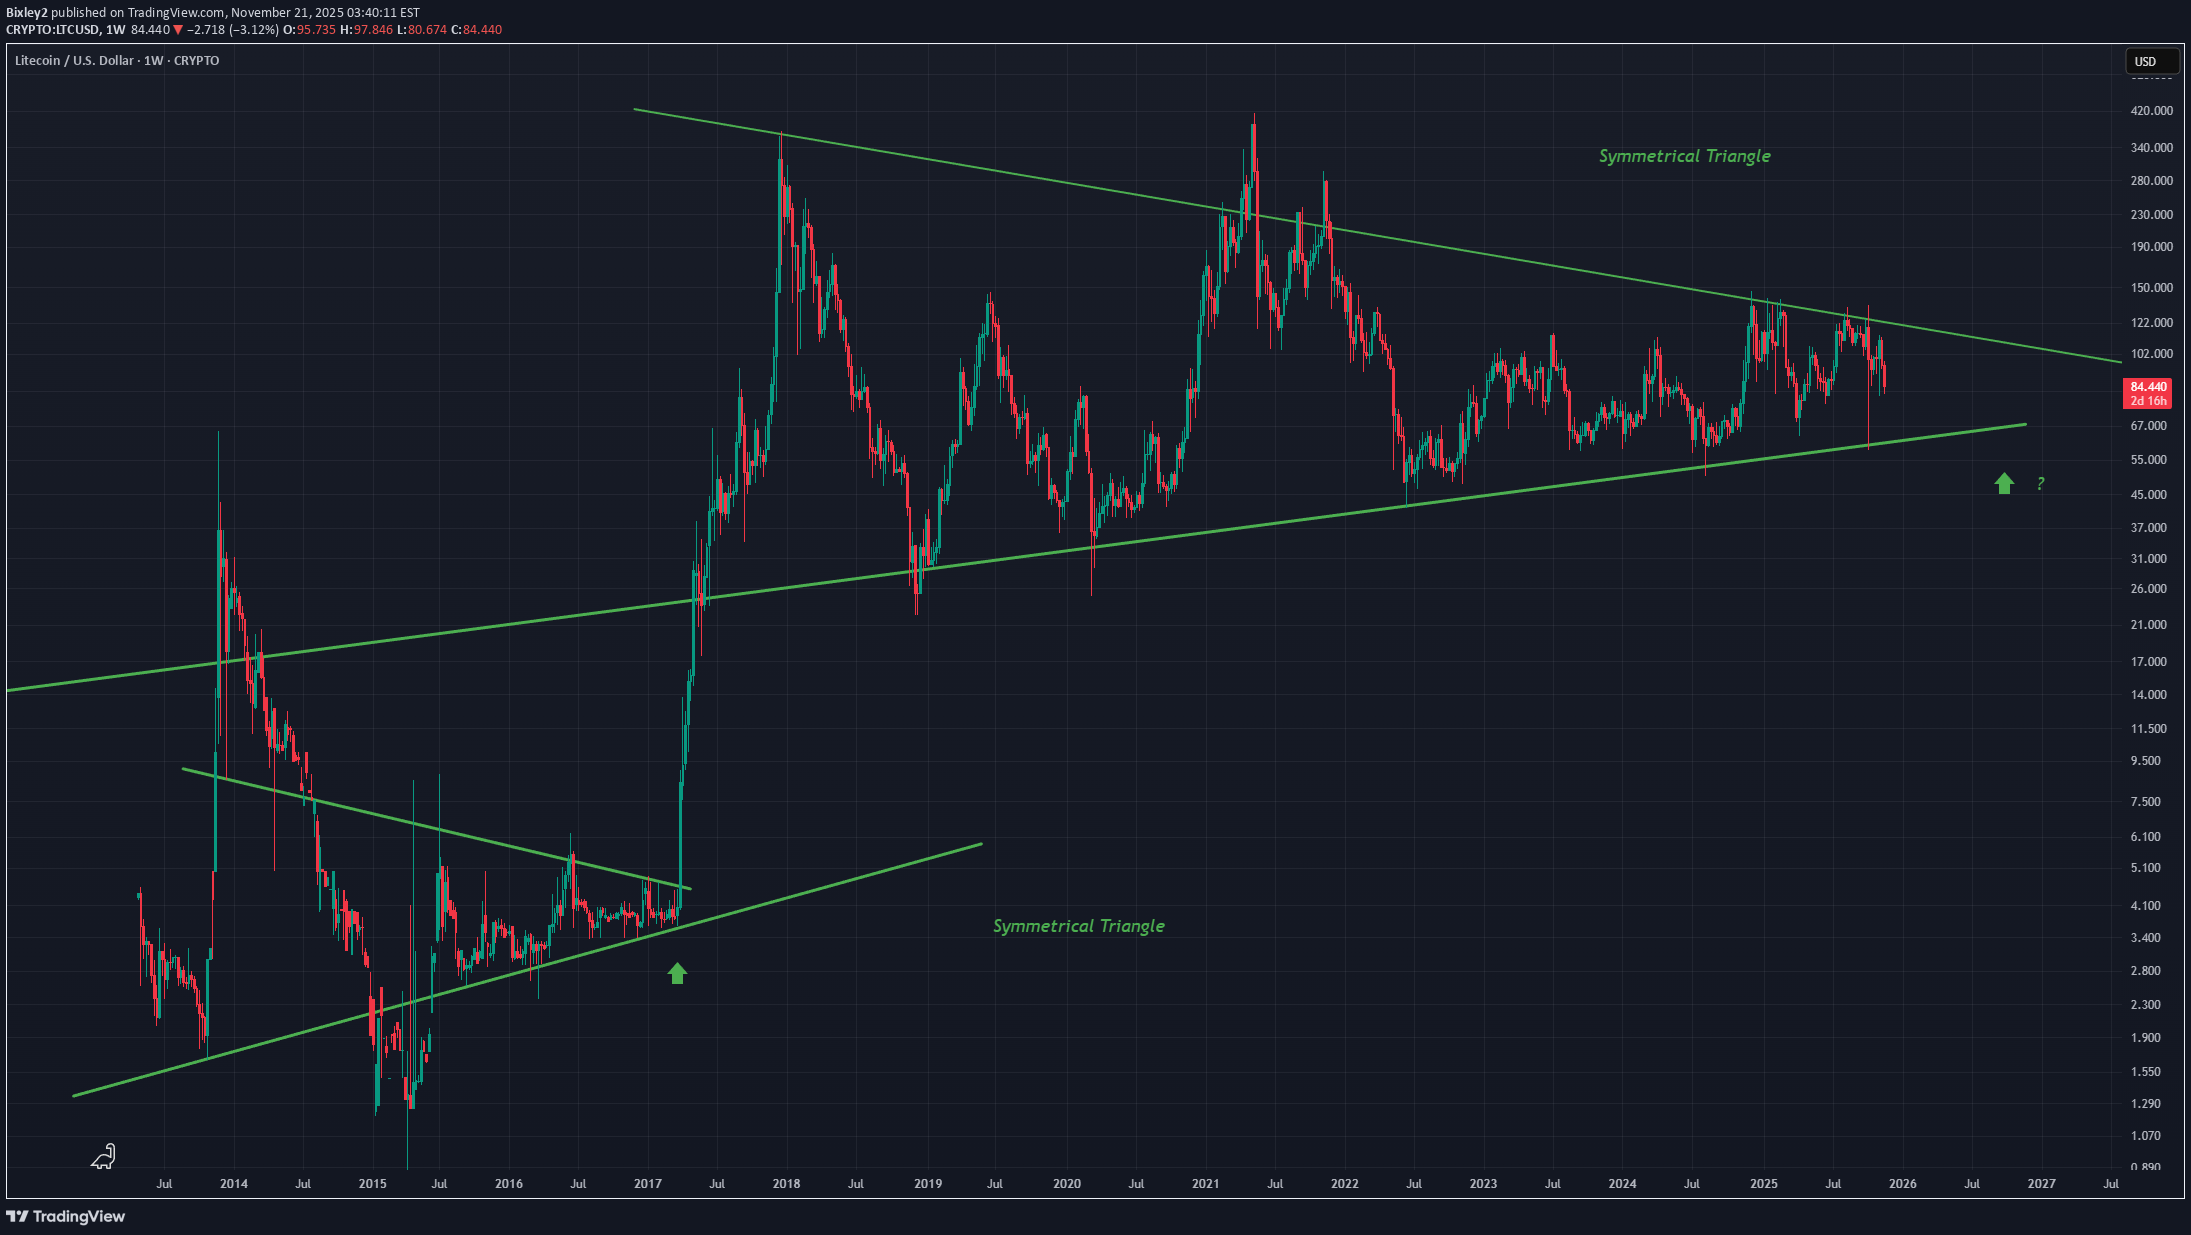
As seen in the first symmetrical triangle a massive break out followed If the second is anything like the first we can expect a breakout like that one I have posted this chart before but it really is a strong bull option for a long term altcoin. Weekly timeframe
Bixley2
سناریوی نزولی اتریوم (ETHUSD): آیا سقف دوتایی در راه است؟

A double top scenario between last bull runs peak and the current action seen is an idea that ive come across. Price may not go up at all and retest the dotted line in red in a bearish action I dont expect this as much as I expect the occurrence of a late altcoin bull run. Weekly chart
Disclaimer
Any content and materials included in Sahmeto's website and official communication channels are a compilation of personal opinions and analyses and are not binding. They do not constitute any recommendation for buying, selling, entering or exiting the stock market and cryptocurrency market. Also, all news and analyses included in the website and channels are merely republished information from official and unofficial domestic and foreign sources, and it is obvious that users of the said content are responsible for following up and ensuring the authenticity and accuracy of the materials. Therefore, while disclaiming responsibility, it is declared that the responsibility for any decision-making, action, and potential profit and loss in the capital market and cryptocurrency market lies with the trader.