
TWT
Trust Wallet Token
| تریدر | نوع سیگنال | حد سود/ضرر | زمان انتشار | مشاهده پیام |
|---|---|---|---|---|
 BandForBandsRank: 34884 | خرید | حد سود: تعیین نشده حد ضرر: تعیین نشده | 11/15/2025 |
Price Chart of Trust Wallet Token
سود 3 Months :
سیگنالهای Trust Wallet Token
Filter
Sort messages by
Trader Type
Time Frame
BandForBands
سقف کانال نزولی توییتر شکسته میشود؟ پیشبینی جهش 130 درصدی!
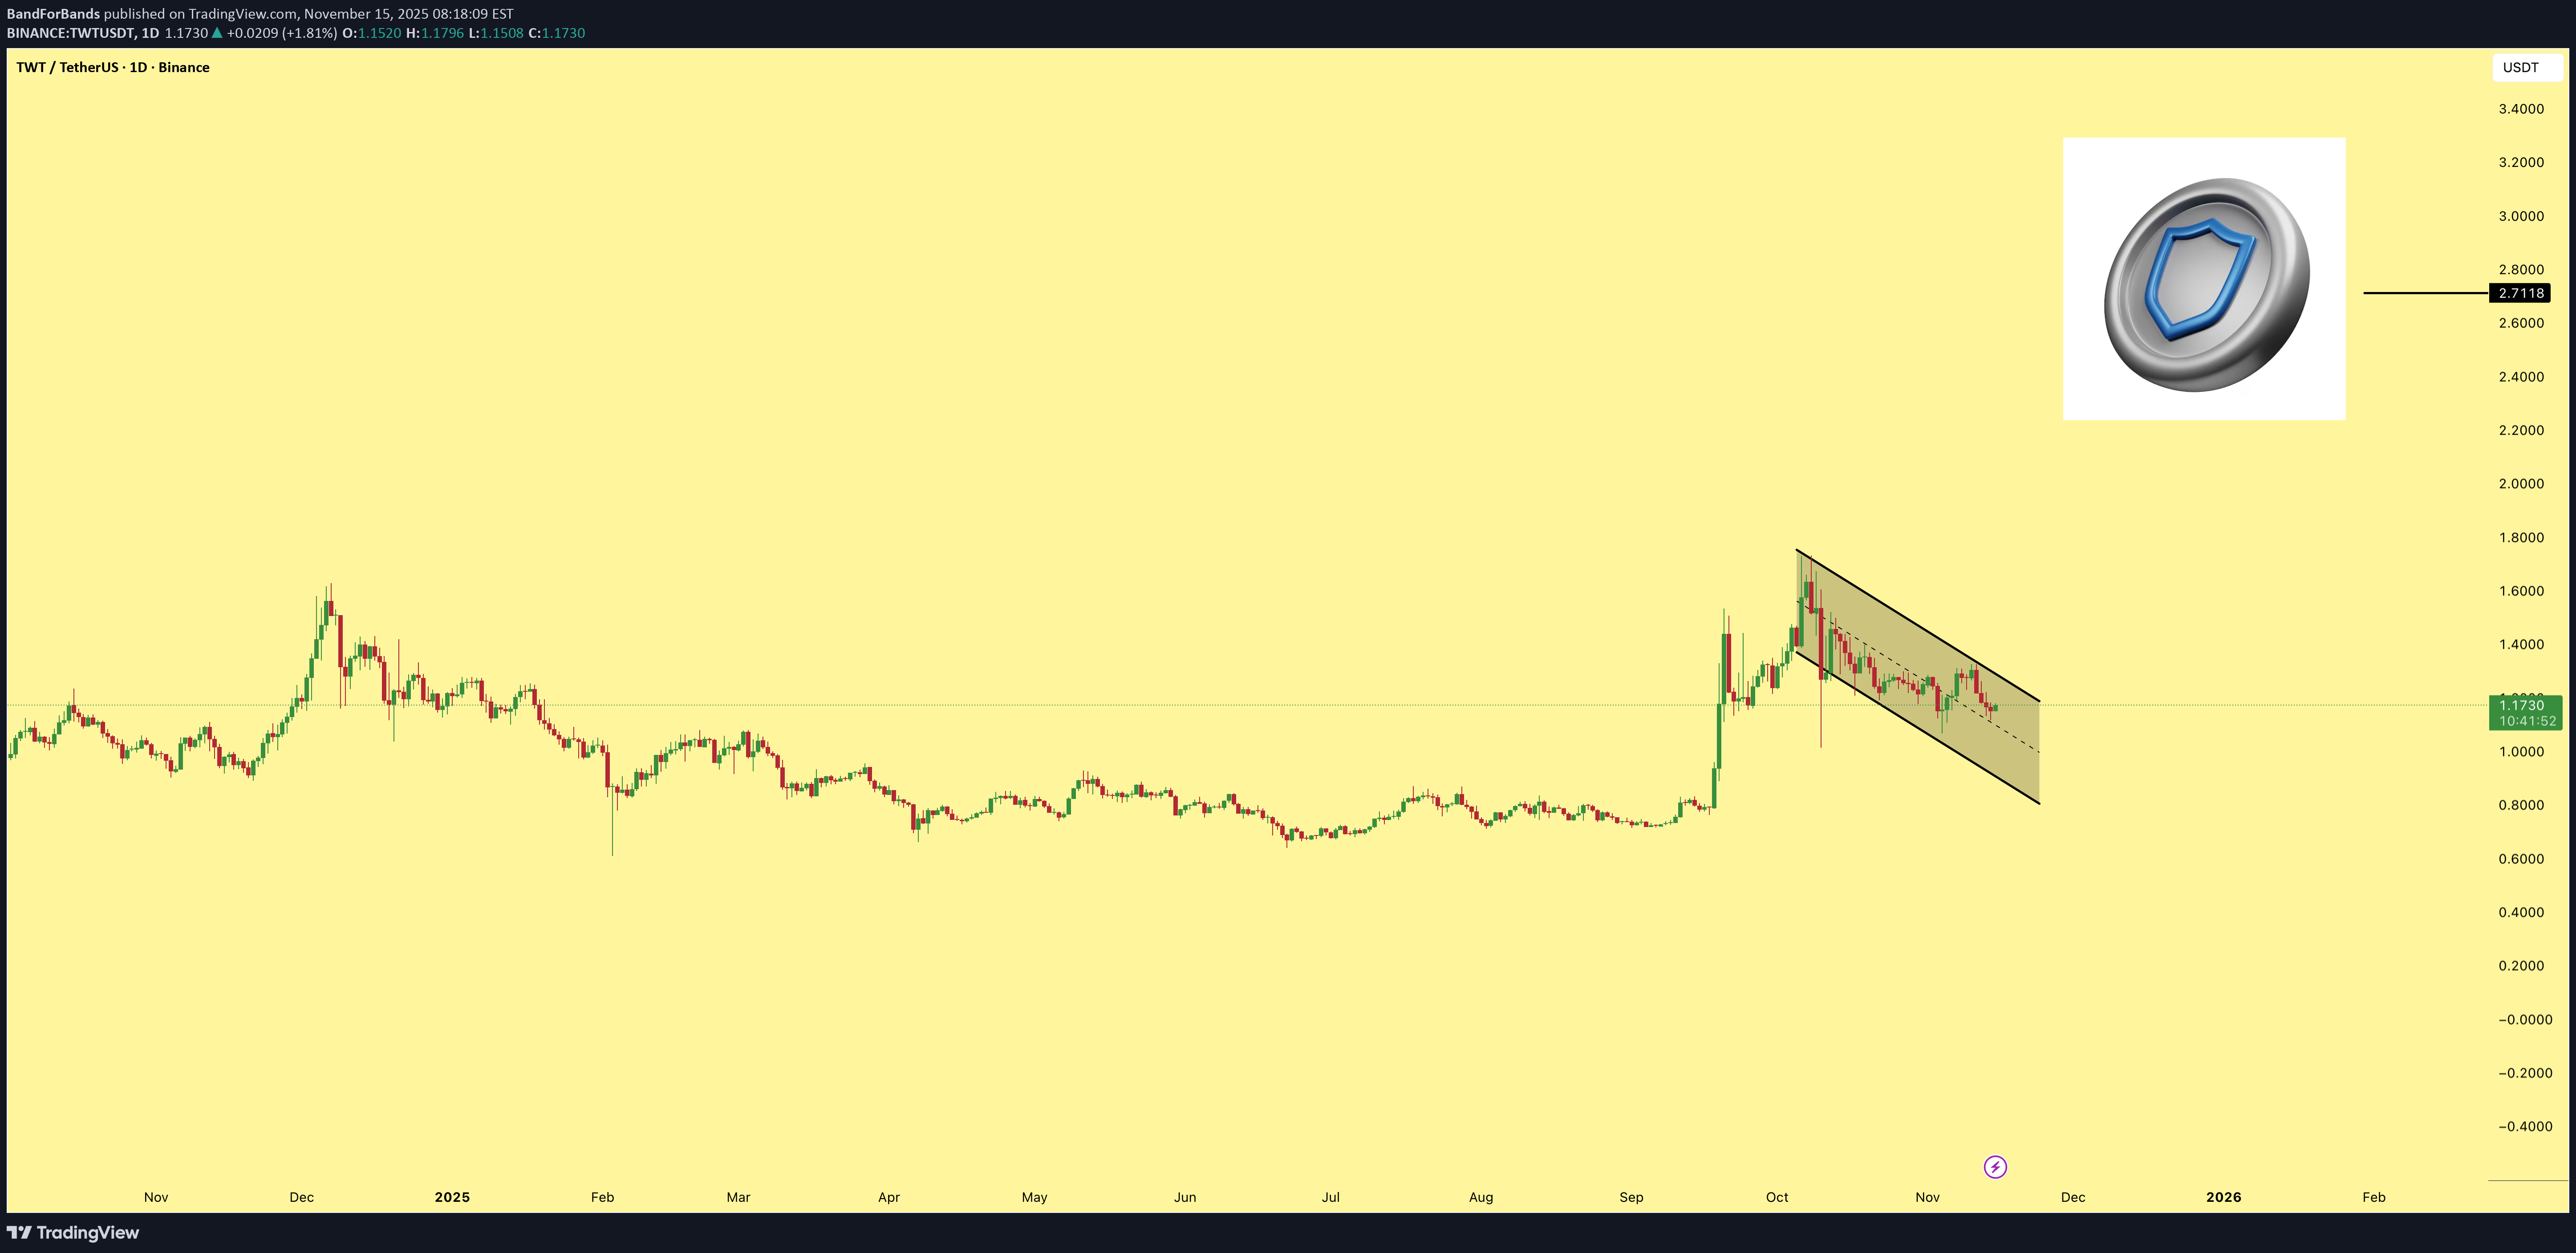
TWT is trading inside a descending channel pattern, showing steady compression. Once it breaks out, there is a potential 130 percent gain to be made from the current price. The setup looks clean and momentum is starting to build.

sladkamala123
تحلیل تکنیکال TWT: آیا قیمت پس از تثبیت طولانی آماده انفجار است؟
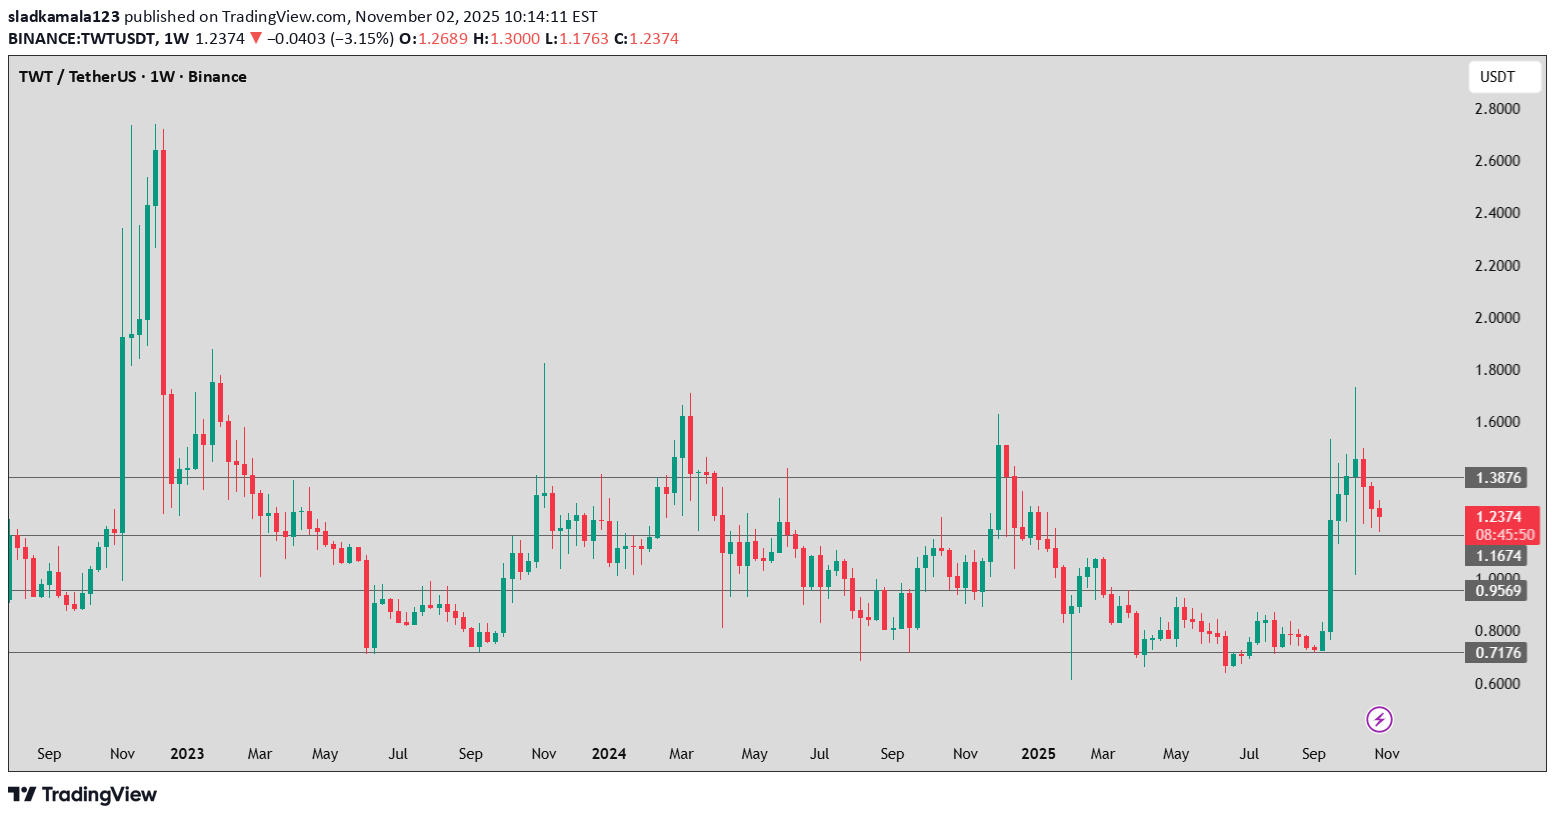
the chart shows that after a strong decline from previous highs, TWT entered a long consolidation phase. For several months, the price has been moving between appeoximately 0,7 and 1,5 USDT without a clear long time trend. Currently the price ius around 123USDT, slightly above the middle of the consolidation rang.

KoDPrey
آینده درخشان توکن TWT: آیا این همان فرصت طلایی مانند اوایل BNB و LINK است؟
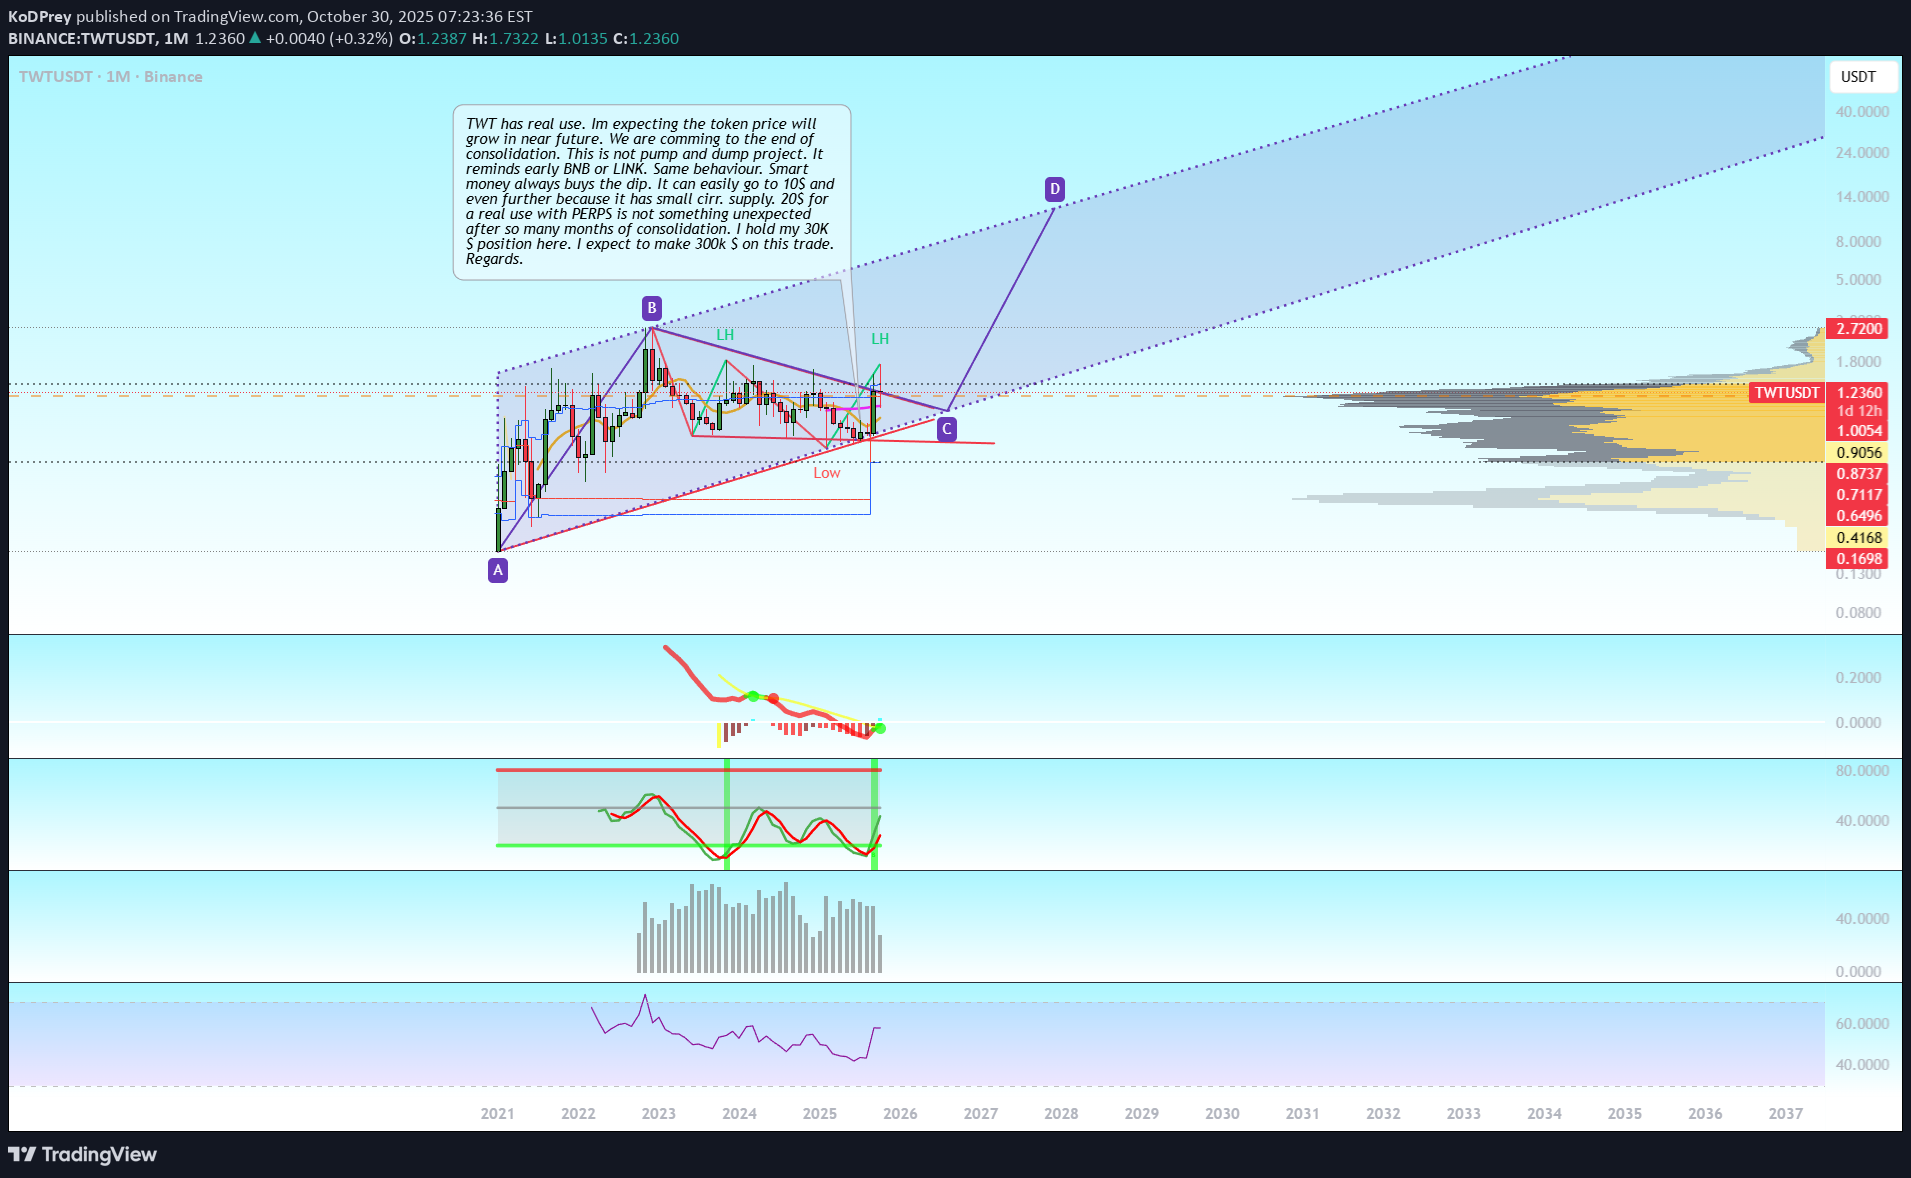
TWT has real use. Im expecting that the token price will grow in near future. We are comming to the end of consolidation. This is not pump and dump project. It reminds early BNB or LINK. Same behaviour. Smart money always buys the dip. It can easily go to 10$ and even further because it has small cirr. supply. 20$ for a real use with PERPS is not something unexpected after so many months of consolidation. I hold my 30K $ position here. I expect to make 300k $ on this trade. Regards.

UnculturedTrade007
آمادهاید؟ بهترین فرصت خرید بلندمدت TWT با نقطه ورود و خروج دقیق!

TWTUSDT TWT Long Set-up Entry Between 1.47 - 1.50 SL Below 1.42 Target above 1.6 Lev & margin as per your risk capacity

CryptoAnalystSignal
تحلیل TWT/USDT: مثلث نزولی در منطقه حمایتی؛ آیا وقت خرید است؟
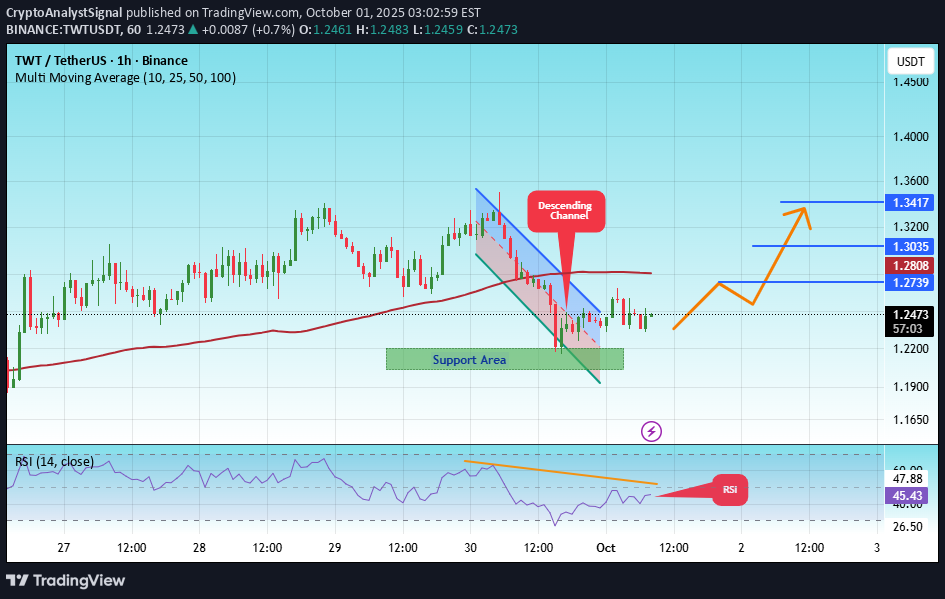
#TWT The price is moving within a descending channel on the 1-hour frame, adhering well to it, and is heading for a strong breakout and retest. We have a bearish trend on the RSI indicator that is about to be broken and retested, which supports the upward breakout. There is a major support area in green at 1.21, representing a strong support point. We are heading for consolidation above the 100 moving average. Entry price: 1.25. First target: 1.27. Second target: 1.30. Third target: 1.34. Don't forget a simple matter: capital management. When you reach the first target, save some money and then change your stop-loss order to an entry order. For inquiries, please leave a comment. Thank you.#TWT First target: 1.27 Reached Second target: 1.30 Reached Third target: 1.34 Reached

minno91
TWT – Trending with a Strong Break of Structure (BOS) on 4H

TWT has recently made a decisive Break of Structure (BOS) on the 4-hour timeframe, signaling a potential bullish continuation from a 50% Fibonacci retracement zone. This retracement confirms a solid area of demand and a great entry point. The market cap has just crossed above 500M, qualifying it as a large-cap coin, which typically attracts significant attention from bigger players and institutional investors. This fundamental shift adds weight to the technical setup. Key targets to watch: TP1: 1.272 Fibonacci extension, the first likely resistance level TP2: 1.618 extension, a strong follow-up target if momentum sustains Important note: If price creates a new high before reaching 50% retracement, the current setup will be invalidated, so strict risk management is crucial. Risk: Just 0.5% per trade, balancing opportunity and safety. Trade smart, and good luck! 🚀

ColdBloodedCharter
$TWT - correction after a HIGH-VOLUME breakout last week
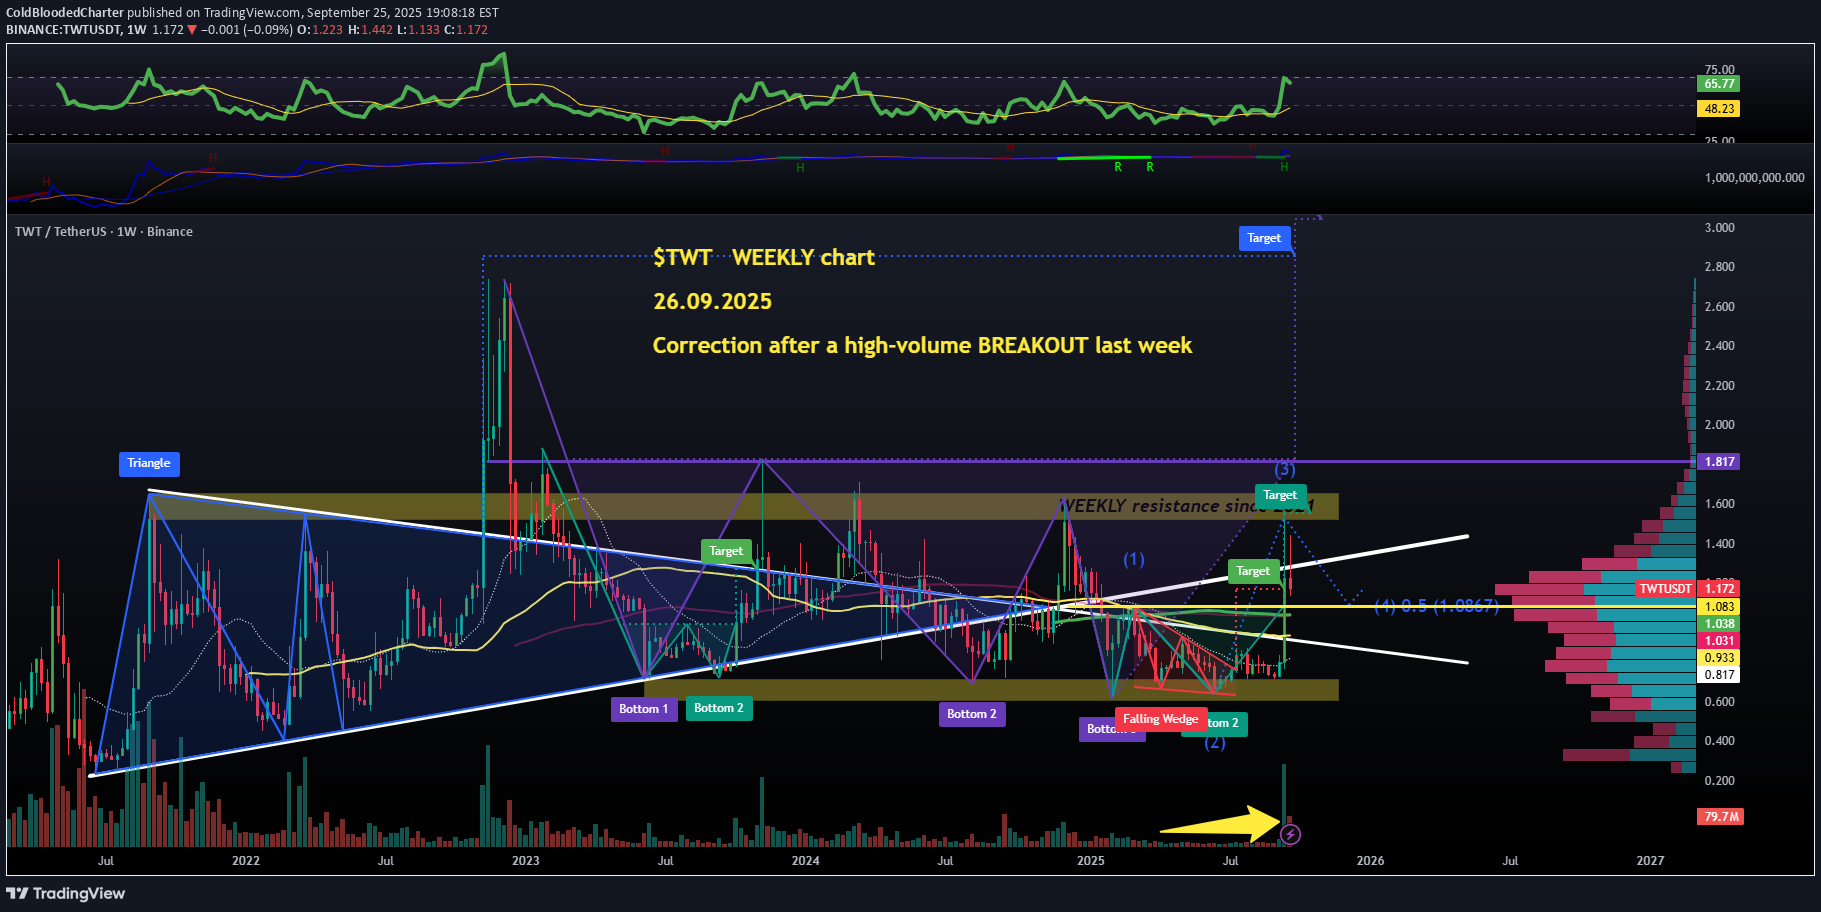
T TWT (Trust Wallet Token) nearly doubled in price after CZ spoke about it positivey last week. Let's have a top-down look into the situation, starting from the WEEKLY chart to get a solid idea where we are. First of all, what an odd chart. It looks like a gigantic range from 70 cents to $1.7 roughly, and last week we saw a rejection at $1.55 and quite a decline in price, that was likely WAVE 3 (these waves are called money waves for a reason, usually most explosive). Now WAVE 4 usually corrects down to 0.5 of the size of WAVE 3, so i put this $1.08 level on the chart to see what it means on shorter timeframes (next posts). RSI is 65: bullish and with plenty of room to push upwards. Bullish market structure obviously, lots of volume last week after #CZ spoke, but also a few red flags on the TOKEN DISTRIBUTION front.

Ren_MomentumTrader
TWT/USDT
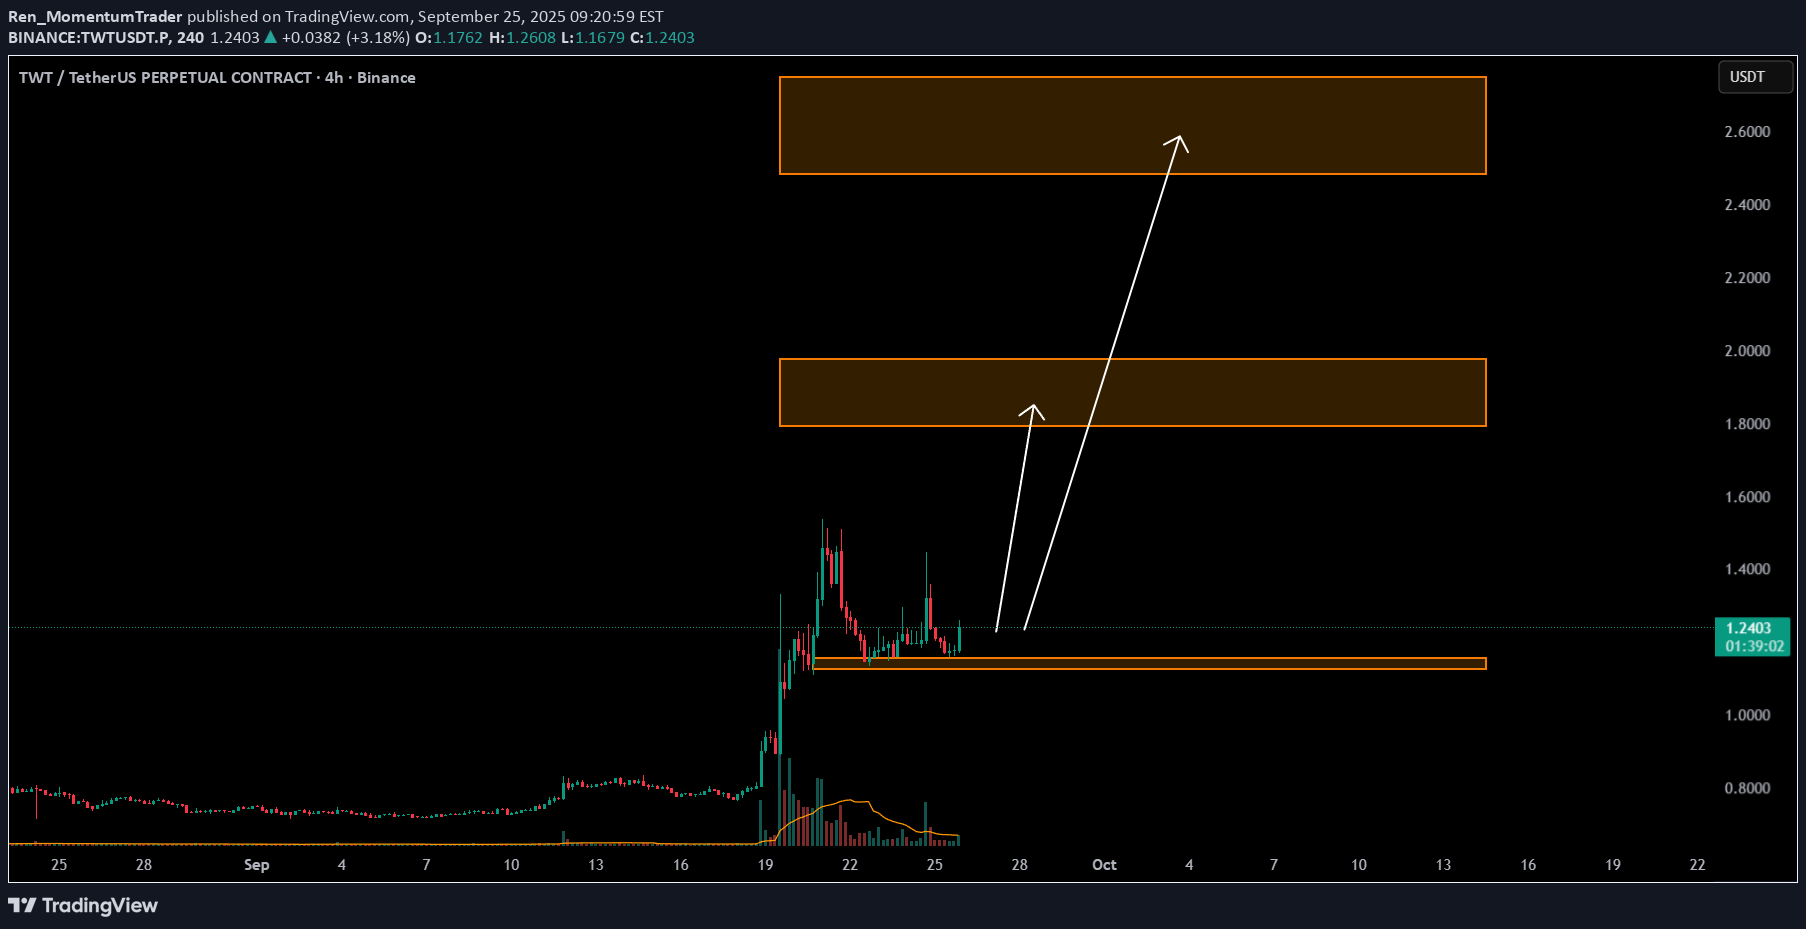
Key Level Zone: 1.1250 - 1.1550 LMT v2.0 detected. The setup looks promising—price previously trended upward with rising volume and momentum, then retested this zone cleanly. This presents an excellent reward-to-risk opportunity if momentum continues to align. Introducing LMT (Levels & Momentum Trading) - Over the past 3 years, I’ve refined my approach to focus more sharply on the single most important element in any trade: the KEY LEVEL. - While HMT (High Momentum Trading) served me well—combining trend, momentum, volume, and structure across multiple timeframes—I realized that consistently identifying and respecting these critical price zones is what truly separates good trades from great ones. - That insight led to the evolution of HMT into LMT – Levels & Momentum Trading. Why the Change? (From HMT to LMT) Switching from High Momentum Trading (HMT) to Levels & Momentum Trading (LMT) improves precision, risk control, and confidence by: - Clearer Entries & Stops: Defined key levels make it easier to plan entries, stop-losses, and position sizing—no more guesswork. - Better Signal Quality: Momentum is now always checked against a support or resistance zone—if it aligns, it's a stronger setup. - Improved Reward-to-Risk: All trades are anchored to key levels, making it easier to calculate and manage risk effectively. - Stronger Confidence: With clear invalidation points beyond key levels, it's easier to trust the plan and stay disciplined—even in tough markets. Whenever I share a signal, it’s because: - A high‐probability key level has been identified on a higher timeframe. - Lower‐timeframe momentum, market structure and volume suggest continuation or reversal is imminent. - The reward‐to‐risk (based on that key level) meets my criteria for a disciplined entry. ***Please note that conducting a comprehensive analysis on a single timeframe chart can be quite challenging and sometimes confusing. I appreciate your understanding of the effort involved. Important Note: The Role of Key Levels - Holding a key level zone: If price respects the key level zone, momentum often carries the trend in the expected direction. That’s when we look to enter, with stop-loss placed just beyond the zone with some buffer. - Breaking a key level zone: A definitive break signals a potential stop‐out for trend traders. For reversal traders, it’s a cue to consider switching direction—price often retests broken zones as new support or resistance. My Trading Rules (Unchanged) Risk Management - Maximum risk per trade: 2.5% - Leverage: 5x Exit Strategy / Profit Taking - Sell at least 70% on the 3rd wave up (LTF Wave 5). - Typically sell 50% during a high‐volume spike. - Move stop‐loss to breakeven once the trade achieves a 1.5:1 R:R. - Exit at breakeven if momentum fades or divergence appears. The market is highly dynamic and constantly changing. LMT signals and target profit (TP) levels are based on the current price and movement, but market conditions can shift instantly, so it is crucial to remain adaptable and follow the market's movement. If you find this signal/analysis meaningful, kindly like and share it. Thank you for your support~ Sharing this with love! From HMT to LMT: A Brief Version History HM Signal : Date: 17/08/2023 - Early concept identifying high momentum pullbacks within strong uptrends - Triggered after a prior wave up with rising volume and momentum - Focused on healthy retracements into support for optimal reward-to-risk setups HMT v1.0: Date: 18/10/2024 - Initial release of the High Momentum Trading framework - Combined multi-timeframe trend, volume, and momentum analysis. - Focused on identifying strong trending moves high momentum HMT v2.0: Date: 17/12/2024 - Major update to the Momentum indicator - Reduced false signals from inaccurate momentum detection - New screener with improved accuracy and fewer signals HMT v3.0: Date: 23/12/2024 - Added liquidity factor to enhance trend continuation - Improved potential for momentum-based plays - Increased winning probability by reducing entries during peaks HMT v3.1: Date: 31/12/2024 - Enhanced entry confirmation for improved reward-to-risk ratios HMT v4.0: Date: 05/01/2025 - Incorporated buying and selling pressure in lower timeframes to enhance the probability of trending moves while optimizing entry timing and scaling HMT v4.1: Date: 06/01/2025 - Enhanced take-profit (TP) target by incorporating market structure analysis HMT v5 : Date: 23/01/2025 - Refined wave analysis for trending conditions - Incorporated lower timeframe (LTF) momentum to strengthen trend reliability - Re-aligned and re-balanced entry conditions for improved accuracy HMT v6 : Date : 15/02/2025 - Integrated strong accumulation activity into in-depth wave analysis HMT v7 : Date : 20/03/2025 - Refined wave analysis along with accumulation and market sentiment HMT v8 : Date : 16/04/2025 - Fully restructured strategy logic HMT v8.1 : Date : 18/04/2025 - Refined Take Profit (TP) logic to be more conservative for improved win consistency LMT v1.0 : Date : 06/06/2025 - Rebranded to emphasize key levels + momentum as the core framework LMT v2.0 Date: 11/06/2025 - Fully restructured lower timeframe (LTF) momentum logic

readCrypto
Support and Resistance Area: 0.9563-1.0036

Hello, traders! Follow us to get the latest information quickly. Have a great day! ------------------------------------- (TWTUSDT 1W Chart) The key support and resistance area is 1.65-1.8839. To break above this important support and resistance zone, we need to see if the price can maintain support near 1.0036 and rise above 1.4026. - (1D chart) Since the HA-High indicator on the 1D chart was generated at 0.9563, it's crucial to see if the price can maintain above 0.9563-1.0036. To achieve this, the key is whether the price can rise after finding support near 1.2224. Therefore, if the price falls below 1.2224, support around 0.9563-1.0036 will be crucial. ------------------------------------ The basic trading strategy is to buy in the DOM(-60) ~ HA-Low range and sell in the HA-High ~ DOM(60) range. However, if the price rises from the HA-High to DOM(60) range, it is likely to exhibit a step-like upward trend, while if it falls from the DOM(-60) to HA-Low range, it is likely to exhibit a step-like downward trend. Therefore, the basic trading strategy should be a segmented trading strategy. Buying when the HA-High to DOM(60) range shows support requires a short and quick response. As mentioned earlier, the HA-High to DOM(60) range is considered a sell zone, or resistance zone. Therefore, if possible, it's best to find a buying opportunity when the price declines and then rises. 1. The K indicator of the StochRSI indicator should be rising. If possible, it should not enter the overbought zone. 2. The On-By-Sign-Operative (OBV) indicator should be rising. If possible, it should remain above the High Line. 3. The TC (Trend Check) indicator should be rising. If possible, it should be above the 0 point. When the three indicators listed above are met, the price is likely to continue its upward trend. - Thank you for reading to the end. We wish you successful trading. --------------------------------------------------
minno91
TWTUSDT – Buy the Dip

TWTUSDT looks like it’s offering a solid dip-buying opportunity. Pullback seems healthy, and if support holds, we could see a strong recovery move. EASY – Quick Flush, Quick Bounce? ⚡️ EASY had a little flush this morning, but that might just open the door for a fast rebound. Classic dip-buy setup — watching for momentum to kick back in. 👀🚀
Disclaimer
Any content and materials included in Sahmeto's website and official communication channels are a compilation of personal opinions and analyses and are not binding. They do not constitute any recommendation for buying, selling, entering or exiting the stock market and cryptocurrency market. Also, all news and analyses included in the website and channels are merely republished information from official and unofficial domestic and foreign sources, and it is obvious that users of the said content are responsible for following up and ensuring the authenticity and accuracy of the materials. Therefore, while disclaiming responsibility, it is declared that the responsibility for any decision-making, action, and potential profit and loss in the capital market and cryptocurrency market lies with the trader.