
UnculturedTrade007
@t_UnculturedTrade007

What symbols does the trader recommend buying?
Purchase History
پیام های تریدر
Filter
UnculturedTrade007
تحلیل بیت کوین: آیا ریزش بیشتر در راه است؟ سطوح حمایتی کلیدی و زمان خرید مناسب
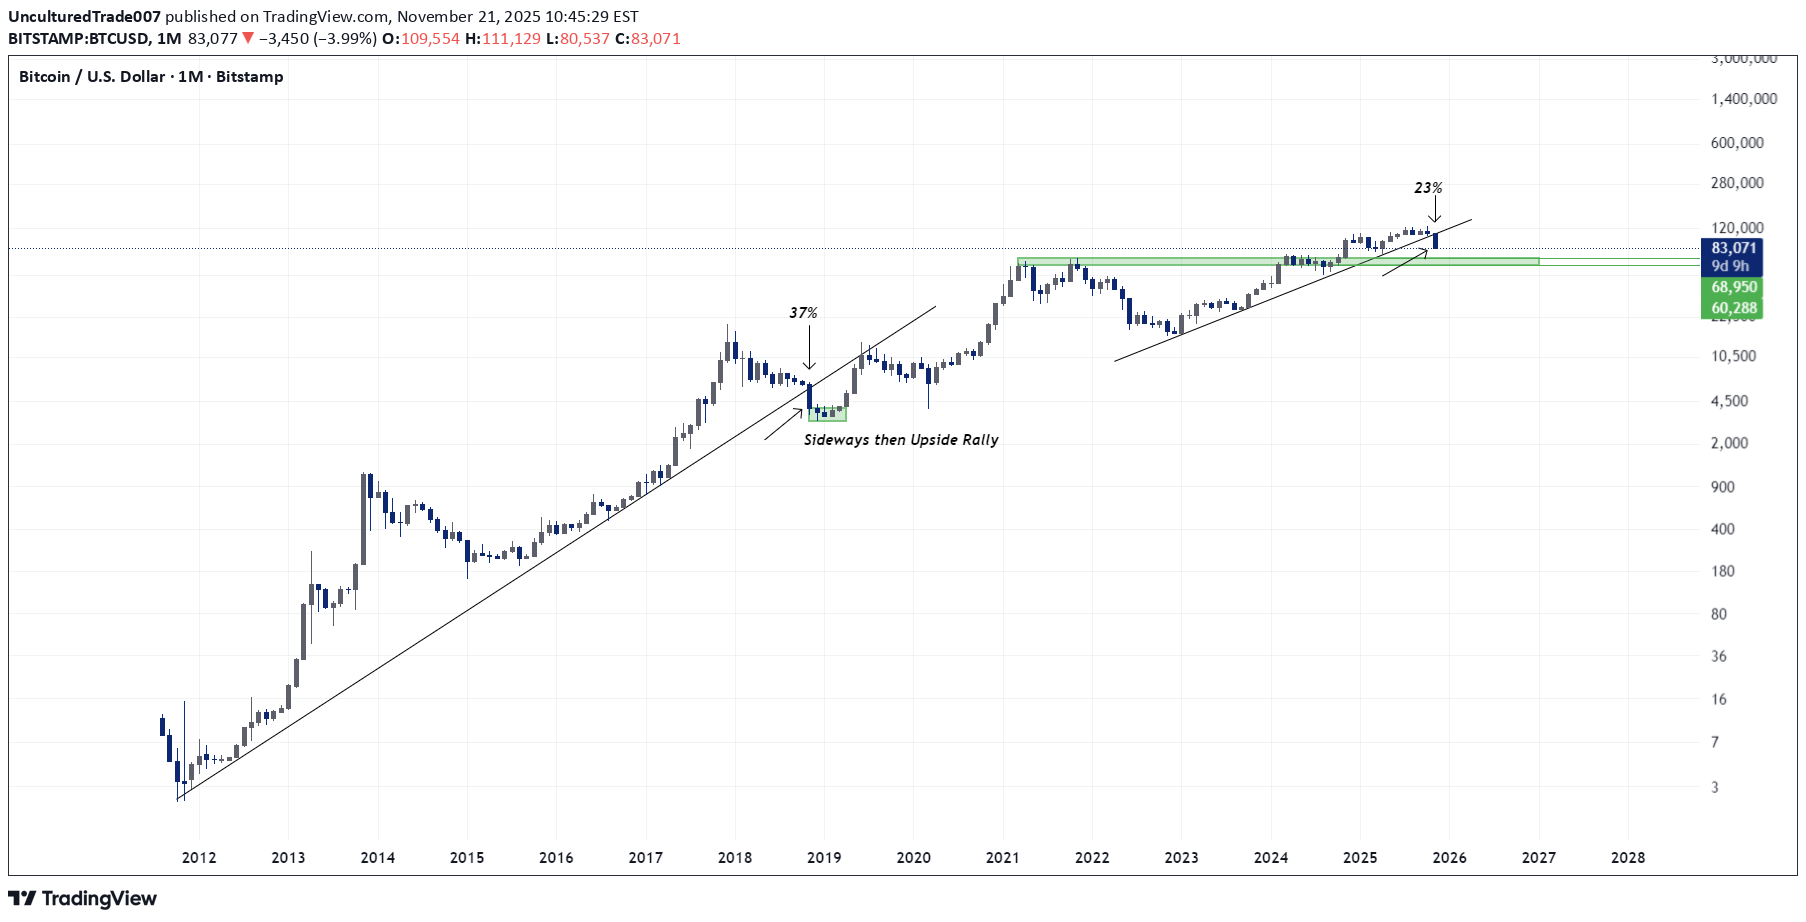
BTCUSDT Last time when the trendline broke on BTC, there were large volumes and a big red candle....After that, the next month saw some more selling, and then a fast recovery came...which is also possible in the current scenario Right now, BTC can still see more selling...The $60,300–$68,950 zone is strong support...If this gets tested, good buying can come in, and BTC can easily go to $85–90k ETH, SOL, and some other coins are sustaining quite strongly for now but they can also face selling if BTC drops below $80k At the moment, you can add some positions in spot for coins where you expect strong volume...But if someone is buying heavily thinking about altseason and expecting BTC to go to $150–200k , then they might have to wait 3–4 years If anyone wants to make new buys right now, they should do it in parts and avoid heavy buying
UnculturedTrade007
خیز بلند پندل (PENDLE): فرصت خرید با اهداف قیمتی جذاب!
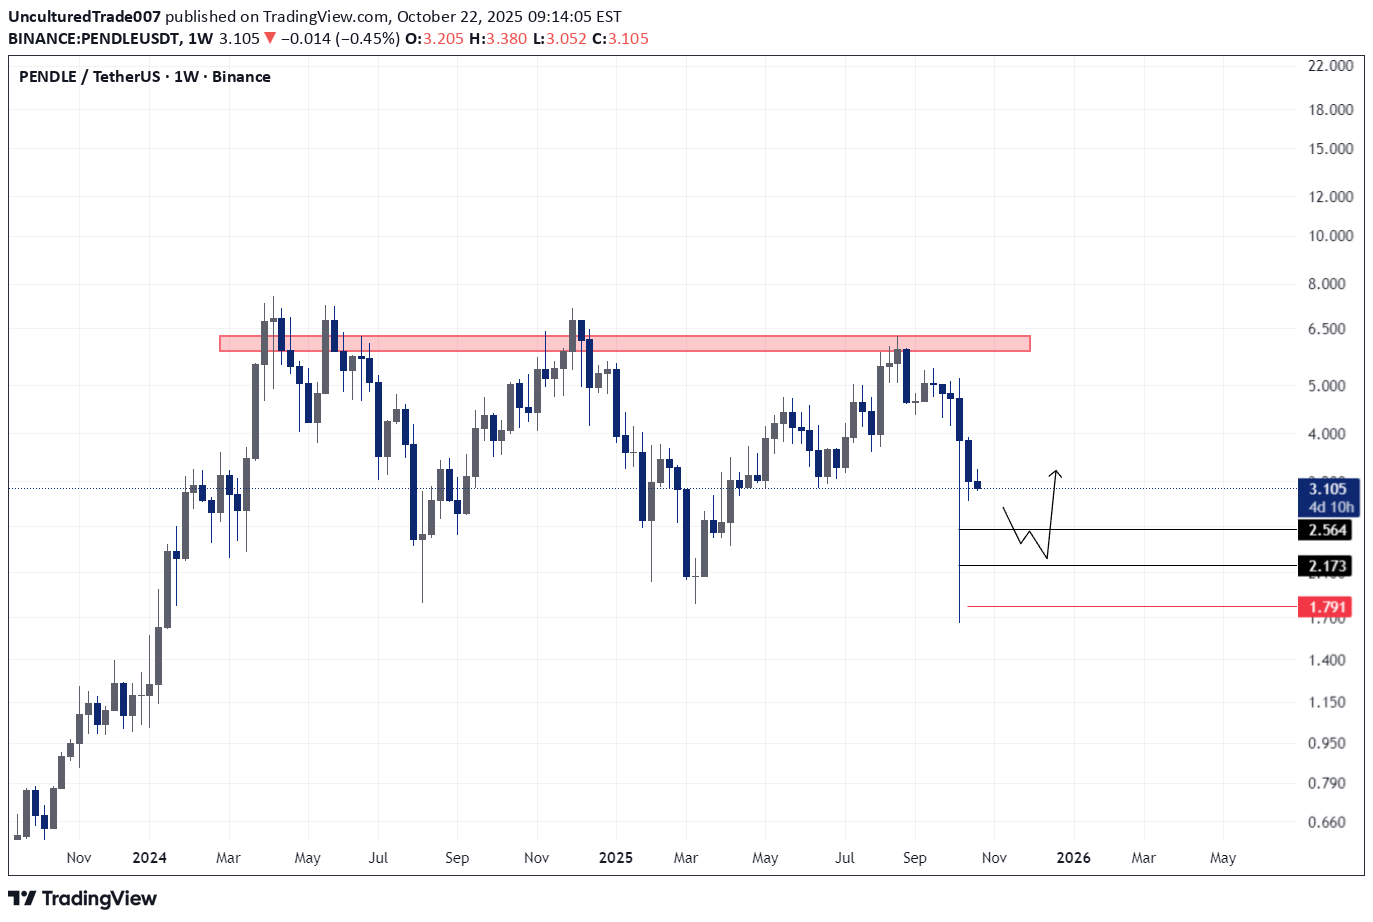
PENDLEUSDT Looking good to Long Entry Between 2.150 - 2.560 SL Below 1.791 Target above 3.5$ Lev & Margin As Per Your Risk Capacity
UnculturedTrade007
آمادهاید؟ بهترین فرصت شورت BNB (تا 1150) با نقطه ورود و حد ضرر دقیق!
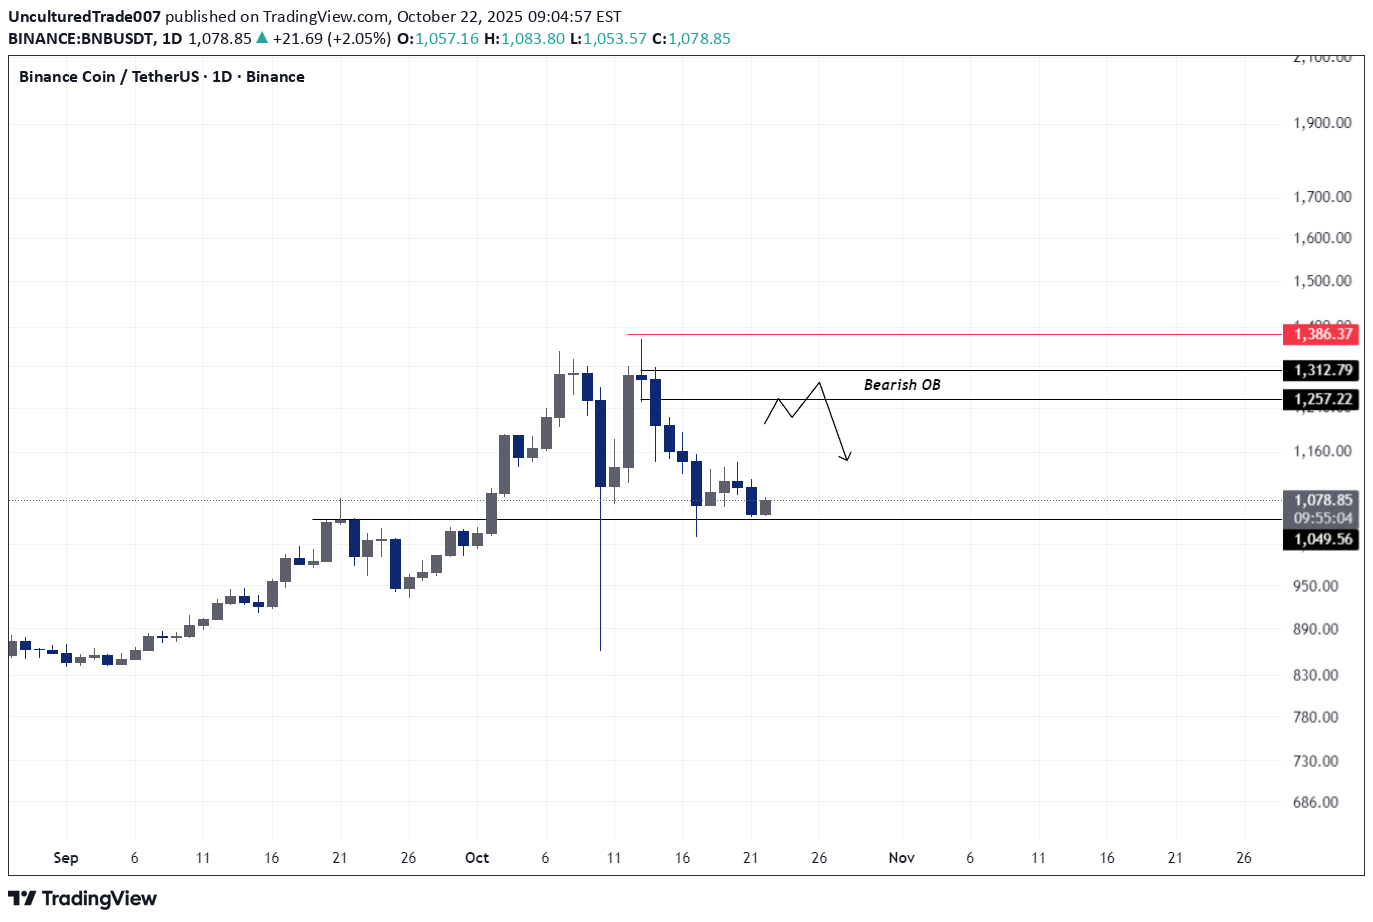
BNBUSDT Short Setup BnB Looking good to short Entry Between 1257 - 1312 SL Above recent high 1390+ Target Below 1150... Leverage & Margin as Per Your Risk Capacity
UnculturedTrade007
سیگنال خرید بیت کوین: این سطح حمایتی کلیدی را از دست ندهید!

BTCUSD 119.5k Strong Support as of now BTC Long Set-up 📈 EntrY Between 112.6k - 114.8k SL below 110.8k Target above 119k Lev & Margin as per your risk capacity
UnculturedTrade007
پیشنهاد خرید اتریوم (ETH): نقاط ورود، حد ضرر و استراتژی معامله لانگ

ETHUSDT ETH Long Set-up 1️⃣Entry Between 4430-4500 SL below 4325 2️⃣ Entry Between 4200-50 SL Below 4100 Margin & Leverage as per your risk capacity
UnculturedTrade007
سیگنال خرید لایت کوین (LTC): فرصت ورود با اهداف سود بالای ۱۱۵!

LTCUSDT LTC LONG SET-UP Entry Between 81-92 SL Below 74 Target above 115 Lev & margin as per your risk capacity
UnculturedTrade007
آمادهاید؟ بهترین فرصت خرید بلندمدت TWT با نقطه ورود و خروج دقیق!

TWTUSDT TWT Long Set-up Entry Between 1.47 - 1.50 SL Below 1.42 Target above 1.6 Lev & margin as per your risk capacity
UnculturedTrade007
ICP LONG SET-UP
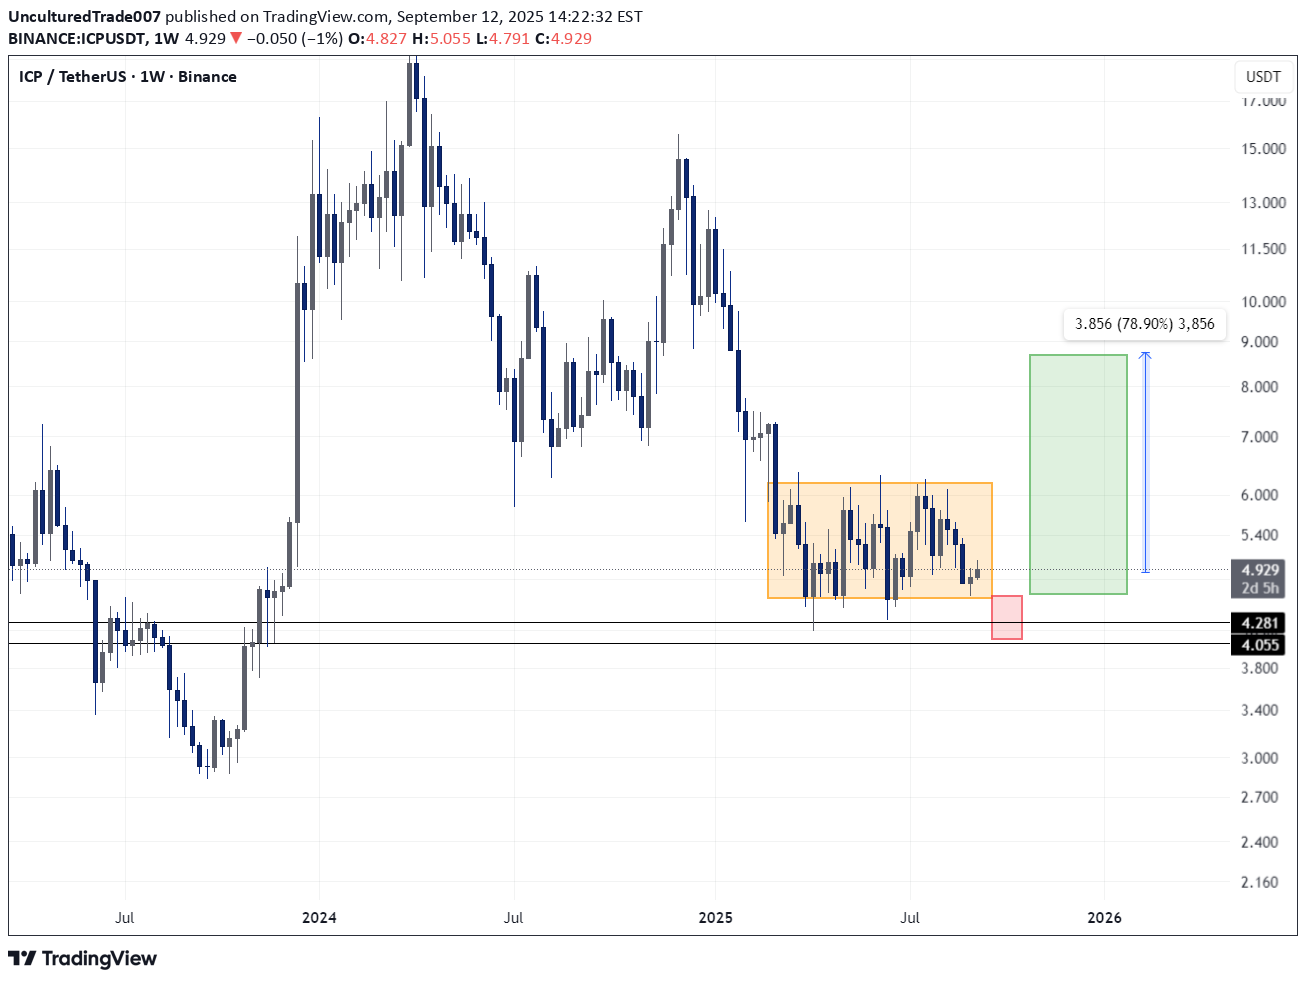
ICPUSDT ICP Looking good to long at cmp a small dip possible , will add rest 50% using low leverage only
UnculturedTrade007
MANTA - SUPER BULLISH LONG SET-UP
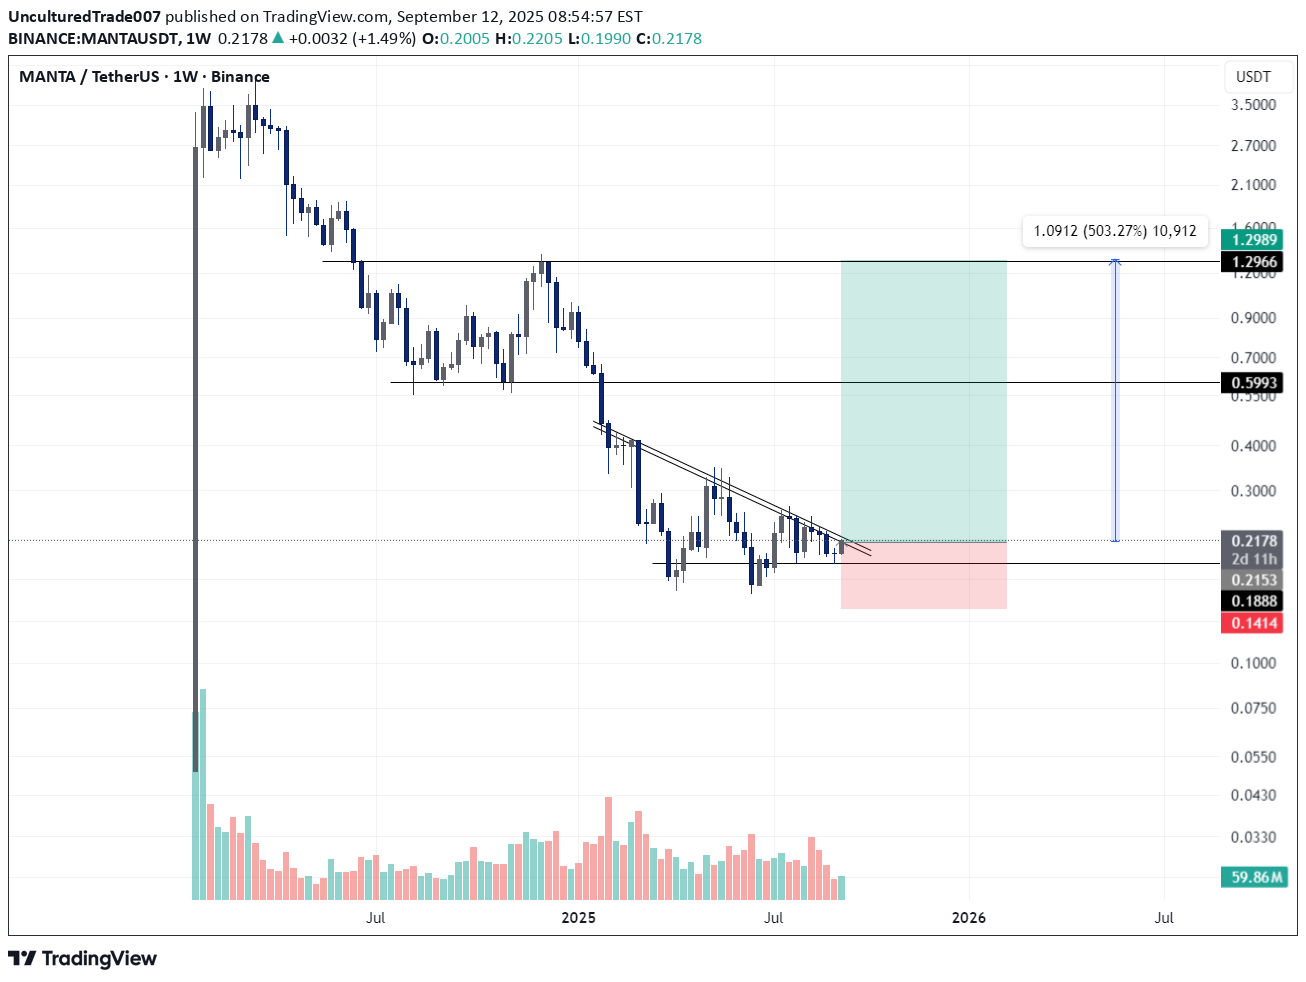
MANTAUSDT Entry: ~$0.21 Stop-loss: ~$0.14 Targets: $0.60 (1st), $1.30 (2nd) Upside: ~500% potential Risk/Reward: Very favorable if breakout holds
UnculturedTrade007

Disclaimer
Any content and materials included in Sahmeto's website and official communication channels are a compilation of personal opinions and analyses and are not binding. They do not constitute any recommendation for buying, selling, entering or exiting the stock market and cryptocurrency market. Also, all news and analyses included in the website and channels are merely republished information from official and unofficial domestic and foreign sources, and it is obvious that users of the said content are responsible for following up and ensuring the authenticity and accuracy of the materials. Therefore, while disclaiming responsibility, it is declared that the responsibility for any decision-making, action, and potential profit and loss in the capital market and cryptocurrency market lies with the trader.