
ColdBloodedCharter
@t_ColdBloodedCharter

What symbols does the trader recommend buying?
Purchase History
پیام های تریدر
Filter
ColdBloodedCharter
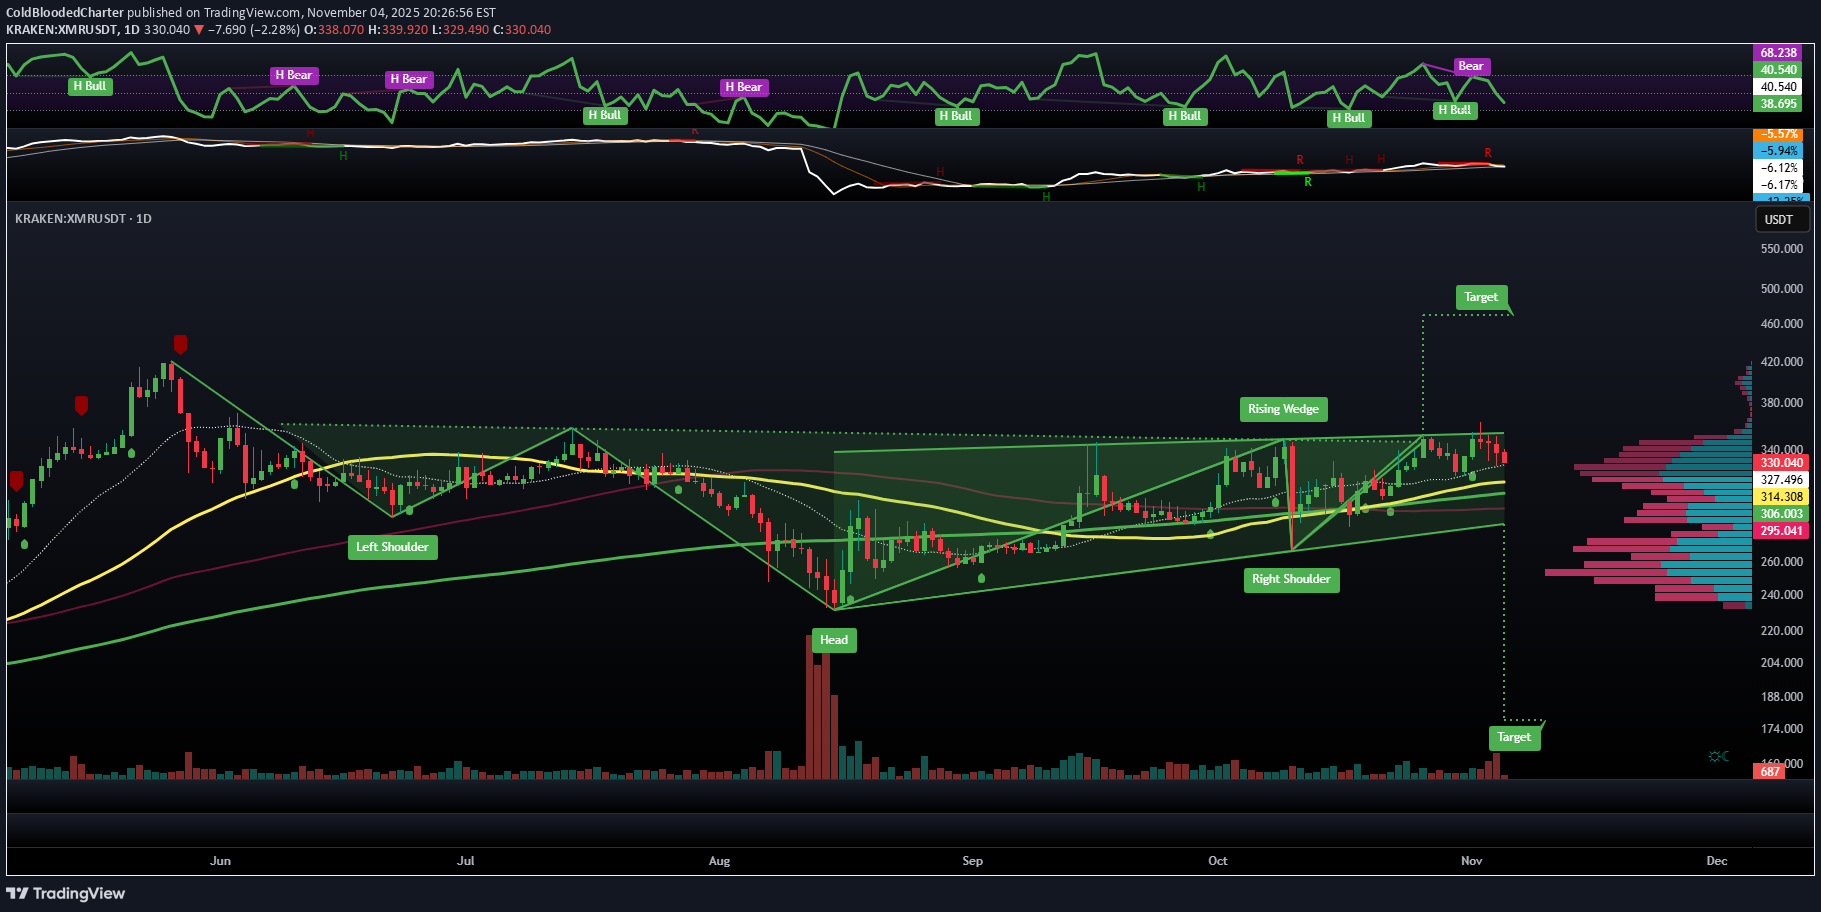
مونرو (XMR): راز صعود پنهان RSI و کشف قله جدید قیمت!
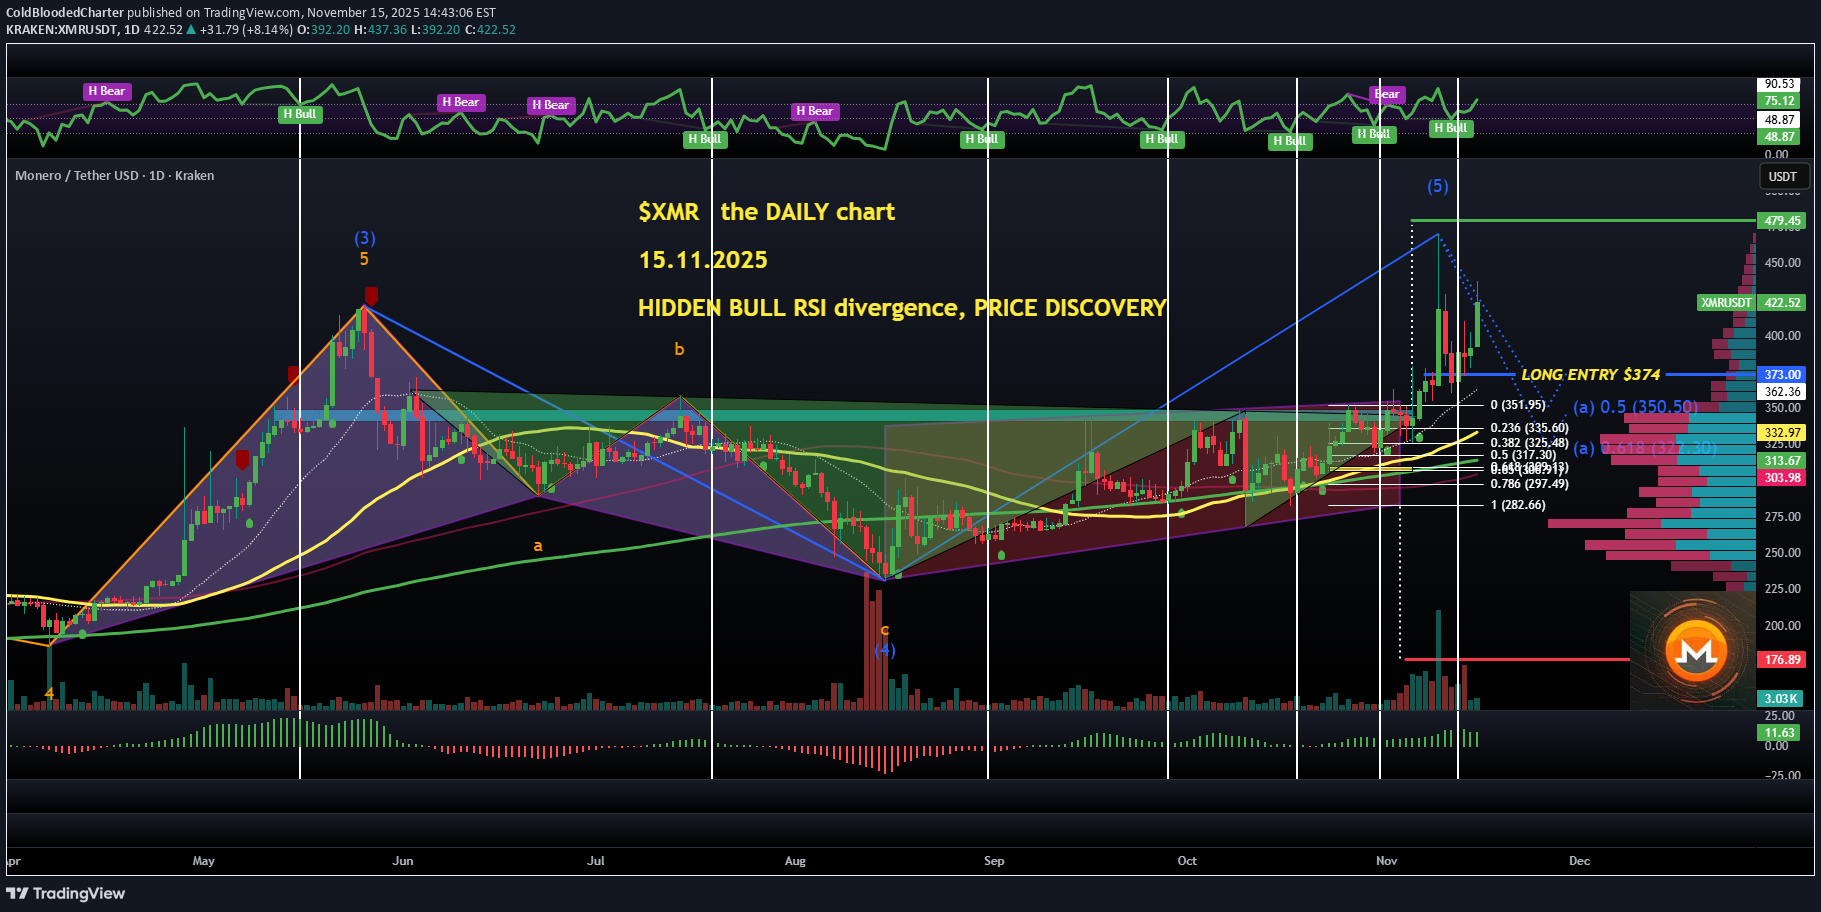
Day 8 in this XMR long position ($374) and obviously this is my only leveraged LONG. My first TP was placed 1% below the INVERTED HEAD&SHOULDERS target ($475) and missed by $5, literally - so unlucky, as the new ATH was established at $470. The DAILY chart is still in WAVE 5 and we've seen yet another HIDDEN BULL RSI divergence (horizontal lines; 5 out of the previous 6 of these divergences led to rallies and RSI crossing above 90). Currently RSI = 75, a bit overbought but with enough room for a solid rally. The 4-HOUR and 8-HOUR charts also show the active WAVE 5 with two most probable targets: $477 and $549. So, my 3 partial TAKE PROFIT levels remain: $475, $544, and a moonbag. STOP LOSS strategy has been adjusted a bit: I'm going to manually close in 3 parts below the 50 MA ($333 atm and rising = a superb dynamic SUPPORT). #Monero is an asset I'm currently the most bullish on - and have been for weeks, as you know. Nothing has changed. 👽💙
ColdBloodedCharter
پایان مرحله کشف قیمت ZEC؟ تحلیل 4 ساعته و سرنوشت قیمت زیکش
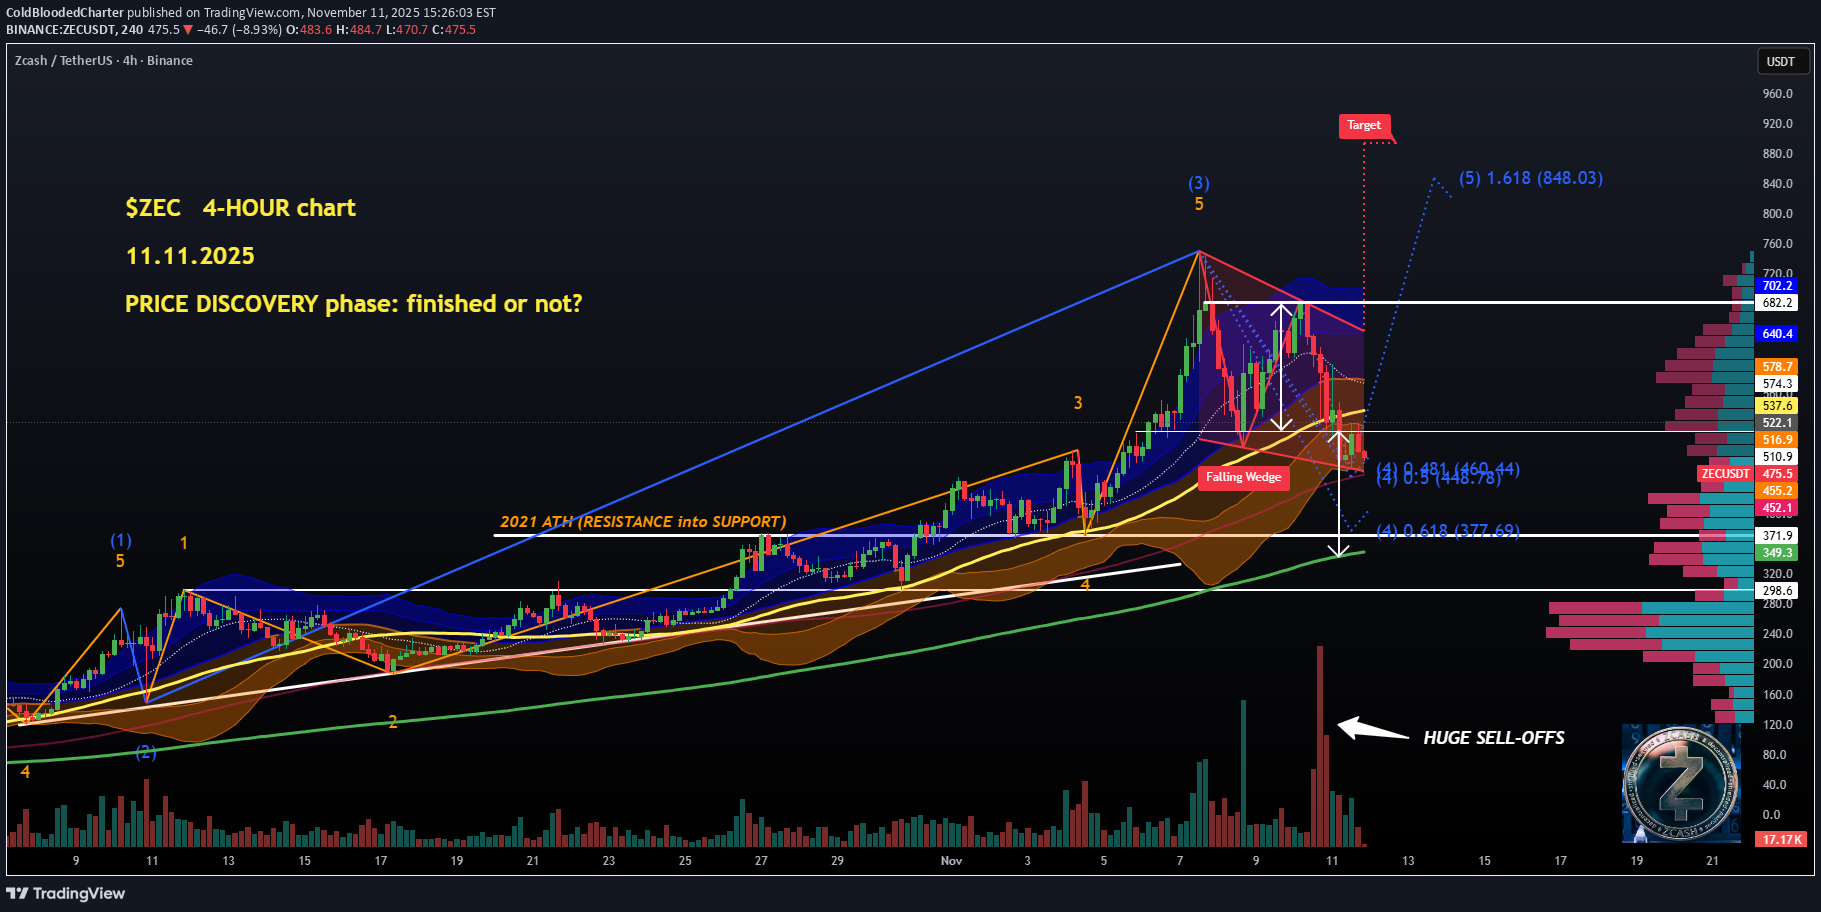
A lot of people have gotten trapped in ZEC - I can see it clearly on the LIQUIDATION HEATMAP (attached). Is this the end of the price discovery phase already? The DAILY chart still shows a BULLISH market structure, but it also looks like a textbook blow-off top following a parabolic rally - long rejection wicks and a clear BEARISH ENGULFING candlestick pattern. Based on the daily setup, the price could have another leg up (WAVE 5), so there’s still some hopium left. Zooming in on the 4-HOUR chart makes the outlook much more BEARISH - a DOUBLE TOP breakdown below the neckline (targeting roughly $350, right where the 200 MA is sitting), with huge selling volumes on that second top (counting candle closes, not wicks). The price is also trading below the 50 MA (yellow line at $537). #zcash has now made a LOWER LOW following a LOWER HIGH (also visible on the 6H/12H timeframes), confirming a DOWNTREND. EW-wise, similar to the DAILY chart, this #PrivacyCoin (not as private as people believe) could be in a WAVE 4 correction targeting $450 or $378 (the 2021 ATH and key ‘price discovery phase support’). That could still set up a potential WAVE 5 rally. I don’t have any positions here - I don’t trust this asset. I wanted to SHORT it last week but didn’t get a solid setup. My plan now is to wait and see if it bounces off the lower SUPPORT levels mentioned earlier. It’s too early with the DOUBLE TOP breakdown still active. Alert set at $380 - on my WATCHLIST since I still believe the #Privacy narrative will stay relevant in crypto for longer. For the BULLISH scenario: ZEC needs to reclaim the BREAKDOWN point ($510) and the 50 MA first, and then show some BULLISH divergences to work with. 👽💙
ColdBloodedCharter
بیت کوین: شکست خط ۵۰ هفتگی؛ آیا صعود یا سقوط در راه است؟
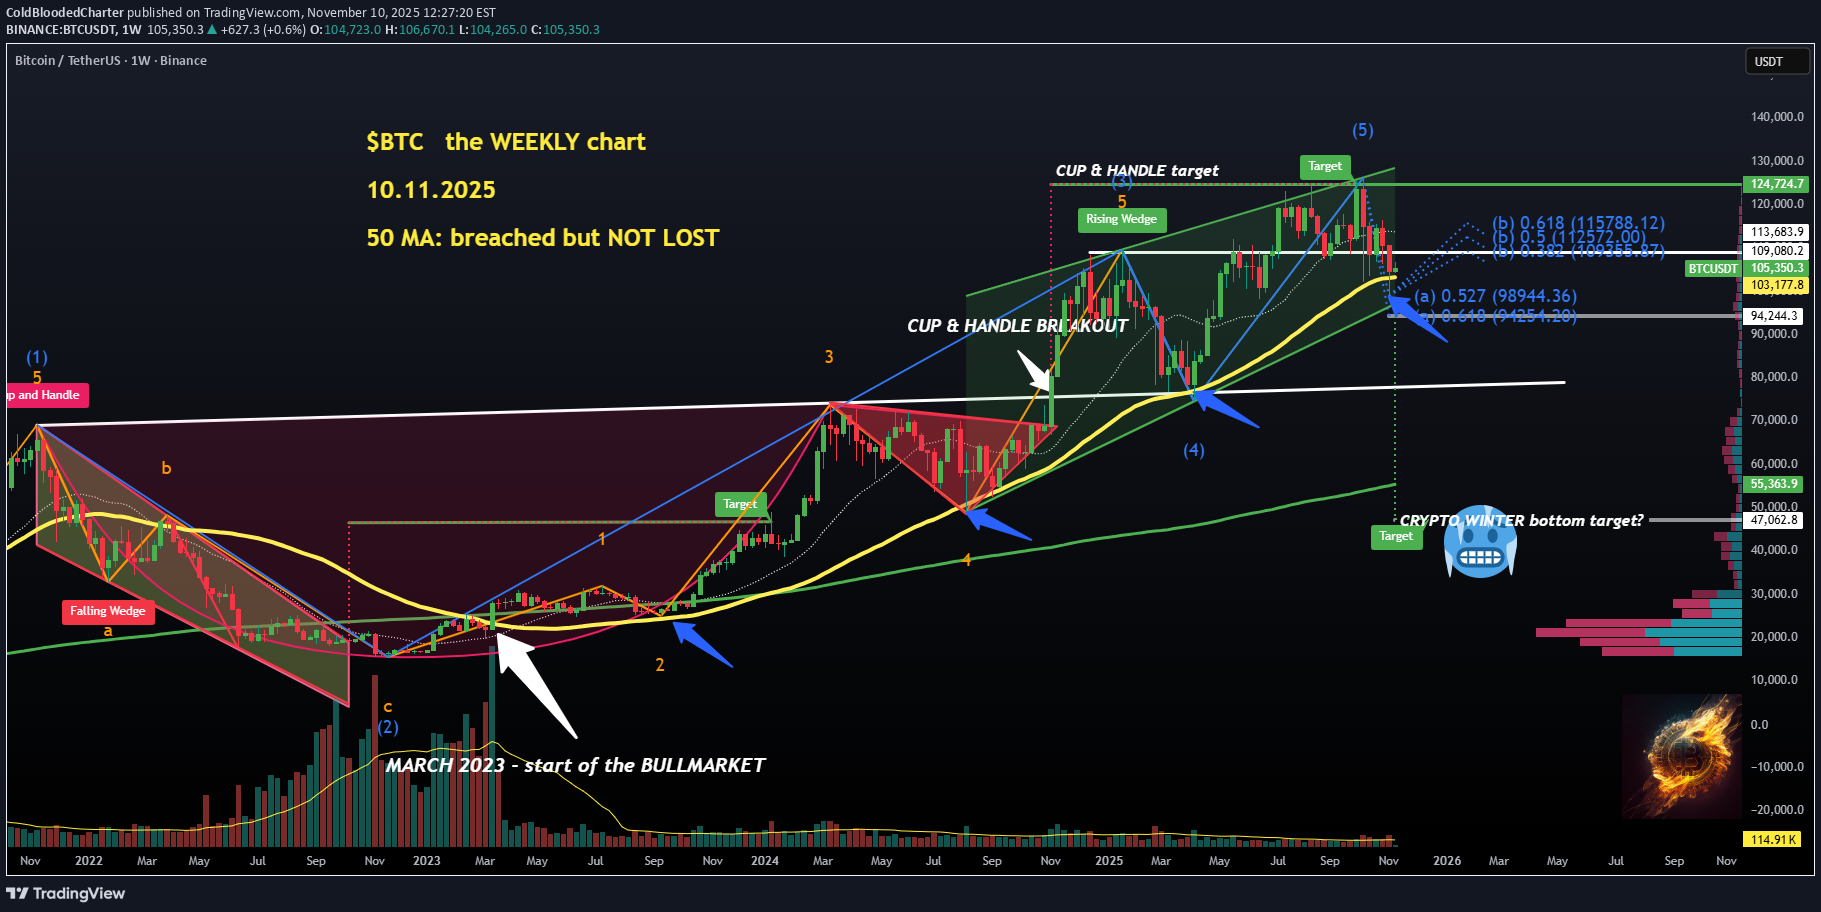
So yesterday #TRUMP “announced” a $2000 stimmy check for US citizens, and a lot of people started aping in from what I can see. Not me — I don’t believe a single word that comes out of his mouth. Not only because he had promised a $5k DOGE “dividend” earlier this year, either. Let’s have a look at the WEEKLY BTC chart for any changes. First of all, the 50 MA that I have used as a line in the sand between bull and bear markets — Bitcoin did manage to reclaim it after trading below for a couple of days. $103k remains the key level to watch. Secondly, the ELLIOT WAVE count has been quite clean on this chart, which means that there are two likely paths based on the assumption that a WAVE 5 completed a month ago (ATH): 1. a WAVE B next, targeting $109k, $112.5k, or $115.8k, followed by a deeper correction than what we saw last week. 2. a WAVE A continuation to the downside ($94,250 being the most likely target), which would test the RISING WEDGE’s lower trendline again. LIQUIDATIONS-wise, both of my scenarios make sense: a dip to $94k would annihilate all the latest BULLS that opened leveraged positions last weekend, while a rally to $116k–$118k would short-squeeze most of the bears that shorted below $110k. All in all, it’s 50–50 — no idea what’s going to happen based on the #WEEKLY, and that’s absolutely fine. No need to pretend to know at this moment. Trading is 90% reaction to new data, not predicting. Knowing key levels is crucial to building a solid strategy. So, holding the 50 MA ($103.2k) is necessary to keep the optimistic outlook. The BULLISH scenario gets much more likely above $109k, and losing $94k would be FATAL. Whatever I do is never based on any politician’s promises — it’s always the data that guides me. Need a good look at the DAILY chart now — next post. 💙👽
ColdBloodedCharter
سیگنال خرید مونرو (XMR): آغاز صعود انفجاری از ۳۷۴ دلار! (پیشبینی هدف ۴۷۹ دلاری)
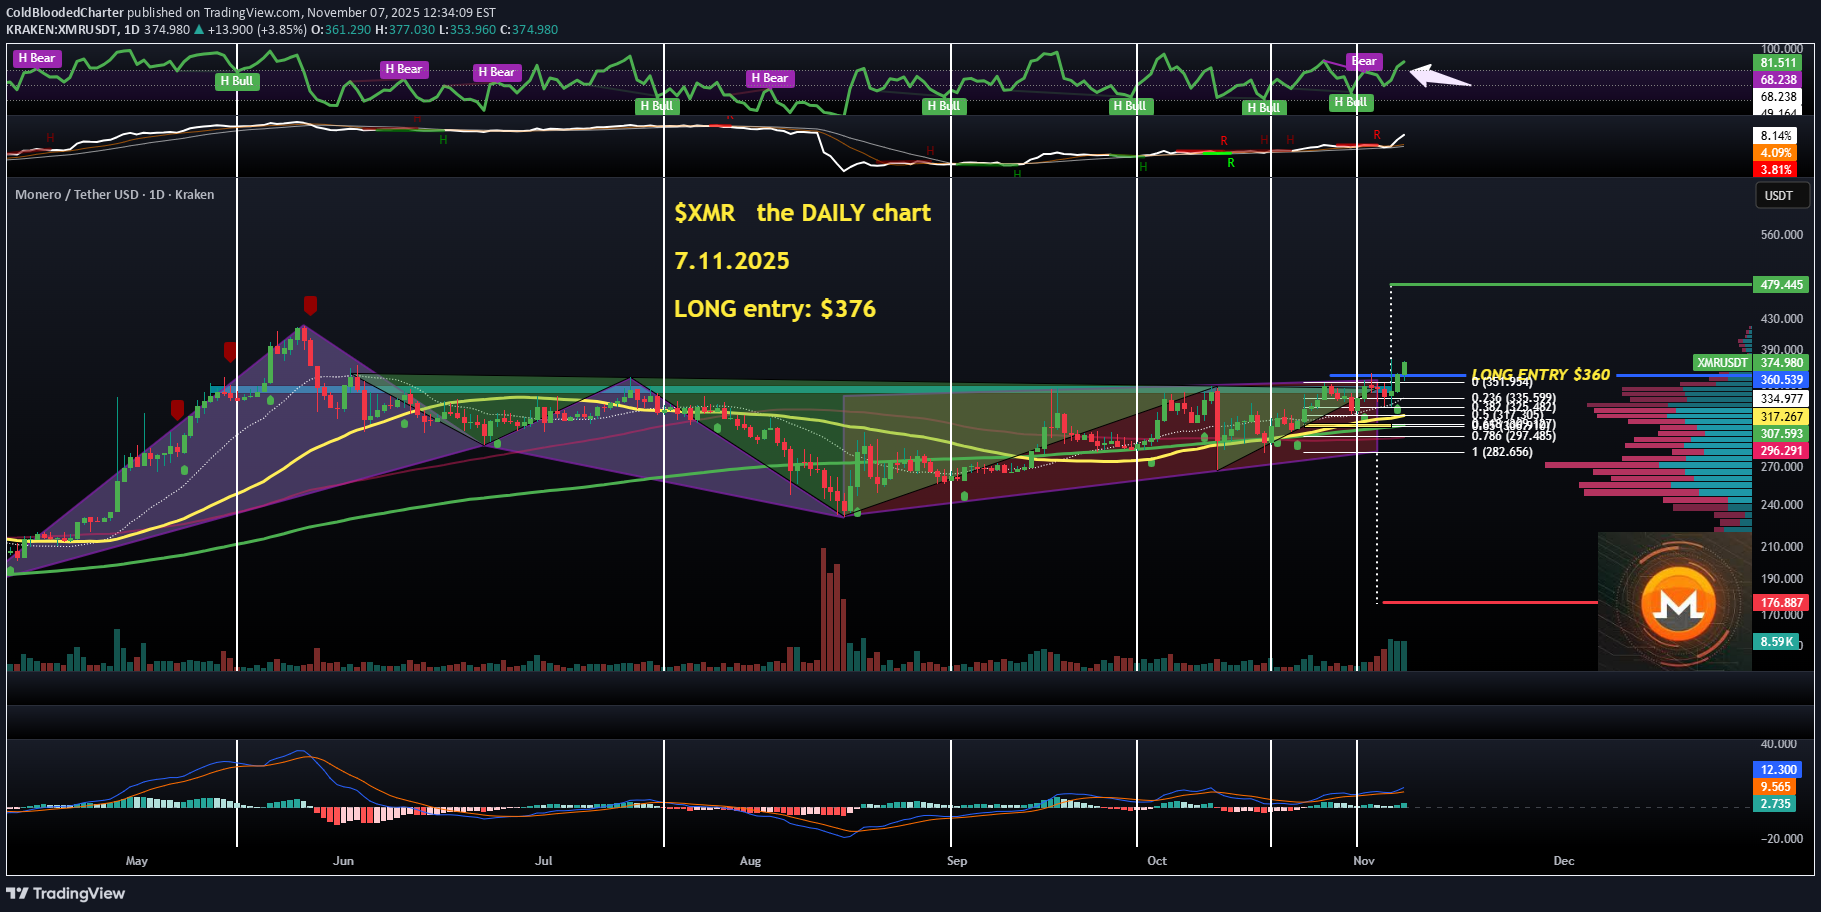
XMR long position from here, $374, low leverage, following the BREAKOUT I talked about for weeks and it finally seems to materialize. INVERTED HEAD & Shoulders pattern is breaking out (breakout point: $360) targetting $479 and invalidation of the RISING WEDGE going on too at the same time. Volume spikes, that previous HIDDEN BULLISH RSI divergence working its magic. Today's DAILY candle close MUST be a strong one, if not, I might close the LONG manually. IN now at $374, STOP LOSS below $325 after a few 4-hr closes in order to avoid flash-crash wicks down. Slow leverage, this will have days or weeks of upside following the #Privacy coins mania. This #Monero accumulation has been long, since JUNE and there should be an explosive move next. 💙👽
ColdBloodedCharter
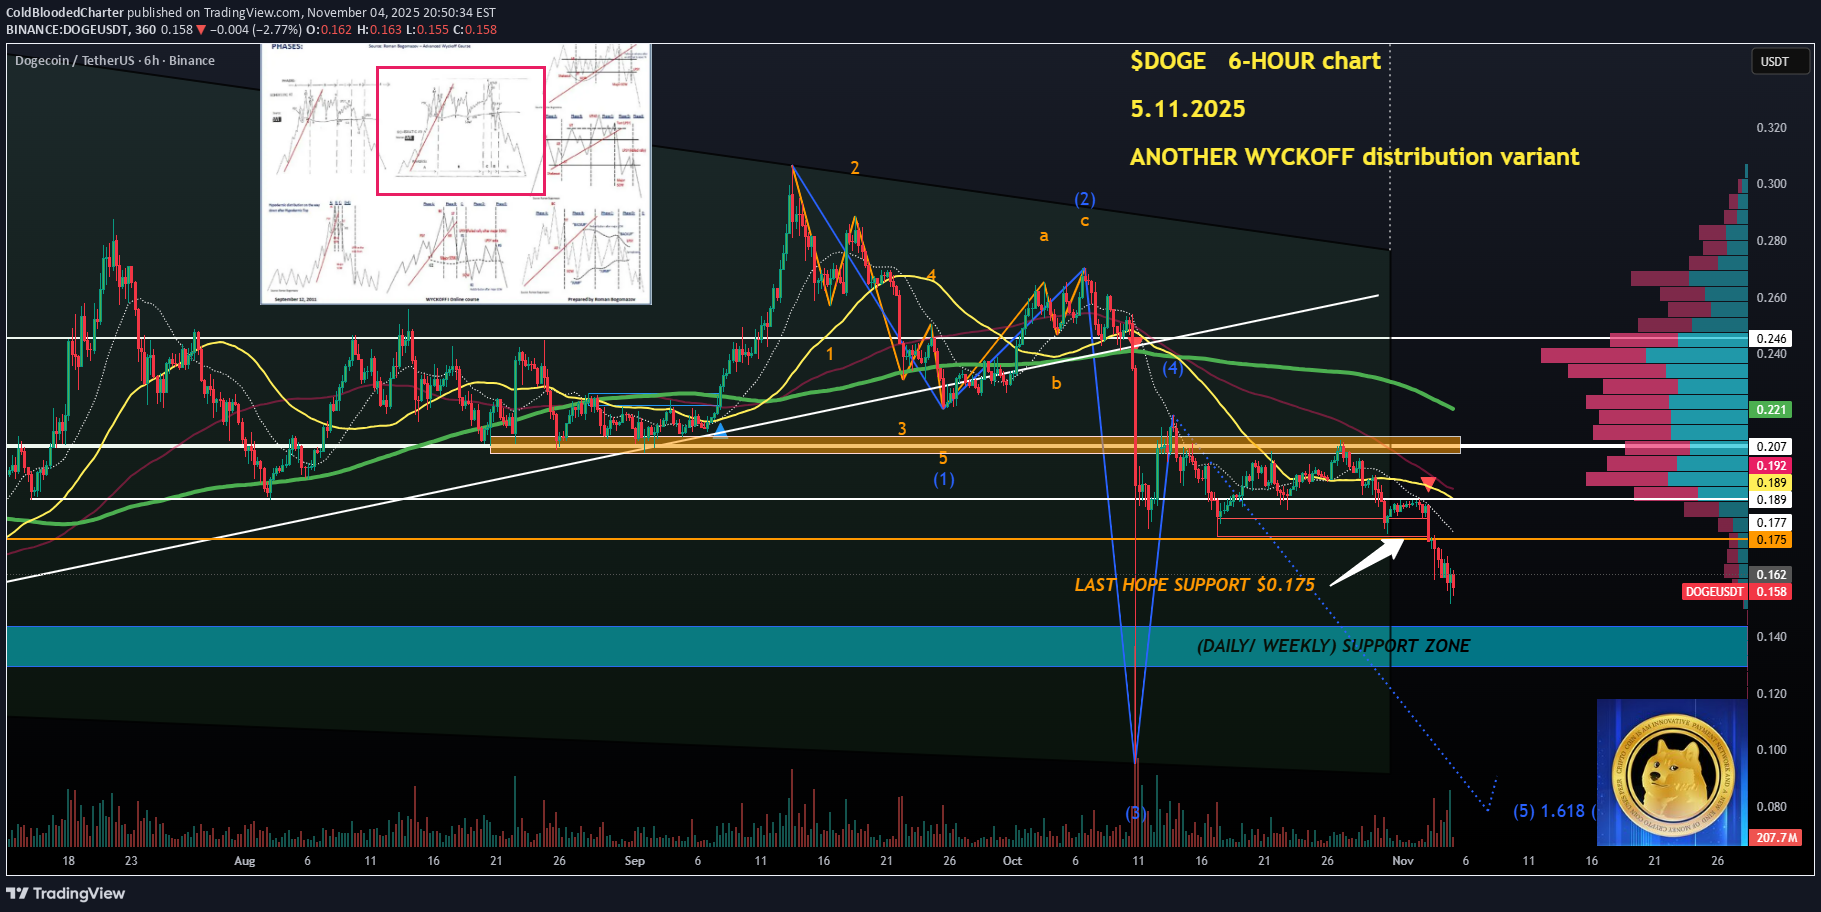
الگوی توزیع وایكاف در دوج کوین: آیا سقوط نهایی در راه است؟
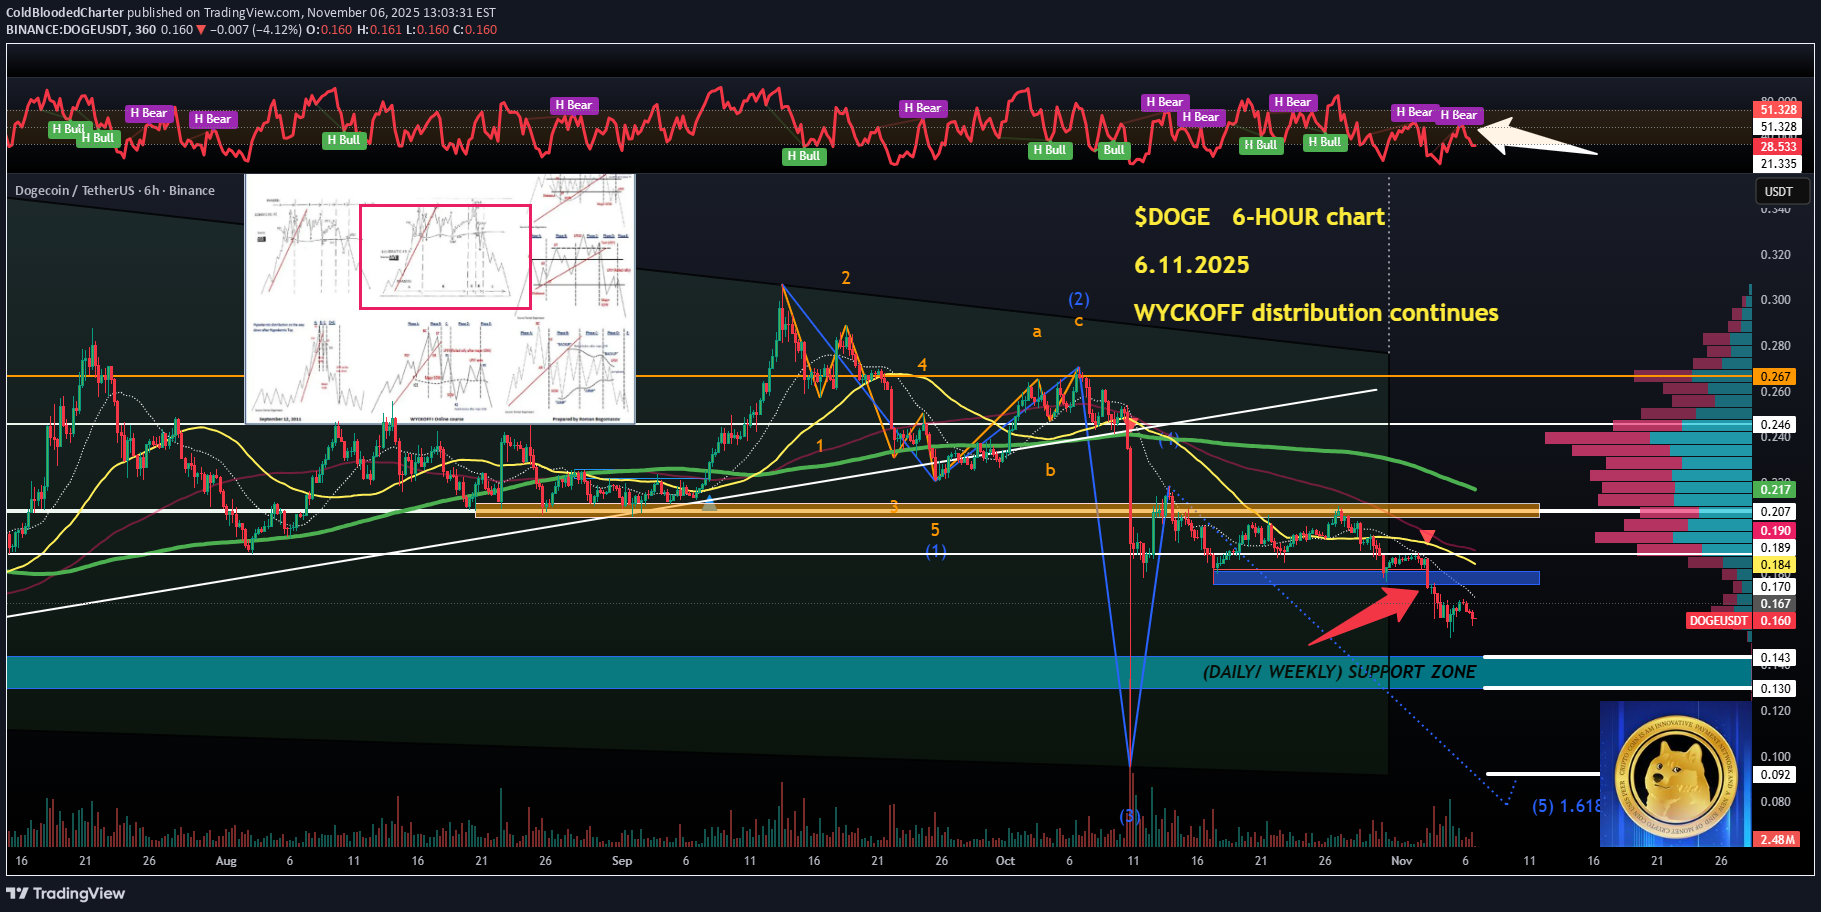
I still haven't taken any profits off my DOGE short (18.7c), and it looks like another leg down might be coming next. Another BEAR RSI divergence, a SELL signal flashing, and another LOWER HIGH on tiny VOLUME bars. Sellers are winning, so I wouldn't exclude a scenario where #Dogecoin has an unexpected surge to LIQUIDATE late BEARS (up to 17.5c as per the attached heatmap) first and then continues downwards. I have modified my EXIT strategy — I would be 33% out of this position after each 4-HOUR candle close ABOVE 19c. 3 TAKE PROFIT levels are marked on the attached 6-HOUR chart. 💙👽 #WyckoffPattern continues
ColdBloodedCharter
سقوط سولانا: حد ضرر ۱۶۵ دلاری فعال شد! (تحلیل تکنیکال)
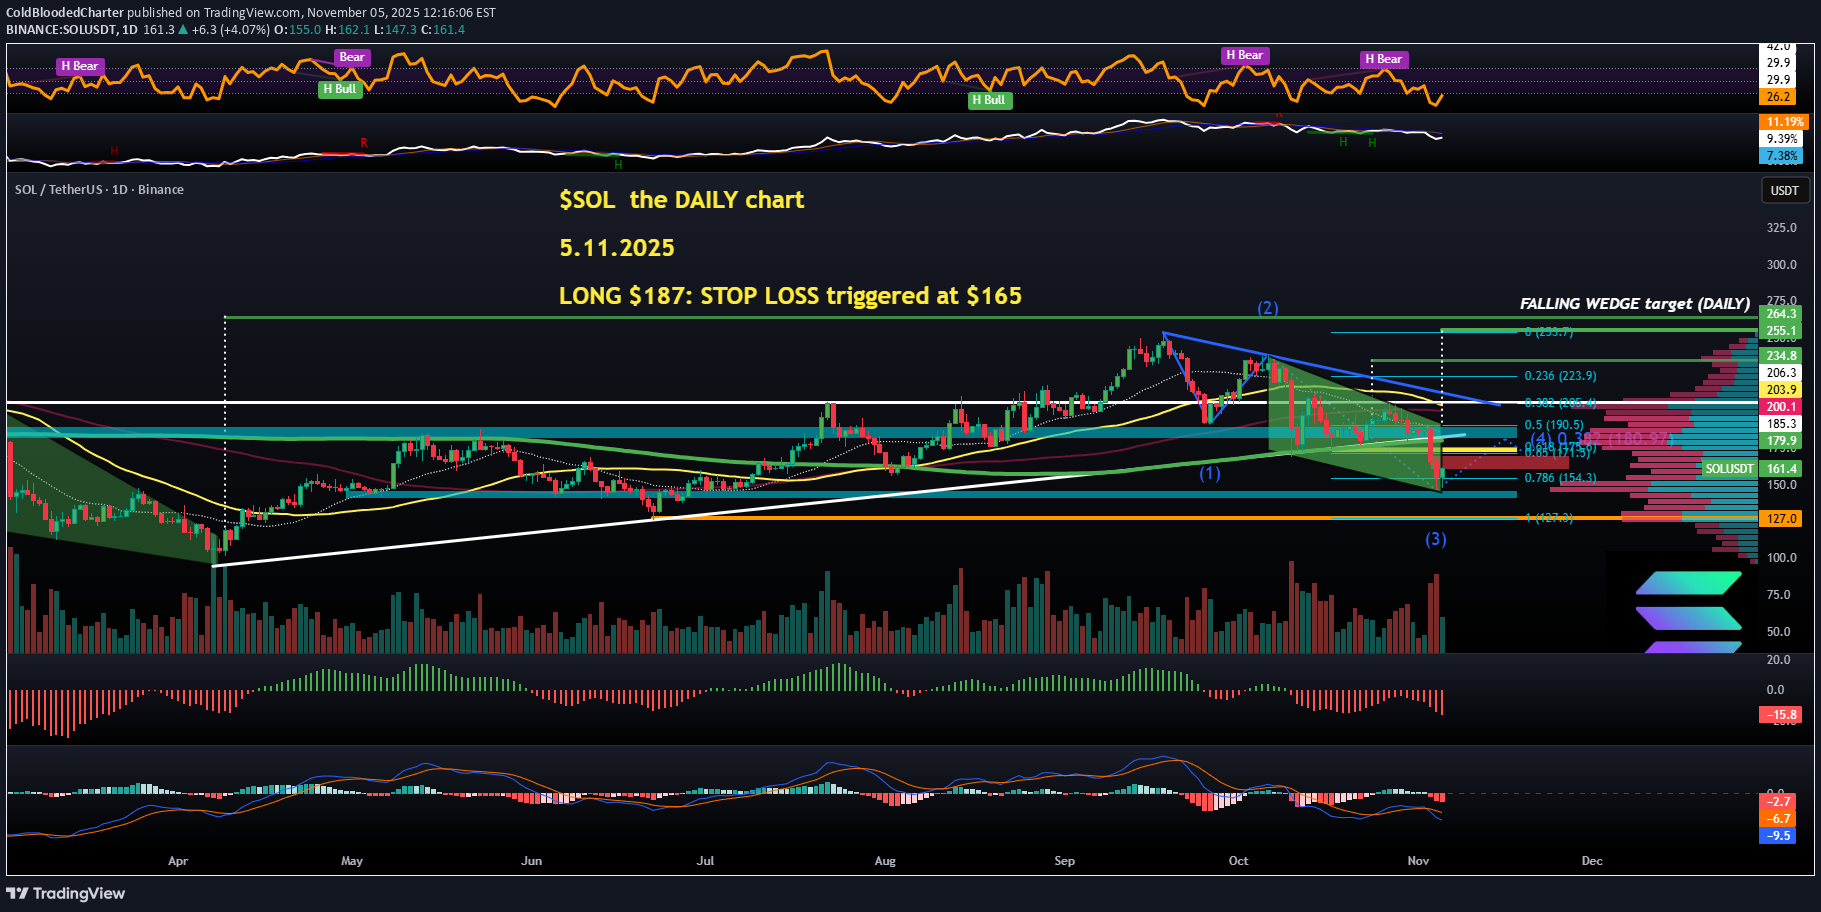
My SOL LONG from $187 triggered its STOP LOSSES after three 4-hour candles closed in the EXIT zone, average SL price: $165. Thankfully a modest-size trade, the confluenced SUPPORT area finally gave way to a wider market bloodshed (including TECH stocks, after TRUMP's #AI chip restrictions on #china yesterday). The $154 mark has been holding (Fib 0.786), let's see for how long as the STRUCTURE remains BEARISH, a LOWER LOW yesterday following a LOWER HIGH after a Hidden BEAR RSI divergence recently. The GOLDEN POCKET ($171 to $176) with the lost 200 MA at $180-, this is the immediate resistance zone to cross above before the bias can change to bullish again. Possible shorts utilizing the resistance mentioned, but I would need some bearish divergences first, not any yet. 💙👽 #solana
ColdBloodedCharter
هشدار جدی: 6 بار تکرار شده و هر بار قیمت ریزش کرده! سیگنال نهان ریزشی LINK چیست؟
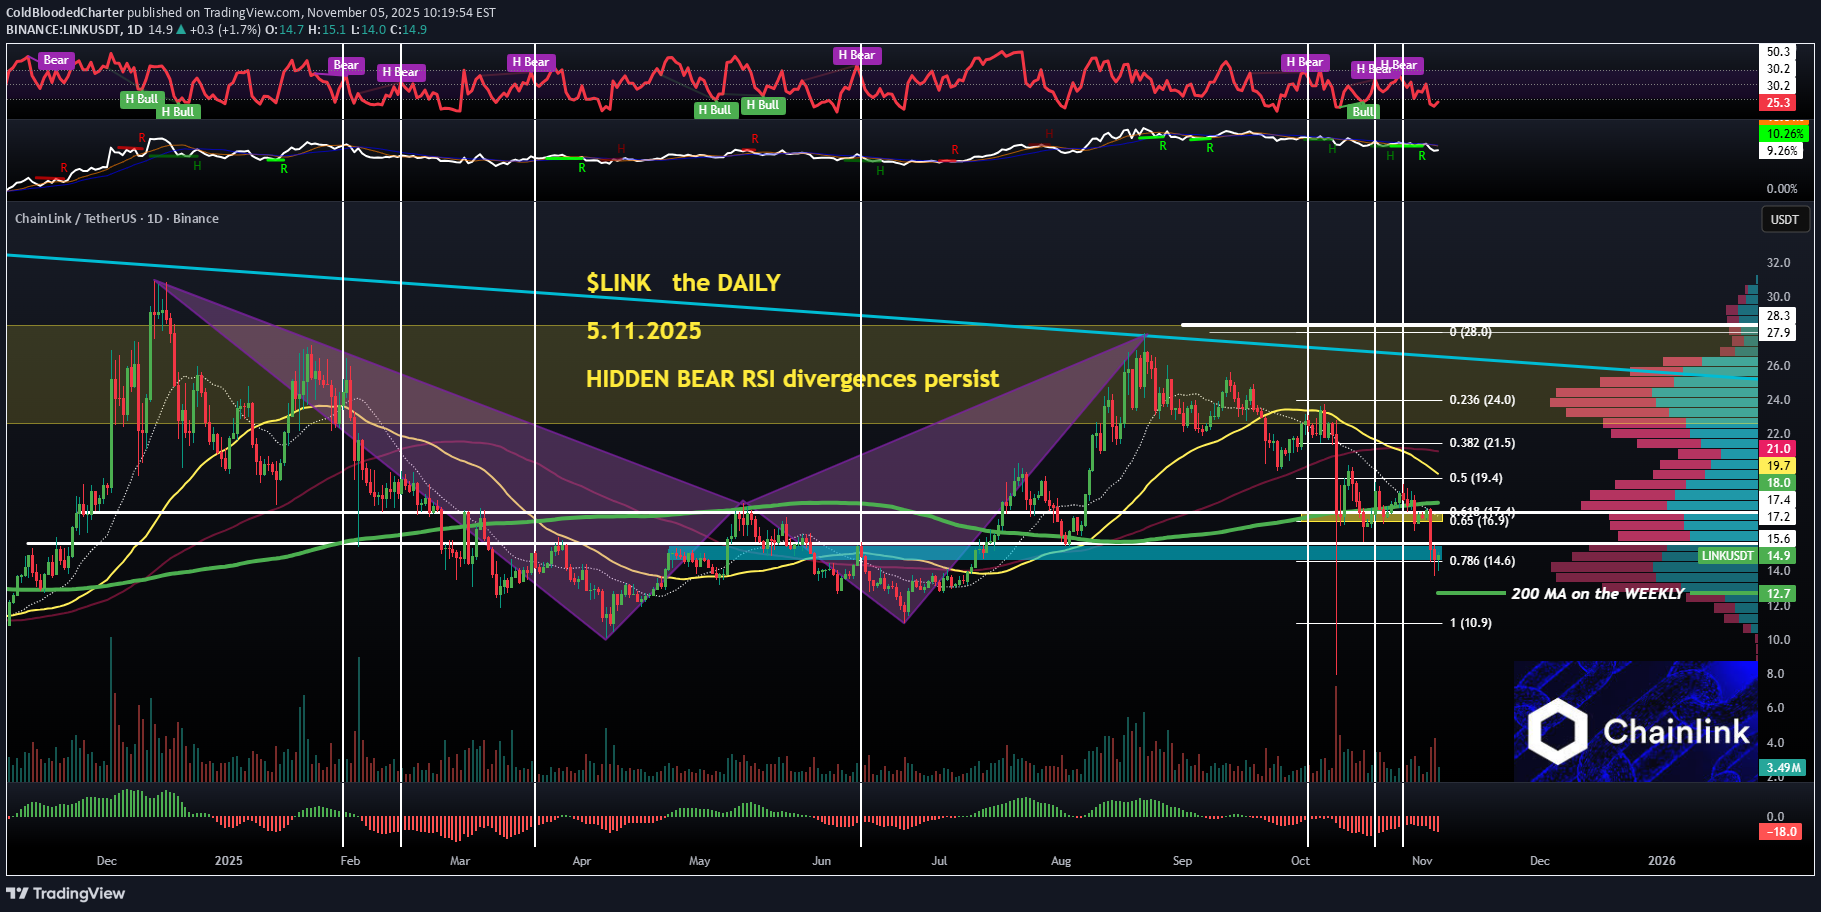
My last LINK update on Oct 25 played out pretty well. It was around $17.9 back then, fighting to hold the 200 MA sitting on top of the Golden Pocket. Now at $15, and the $14.6 level I mentioned as one of two targets has been holding so far. There have been 6 previous HIDDEN BEARISH divergences on the RSI — each one followed by a CRASH. I’ve marked the horizontal lines to show those rare but powerful hidden signals that almost never fail during broader market declines. At this point, $14.6 remains the key SUPPORT to watch. If it breaks, the next stop is $12.6 — the 200 MA on the weekly chart. I’m watching closely for another hidden bearish divergence to form at or near RESISTANCE on a LOWER HIGH. One more of these could offer a high-probability short entry. Still, the OBV remains bullish, and that’s the only thing keeping me from fading this setup. No shorts as long as BTC stays above $103K (the 1W 50 MA) — that’s my main market filter for now. 💙👽
ColdBloodedCharter
نبرد بزرگ هایپرلکوئید: برگشت ناگهانی قیمت بالای ۴۰ دلار! آیا سقوط به زیر ۳۹.۸ دوباره آغاز میشود؟
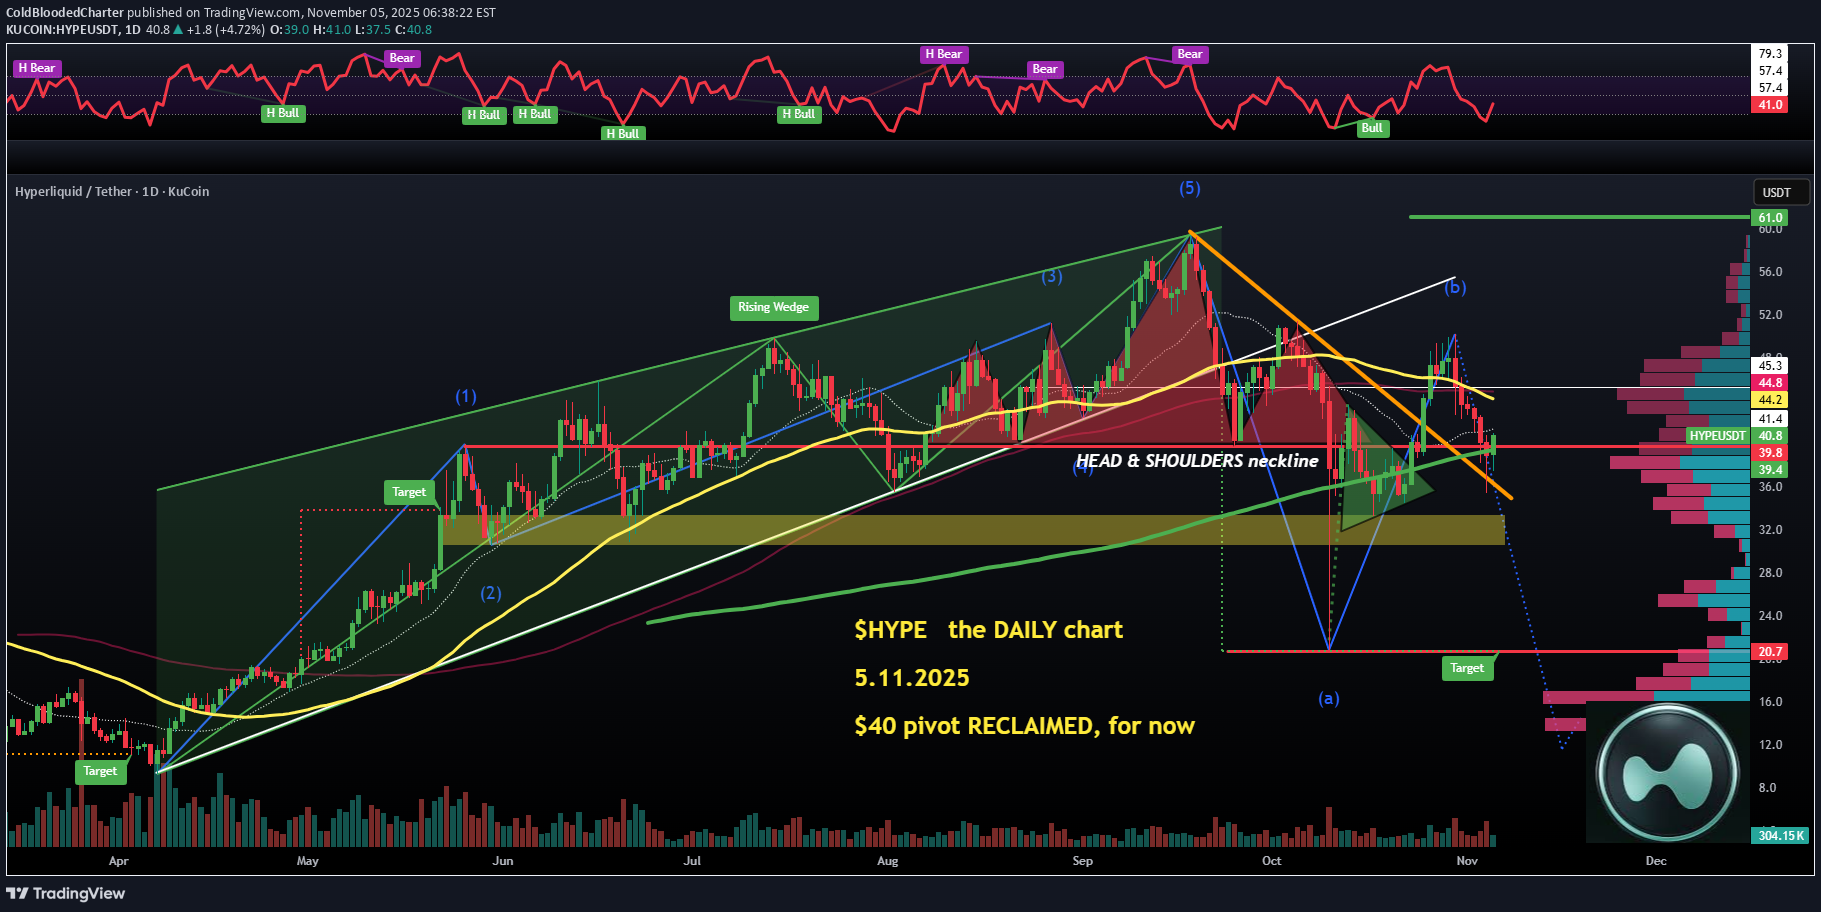
A lot of wrestling with the markets atm. I opened a SHORT last night in HYPE after it lost the 200 MA/key horizontal pivot level ($39.8). #Hyperliquid doesn’t want to drop yet, it seems, so my exit strategy has been active — 2 out of 3 planned candlesticks have closed above $40, and one more is likely to close in 30 minutes. I’m two-thirds out with a small LOSS, but I’m going to short below that LEVEL again automatically. Cross below $39.8, and I’m short again — unless BTC manages to reclaim its 50 MA on the WEEKLY ($103K). Once I’m back in the short, the STOP-LOSS strategy is similar: 33% exit on each 4H candle close above the $40 mark. The price action will either crumble below or get a good bounce to the upside; it won’t be hugging the 200 MA for much longer. I want to ride the dip to $33.5 and $31 (two TPs for me). The fight continues. 💙👽
ColdBloodedCharter
تحلیل کامل معامله شورت دوج کوین: سطوح ورود، حد ضرر و تارگتهای شگفتانگیز!
DOGE short doing well. I couldn't remember if I published TP levels or not, so I asked #Grok to summarize my latest trade on #DOGE and it did an incredible job of it, actually. Here is the summary it generated: Latest DOGE Trade SummaryTrade Type: Short (Bearish position) Open Date: November 1, 2025 Entry Price: $0.187 Rationale: DOGE entered bear market territory after losing key supports (200 MA + horizontal), bearish retest in a downtrend, impending death cross (50 MA below 200 MA on daily), and multiple hidden bearish RSI divergences across timeframes. Relative weakness confirmed vs. BTC (three bearish RSI divergences on DOGE/BTC daily). Low-leverage entry in risk-off market climate. Stop Loss Tactic: Manual, multi-part exit to manage risk: Close 25% position on each 4-hour candle close above the 200 MA (~$0.209 at entry). Full exit sooner if solid bullish divergences appear on charts. Invalidated if $0.21 flips into support (potential liquidation). Take Profit Levels: Yes, explicitly mentioned: Level 1: $0.143 Level 2: $0.130 Level 3: $0.092 (Targets subject to adjustment based on new technical developments; bearish bias holds until $0.21 reclaimed or risk-off ends.) Overall Bias: Bear market coin below 200 MA daily—prefer shorts below, longs above. Position active as of November 2 update; monitoring for updates. Wow. Let me know if you want summaries of this kind more, on top of my ramblings or instead of them, lol. 👽💙
ColdBloodedCharter
خروج اضطراری از معامله خرید مونرو (XMR): هشدار قاطع برای توقف ضرر در ۳۳۲.۸۵ دلار
XMR has given me no choice but to excuse myself out of this LONG like a proper gentleman. BEAR RSI divergence detected on the recent HIGH, which was a weak one, and that candle closed below the recent high. Also, BEAR OBV divergence — that’s a DEADLY combo, so I have exited my half-stakes LONG ($339), but still loving the chart and going to hunt for a dip soon, most likely. #monero has been brilliant during the recent slow collapse, outperforming most of the coins, so that position was solid — no regrets, tiny loss of 2% in terms of price action. Potential GOLDEN POCKET dips soon around the 200 MA ($306). Too early to say. My $360+ BREAKOUT entry strategy is SUSPENDED — it’s blood everywhere, #Tesla , #nvidia, and even commodities. No time to LONG stuff... but I still love this technically unique set-up on the DAILY chart 💙👽
Disclaimer
Any content and materials included in Sahmeto's website and official communication channels are a compilation of personal opinions and analyses and are not binding. They do not constitute any recommendation for buying, selling, entering or exiting the stock market and cryptocurrency market. Also, all news and analyses included in the website and channels are merely republished information from official and unofficial domestic and foreign sources, and it is obvious that users of the said content are responsible for following up and ensuring the authenticity and accuracy of the materials. Therefore, while disclaiming responsibility, it is declared that the responsibility for any decision-making, action, and potential profit and loss in the capital market and cryptocurrency market lies with the trader.