
readCrypto
@t_readCrypto

What symbols does the trader recommend buying?
Purchase History
پیام های تریدر
Filter
readCrypto
The key is whether the price can break above the 0.04032-0.04342
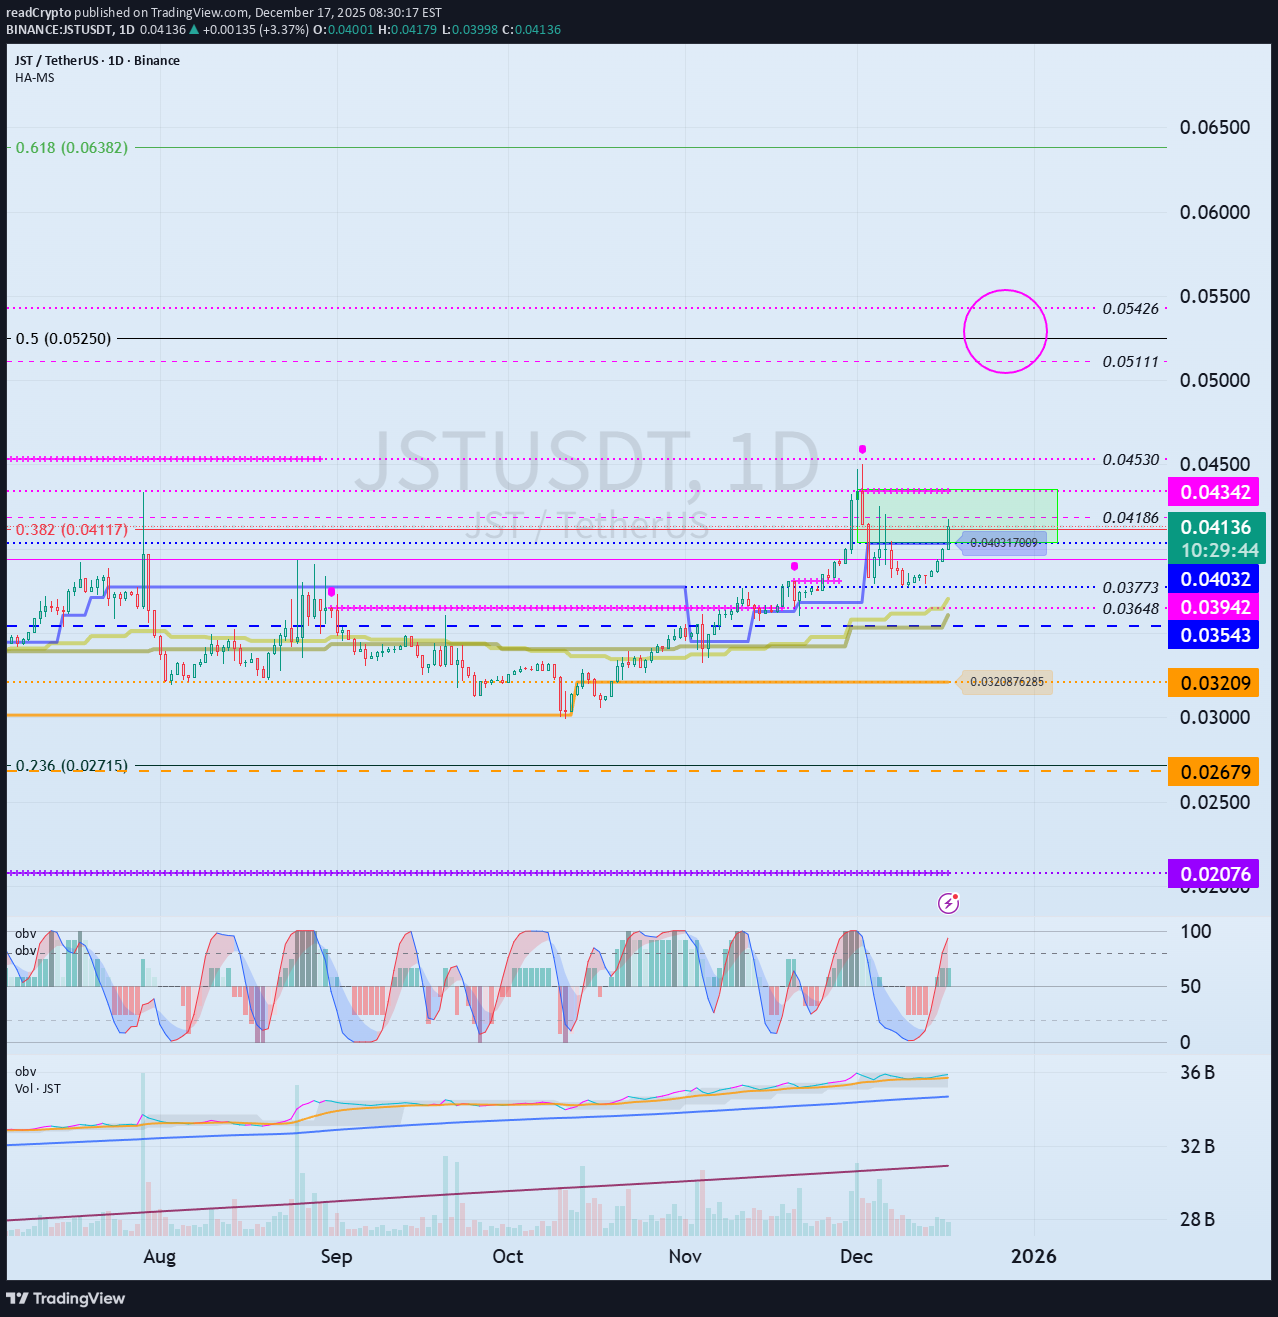
Hello, traders! Follow us to get the latest information quickly. Have a great day. ------------------------------------- (JSTUSDT 1M chart) If the price holds above 0.03942, a full-scale uptrend is expected to begin. - (1W chart) If the price rises with support near 0.03942, an upward breakout near 0.05111 is likely to initiate an uptrend. If the price fails to rise and falls, 1st: 0.03543 2nd: 0.02679 We should check for support near the 1st and 2nd levels above. - (1D chart) The HA-High ~ DOM(60) range is formed between 0.04032 and 0.04342. Therefore, a breakout above 0.04032 and 0.04342 is necessary for a stepwise uptrend to occur. The first resistance level of the step-up trend is expected to be around 0.05111-0.05426. Since the M-Signal indicator on the 1M chart is passing around 0.03543, if it falls below 0.03543, it's advisable to halt trading and assess the situation. To break above a key point or range and continue the uptrend, the StochRSI, TC, and OBV indicators must show upward trends. If possible, - The StochRSI indicator should not enter the overbought zone. - The TC indicator should remain above zero. - The OBV indicator should remain above the High Line. Currently, the StochRSI indicator has entered the overbought zone, which could limit the upside. To overcome this and continue the uptrend, trading volume must increase explosively. If not, you should look for a sideways movement and see if it tests support. - Thank you for reading. I wish you successful trading. --------------------------------------------------
readCrypto
Next Volatility Period: Around January 1, 2026
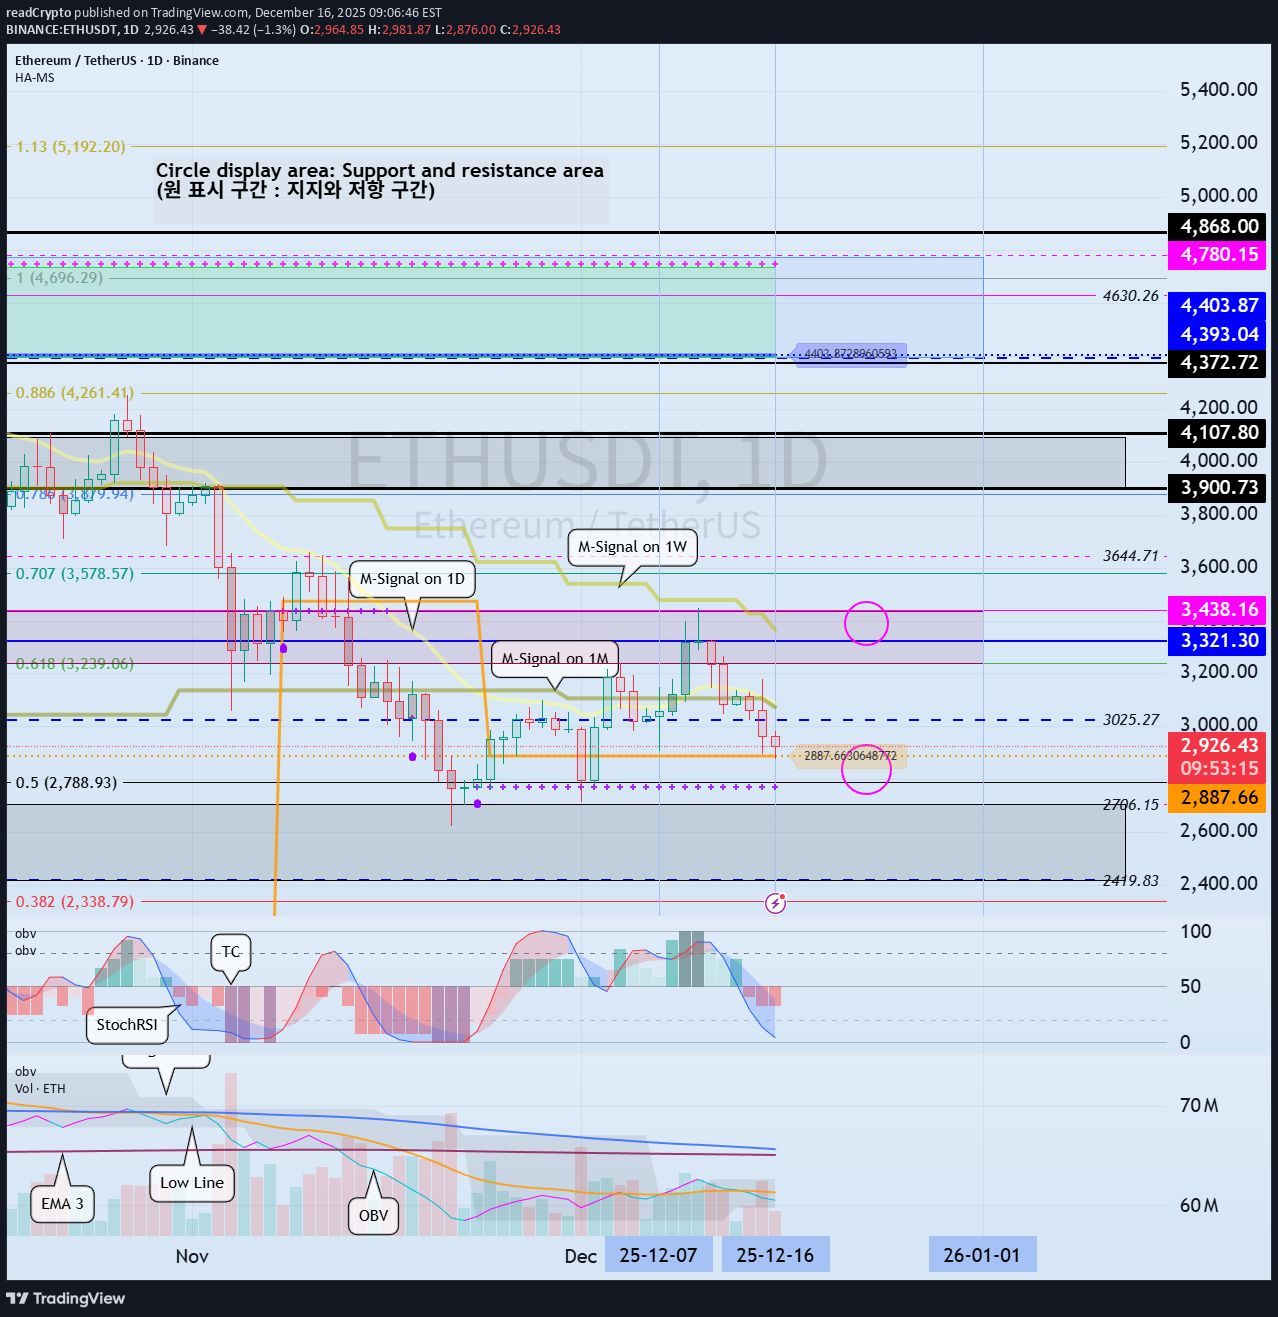
Hello, traders! Follow us to get the latest information quickly. Have a great day! ------------------------------------- (ETHUSDT 1D Chart) This volatility period is expected to last until December 17th. To initiate an uptrend, the price must rise above the M-Signal indicator on the 1M chart and remain stable. In this sense, the key is whether the price can find support near 2887.66 and rise above 3025.27 to maintain its upward momentum. However, a full-scale uptrend is expected to begin only if the price rises above the HA-High ~ DOM (60) range on the 1M chart (3321.30-3438.16). - From a trading perspective, trading below the M-Signal indicator on the 1M chart is difficult, so if possible, it's best to find a trading opportunity around 3025.27 based on the presence of support. In the medium to long term, you can buy in installments whenever support is found near the DOM (-60) ~ HA-Low range. Therefore, the timing for buying in installments is until support is found near 2770.12-2887.66. However, if the price declines from the DOM(-60) to HA-Low range, a step-down trend is likely, so you should consider a countermeasure. In other words, if you bought when the price was supported near the DOM(-60) to HA-Low range, you can sell a portion of your holdings when the price rises and then begins to decline, leaving the coins (tokens) corresponding to the profit. This can be done in installments. - To sustain the uptrend from a long-term perspective, the price must be maintained above 2419.83-2706.15. If this fails and the price declines, a long-term downtrend is likely, so you should consider a countermeasure. There are two types of declines: 1. Normal Decline This occurs when the price rises from the DOM(-60) to HA-Low range, forms the HA-High to DOM(60) range, and then declines. This decline is likely to continue until it reaches the DOM(-60) or HA-Low indicators, making it difficult to gauge the actual extent of the decline. Therefore, during a normal decline, it's difficult to determine the timing of a partial purchase, so caution is advised when making a purchase. However, other indicators and support and resistance levels can be used to estimate the timing. 2. Staircase Decline This refers to a further decline from the DOM(-60) to HA-Low range. Therefore, if the decline continues, the DOM(-60) or HA-Low indicators will eventually be encountered again, allowing for the timing of a partial purchase. However, because it's impossible to predict the frequency of this decline, split trading is necessary. When making a split trade, it's important to increase the number of coins (tokens) corresponding to the profit by engaging in short-term trading (day trading) at each split purchase price. At the same time, you should recover a portion of your principal to secure funds for future split purchases. - Among the declines mentioned above, the moment we should be interested in is when the second step decline occurs. In other words, it's worth considering trading when the DOM(-60) or HA-Low indicators are met. - Thank you for reading to the end. I wish you successful trading. --------------------------------------------------This chart shows a decline from the DOM(-60) to HA-Low range, ultimately forming a stepwise downward trend. At this point, since the price has fallen below the M-Signal indicator on the 1M chart, the first option is to wait without trading. Secondly, if you buy when support is found near the DOM(-60) to HA-Low range, you must sell some of your initial investment to recover your initial investment. Otherwise, if the price declines further, you may not have enough funds to buy, or the purchase volume may be too large, resulting in a high average purchase price. In fact, in the example chart, during the stepwise downward trend, it's difficult to see how the price rose after finding support near the DOM(-60) to HA-Low range. Therefore, there were virtually no opportunities to buy. It's possible that a buy was made when the HA-Low indicator formed at 0.00000 461. This is because the price rose above the M-Signal indicator on the 1D chart. When buying in a step-down trend, it's most important to sell in installments when you've made a profit or when the price falls below your stop-loss point to recover some of your initial investment. If you adhere to these guidelines, you'll likely recover losses more quickly or achieve significant profits.The HA-High ~ DOM(60) range, or the DOM(60) ~ HA-High range, or the range formed by the DOM(60) and HA-High indicators, is a sell zone. Also, the DOM(-60) ~ HA-Low range, or the HA-Low ~ DOM(-60) range, is a buy zone. Therefore, if the price declines from the DOM(60) ~ HA-High range and meets the DOM(-60) or HA-Low indicators, consider it a normal decline and observe how the wave forms again. However, it's better to consider the HA-Low indicator as a trading point rather than the DOM(-60) indicator. Looking at the current example chart, the DOM(-60) indicator is close to the current price level, while the HA-Low indicator is formed at a low price. Therefore, when the price rises above the DOM(-60) indicator, you should check whether the HA-Low indicator is generated to identify the support zone and determine the timing of a trade. If the price falls below the DOM(-60) indicator, there's a possibility of a further decline until the HA-Low indicator is met. Therefore, you should follow a segmented buying strategy during a stepwise downtrend. Since the price is maintained above the M-Signal indicator on the 1M chart, you can trade with less pressure.#ETHUSDT It's showing a normal downtrend, falling from the HA-High to DOM(60) range. We can resume trading when we meet the DOM(-60) or HA-Low indicators. However, if it falls below the 2419.83-2706.15 range, there's a possibility of a long-term downtrend. Therefore, if it falls below the 2419.83-2706.15 range, we should stop trading and observe the movement. This means that the 2419.83-2706.15 range represents an important support area. Therefore, if support is found in this area, we expect it to rise above the 3321.30-3438.16 range. The key question is whether the price can rise after finding support in the 2770.12-2887.66 range. The next volatility period is around January 1, 2026, but since BTC's volatility period is around December 23, we need to monitor the movement at that time. - The price must remain above the M-Signal indicator on the 1M chart to maintain a high probability of continuing the uptrend. If not, a long-term downtrend is likely, so profit taking is necessary. However, the actual trading timing may vary depending on the support area formed around the M-Signal indicator on the 1M chart. In other words, the M-Signal indicator on the 1M chart is currently hovering around 3025.27, but the key support and resistance zone is 2419.83-2706.15. Therefore, the final target range is 2419.83-2706.15. BTC and ETH are coins that can be held for the long term. Therefore, they are coins that can be purchased at any time as long as you have the necessary capital. If you don't have enough capital, it's best to sell some of your coins to secure cash and then buy them again when a favorable opportunity arises. However, the StochRSI indicator is currently in an oversold zone, making it an awkward time to sell. Therefore, the only option now is to buy more when support is found.
readCrypto
The key is whether it can rise above 0.2851
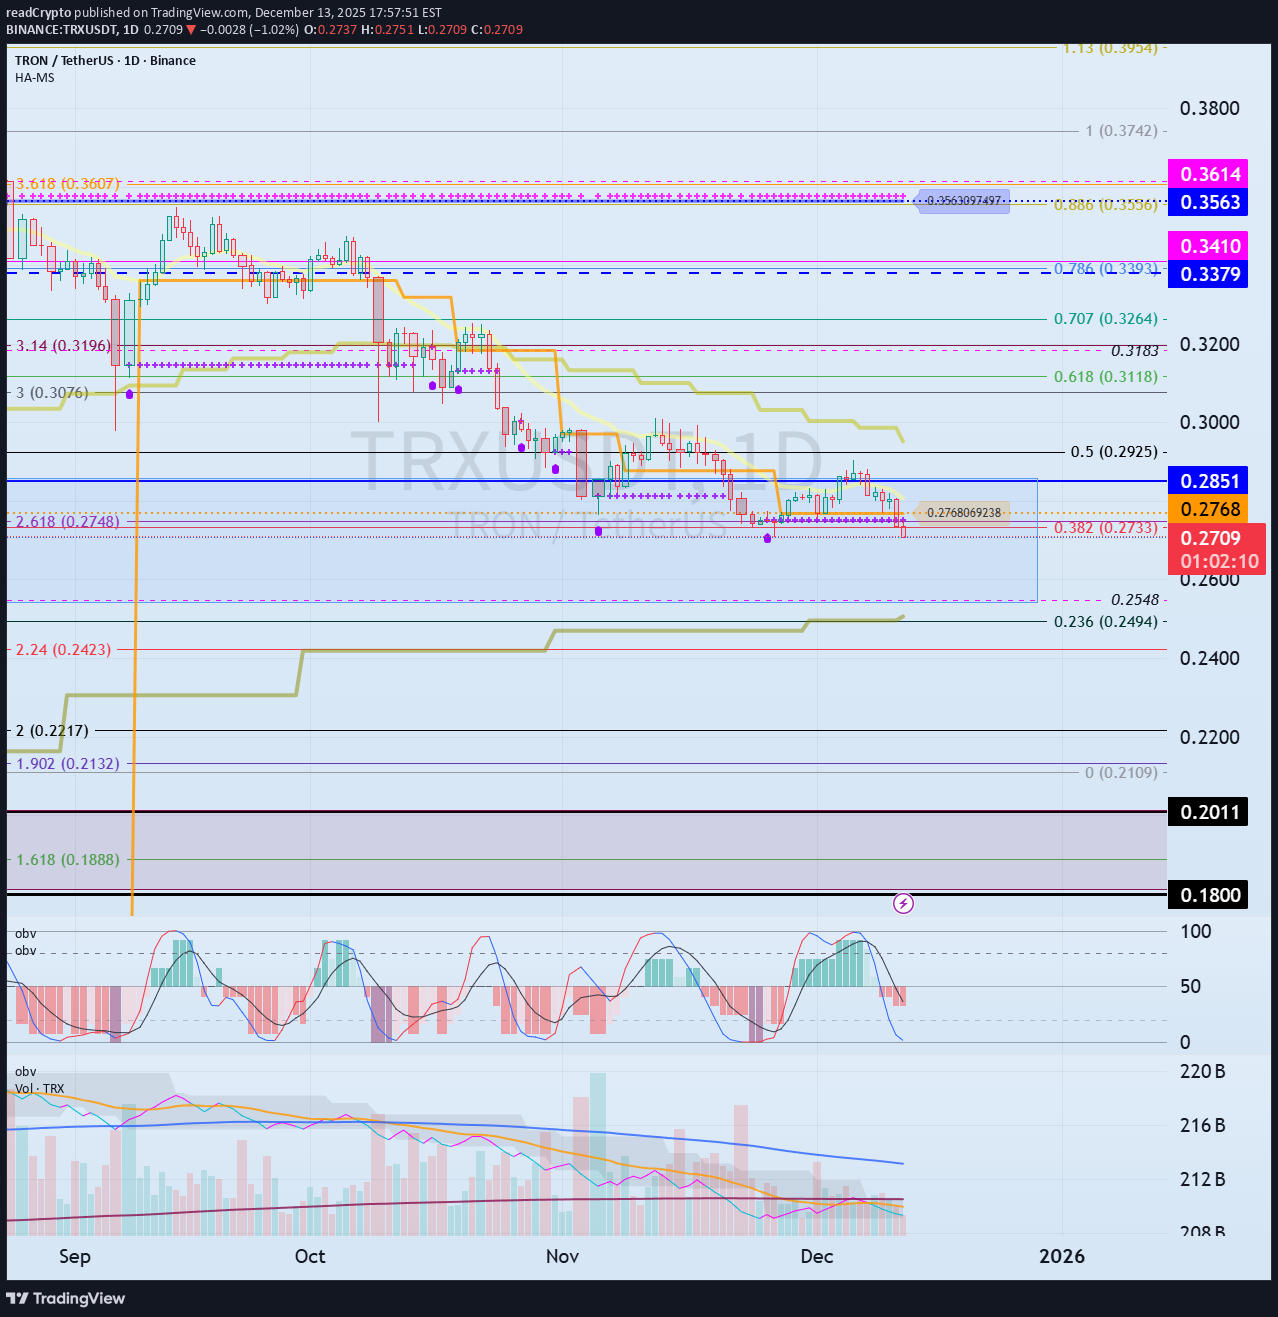
Hello, fellow traders! Follow us to get the latest information quickly. Have a great day. ------------------------------------- (TRXUSDT 1M Chart) From a long-term perspective, the price needs to remain above 0.18-0.2011 to continue the uptrend. If it encounters resistance at 0.2851 and declines, we should check for support near the M-Signal indicator on the 1M chart. If further declines occur, support around 0.18-0.2011 will be crucial. - (1W chart) Looking at the 1W chart, we should examine whether it finds support near 0.2548-0.2851 and can rise. If it finds support near 0.2548-0.2851 and rises, the key question is whether it can break above the 0.3379-0.3614 range. - (1D chart) Therefore, 1st: 0.2548-0.2851 2nd: 0.18-0.2011 When support is found near the 1st and 2nd levels above, it indicates a period of partial buying. It is falling below the HA-Low indicator, showing a stepwise downward trend. Therefore, you should consider either waiting for the stepwise downward trend to stop or increasing the number of coins (tokens) that can be profited through day trading. - Thank you for reading to the end. I wish you successful trading. --------------------------------------------------
readCrypto
آغاز موج صعودی قوی: آیا قیمت از مرز 2.1446 عبور میکند؟
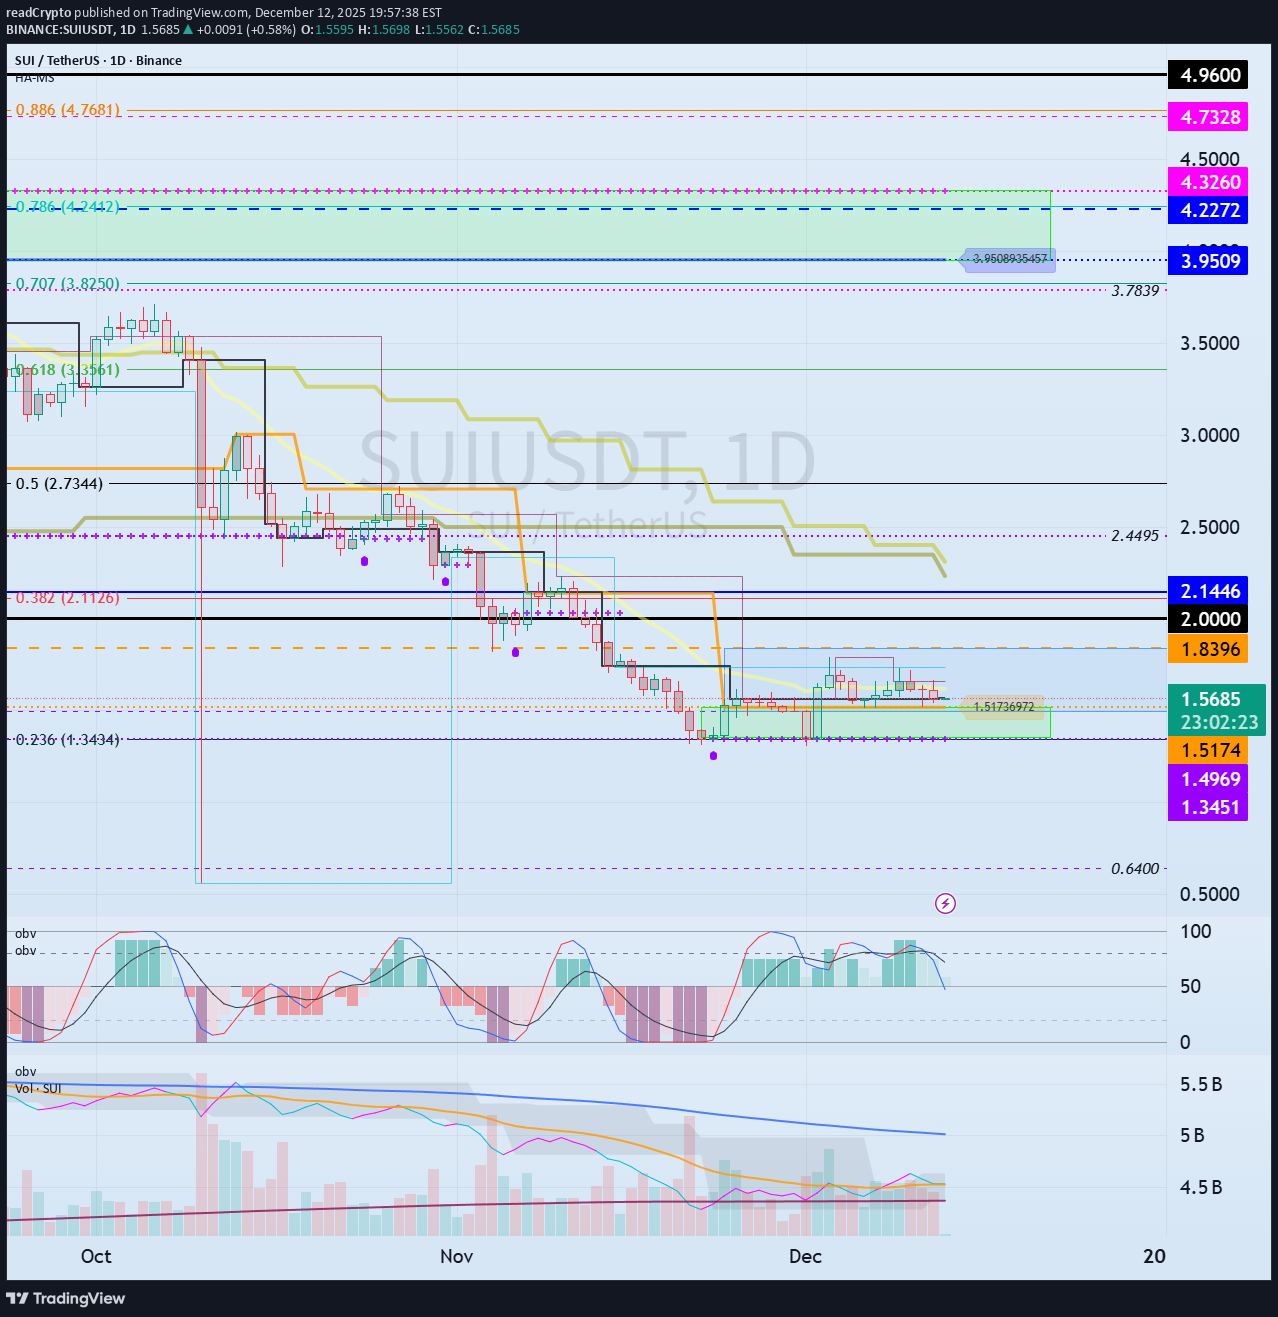
Hello, traders! Follow us to get the latest information quickly. Have a great day! ------------------------------------- (SUIUSDT 1M chart) To continue the uptrend, the price must rise above the M-Signal indicator on the 1M chart and hold. Accordingly, the key question is whether the price can rise above the 2.0-2.1446 range and maintain its upward momentum. If the upward movement fails, we should observe whether the M-Signal indicator on the 1M chart moves sideways until it declines near the Fibonacci level of 0.236 (1.3434). - (1W chart) The key question is whether the price can find support and rise near the newly forming DOM (-60) ~ HA-Low range (1.4969-1.8396). Based on the basic trading strategy, the target range is around the 4.2272-4.7328 range. However, caution is advised when trading, as the price is currently forming below the M-Signal indicator on the 1M chart. Therefore, I think it's best to start trading after confirming whether the price rises to around 2.0-2.1446 and maintains its strength. - (1D Chart) When analyzing charts, it's best to observe the movements of the 1D chart as a basic trading strategy. This is because most indicators are derived from the 1D chart. In this sense, the key is whether the price can find support and rise around the 1.3451-1.5174 range, which is the DOM(-60) ~ HA-Low range on the 1D chart. As mentioned earlier, to sustain the uptrend from a long-term perspective, the price must remain above the M-Signal indicator on the 1M chart. Therefore, the current price level is not suitable for trading. A decline in the DOM(-60) ~ HA-Low range could lead to a step-down trend. This means that the price is renewing its low, but it can also be considered a time for a split buy. Therefore, you should consider how to execute a split buy before starting a trade. If the price rises from the DOM(-60) to HA-Low range, the HA-High to DOM(60) range will form. Therefore, if you bought near the DOM(-60) to HA-Low range, you should sell near the HA-High to DOM(60) range. However, if the price rises from the HA-High to DOM(60) range, it's likely to form a step-up trend, so it's recommended to sell in steps. As mentioned earlier, a step-up trend, like a step-down trend, means that the price is renewing its high. Therefore, since a sharp decline is possible at any time, it's advisable to sell in steps at the appropriate time to secure profits. - In summary, if you encounter the DOM(-60) or HA-Low indicators, you should focus on finding the right time to buy and consider how to execute the split purchase. Furthermore, if you encounter the DOM(60) or HA-High indicators, you should focus on finding the right time to sell and consider how to execute the split purchase. This is the basic trading strategy. If not, and you buy when the HA-High ~ DOM(60) range supports and rises, or sell when the DOM(-60) ~ HA-Low range resists and falls, it's best to maintain your stop loss. - Thank you for reading to the end. I wish you successful trading. --------------------------------------------------
readCrypto
آیا BATUSDT از حمایت ۰.۲۵۵۸ رالی میکند؟ شانس صعود تا ۰.۸۳۵۷!
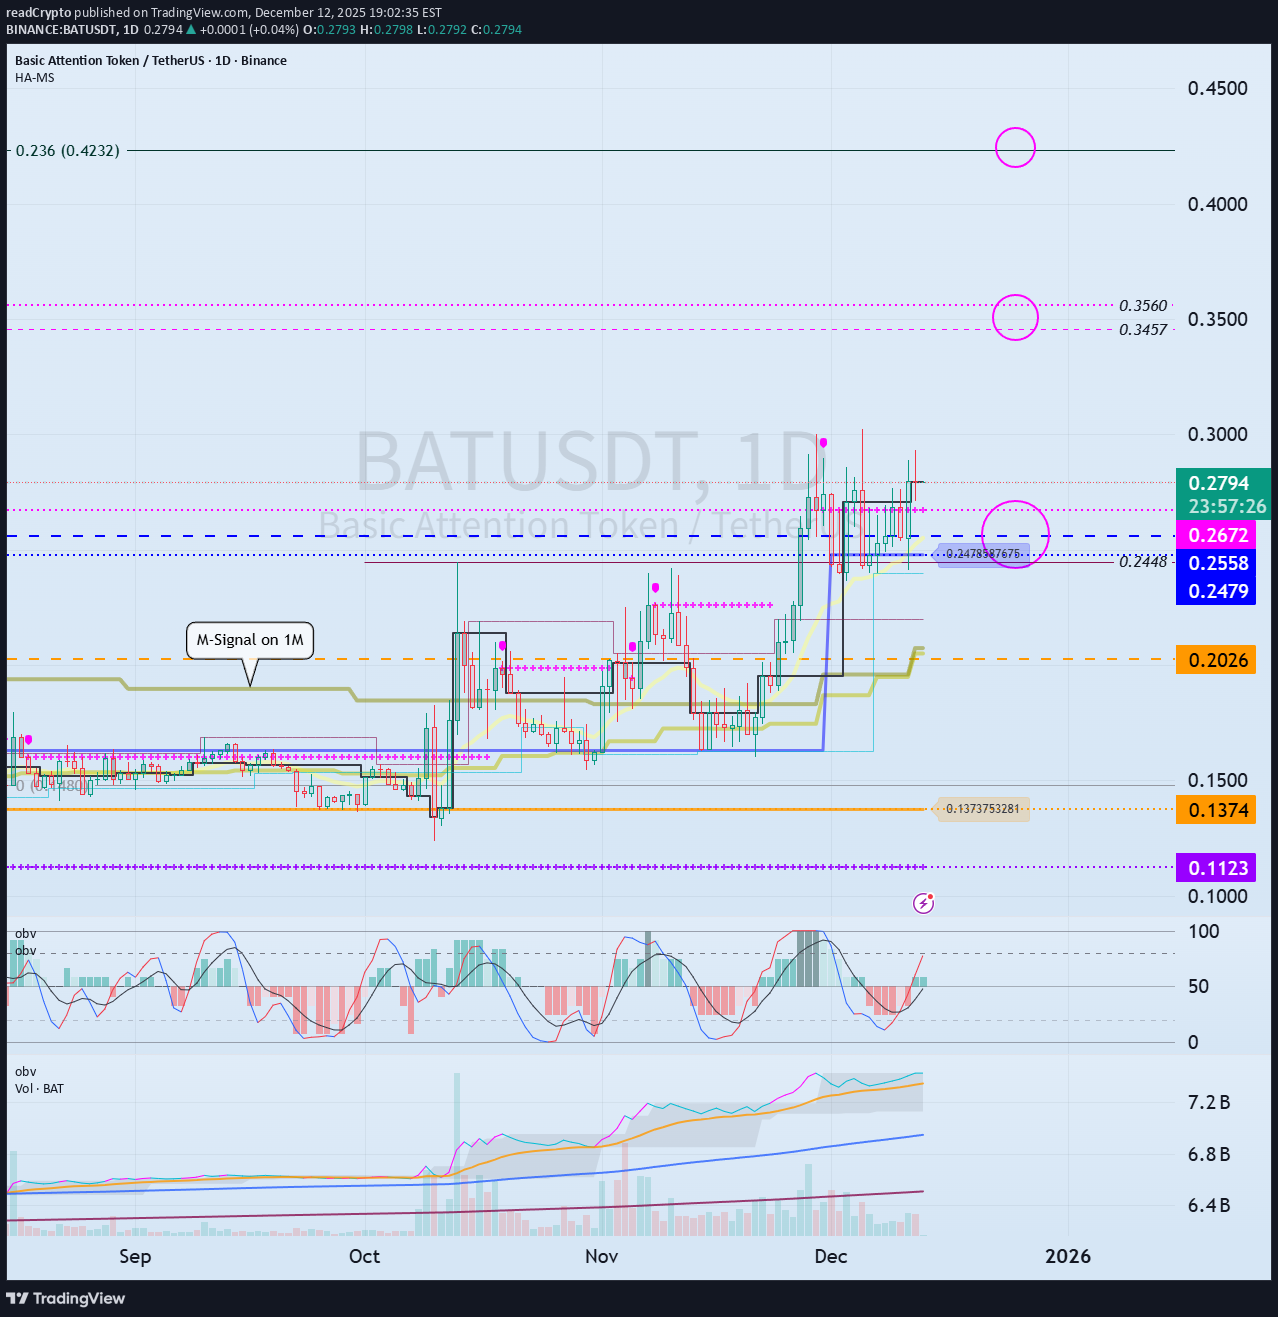
Hello, fellow traders! Follow us to get the latest updates quickly. Have a great day! ------------------------------------- (BATUSDT 1M Chart) After a significant decline, the price is forming a close above the M-Signal indicator on the 1M chart. Accordingly, if the price remains above the M-Signal indicator on the 1M chart, the long-term uptrend is expected to continue. Since the StochRSI 80 indicator is forming at 0.2448, we should examine whether it finds support near this level and can rise. A full-scale uptrend is likely to begin when it rises above the Fibonacci level of 0.236 (0.4232). If a full-scale uptrend begins, the target point is around 0.8357. - (1D chart) Therefore, the key question is whether it can find support near the 0.2479-0.2672 range and rise above 0.3457-0.3560. If it declines, we should examine whether support is found near the M-Signal indicator on the 1M chart. Therefore, support around 0.2026 is crucial. - Thank you for reading to the end. I wish you successful trading. --------------------------------------------------
readCrypto
Strong Support and Resistance Area: 533.90-793.86
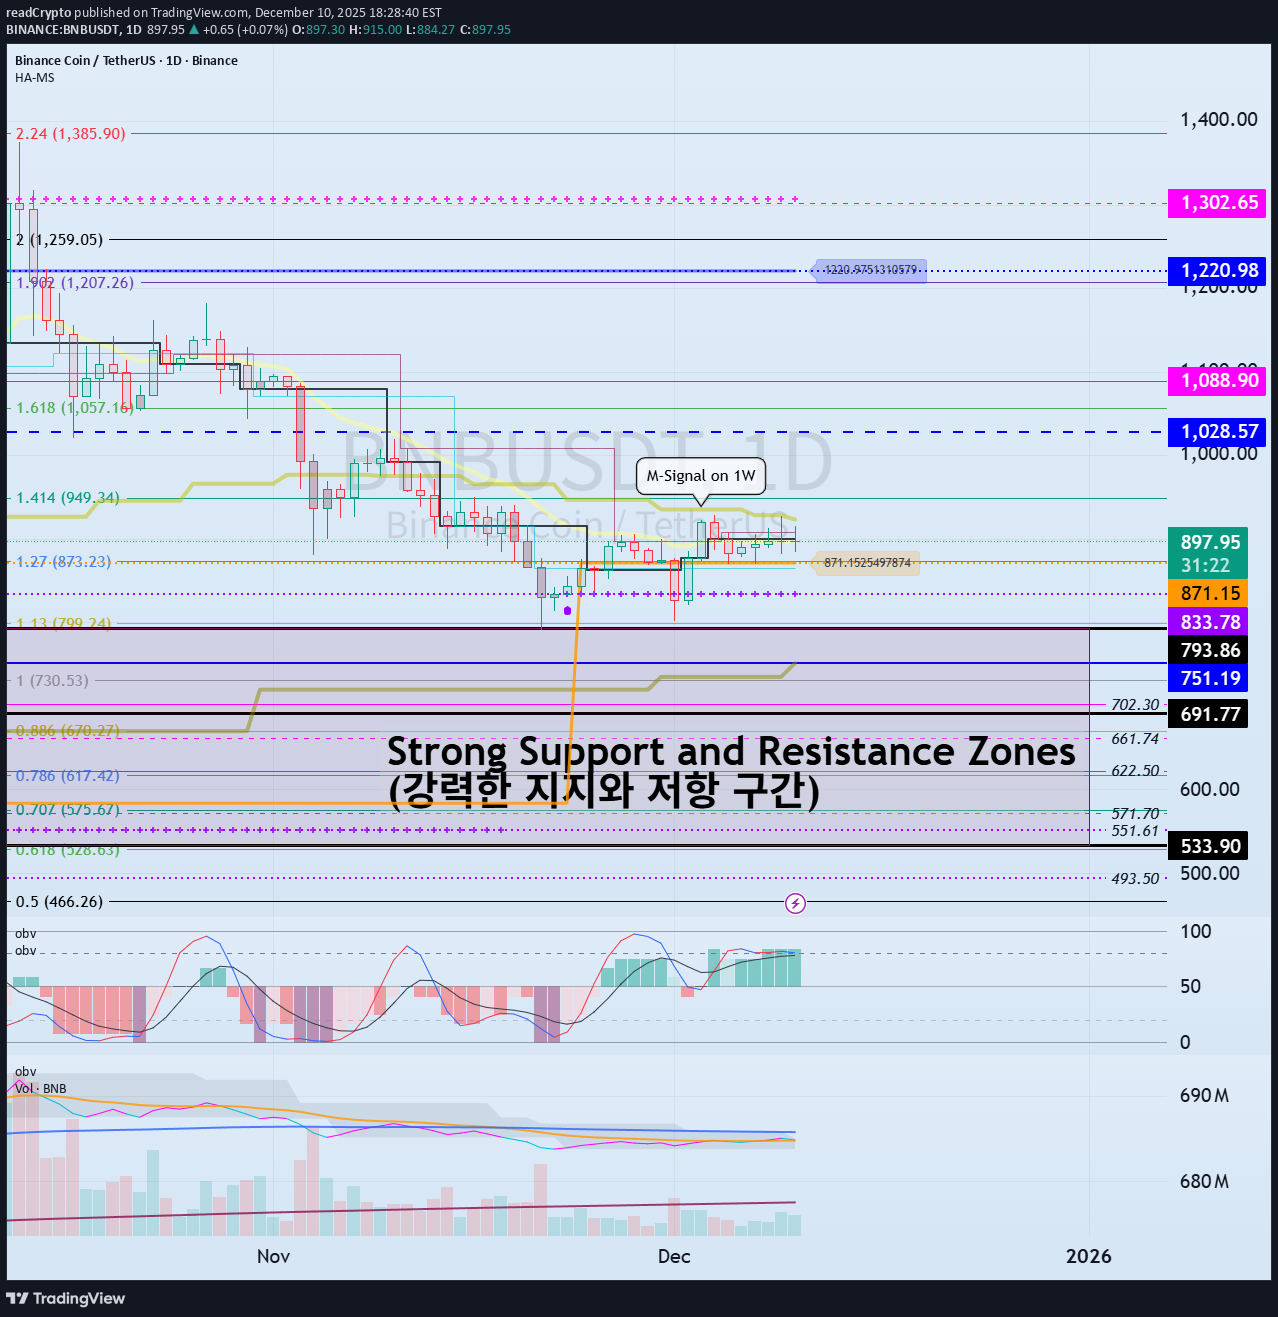
Hello, fellow traders! Follow us to get the latest information quickly. Have a great day! ------------------------------------- (BNBUSDT 1D Chart) The 533.90-793.86 area is a strong support and resistance area. A decline below this area is highly likely to trigger a long-term downtrend. Therefore, if support is found around the 533.90-793.86 range, it would be a buying opportunity. Since the HA-Low indicator formed at 871.15, if support is found around the 833.78-871.15 range, this would also be a buying opportunity. Resistance levels are: 1st: 1028.57-1088.90 2nd: 1220.98-1302.65 The first and second levels above are resistance levels. - If the price holds above 793.86, it is expected to rise to around the circled range shown on the chart above. BNB should be traded differently from BTC or ETH. In other words, while you can continue to invest in BTC and ETH to purchase them, you should hold altcoins like BNB, XRP, and SOL by increasing the number of coins that represent profits. Therefore, if the price rises after purchasing, you should sell the original purchase amount, leaving only the number of coins that represent profits. This is because in a bear market, the price drops more sharply than expected. BTC and ETH also show significant declines during bear markets, similar to altcoins. However, they tend to rebound faster than altcoins, allowing for continued investment and purchase. However, to stabilize your psychological state, it's important to take some profits while you're in profit. - Thank you for reading to the end. I wish you successful trading. --------------------------------------------------
readCrypto
Next Volatility Period: Around December 23rd
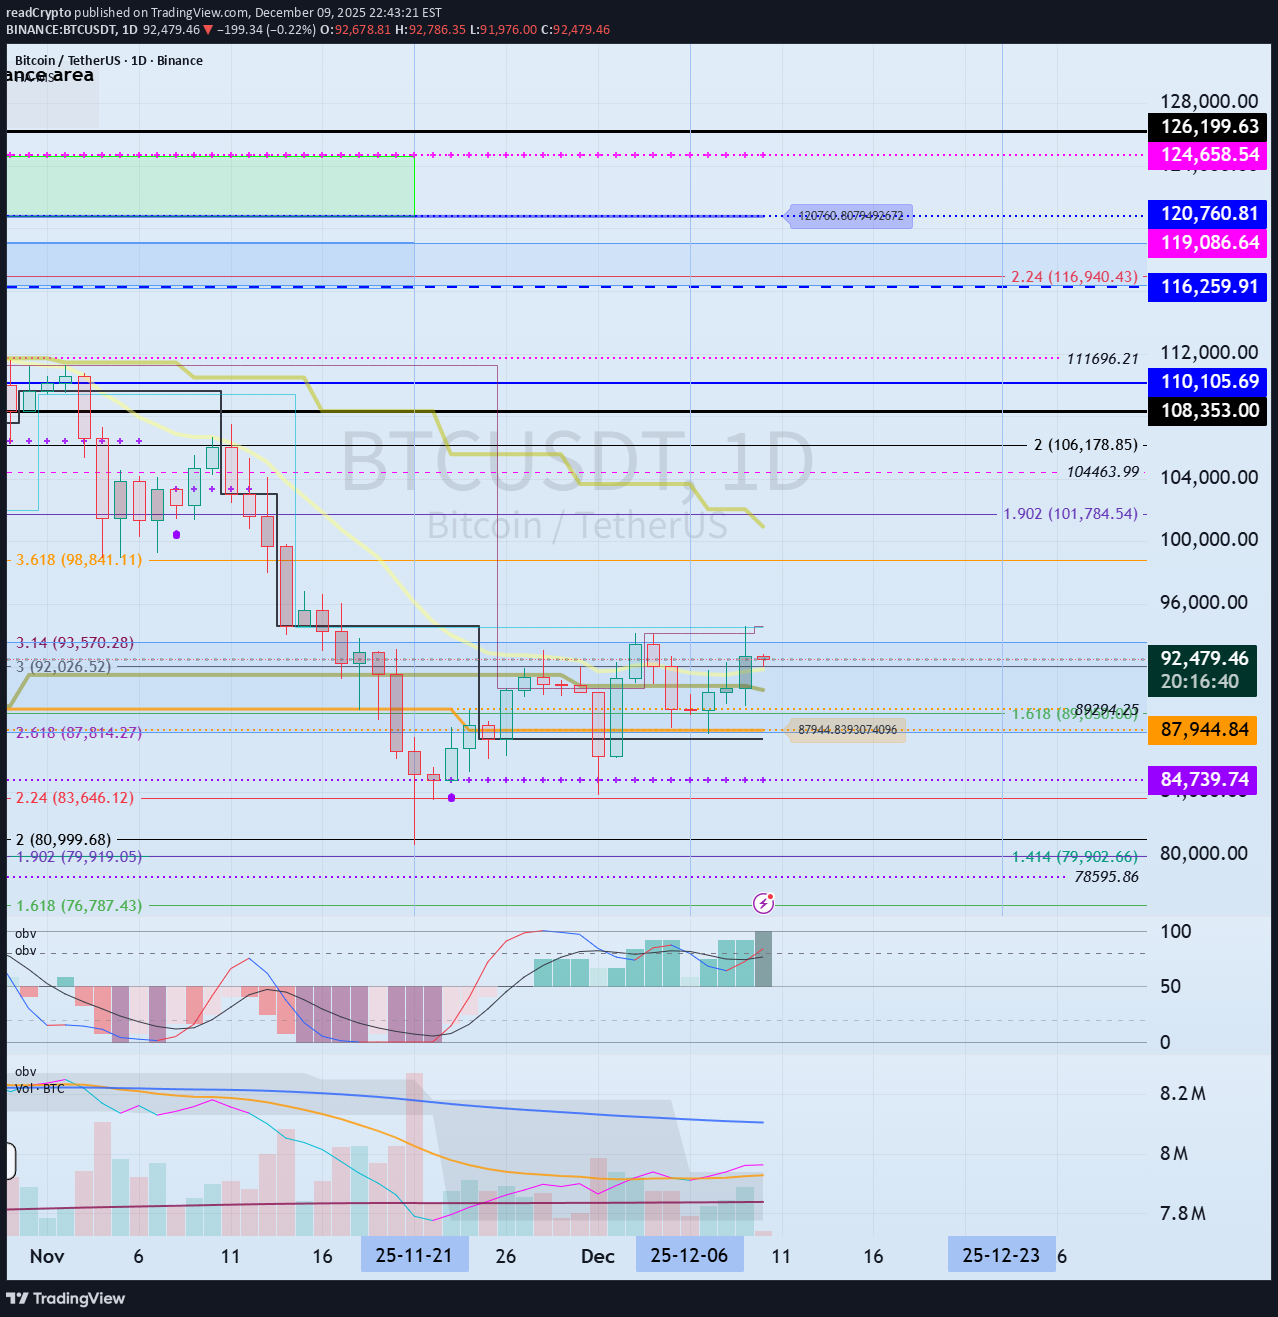
Hello, fellow traders! Follow us to get the latest updates quickly. Have a great day! ------------------------------------- #BTCUSDT To initiate a bullish trend, the price must rise above and sustain the OBV Low indicator level. Considering the basic trading strategy of buying around DOM(-60) ~ HA-Low and selling around HA-High ~ DOM(60), the current price position represents a buying opportunity. However, if the price falls between DOM(-60) and HA-Low, a stepwise downward trend is likely, so you should consider a response plan. If the price falls below the DOM(-60) indicator, you should check for support around the 69000-73499.86 level. This is because the 69000-73499.86 level represents an important support and resistance zone for sustaining an uptrend from a long-term perspective. If the price declines from the 69,000-73,499.86 range, it is expected to form an uptrend around 42,000, a level never seen again. - If the price rises above the OBV Low indicator level and continues its upward trend, we should check for an upward breakout near the area circled on the chart. If the price fails to break out, we should consider a response plan, as this could signal a full-blown bear market. If the price continues to rise, the target levels are: - Right Fibonacci ratio 2.618 (133,889.92) - Right Fibonacci ratio 3 (151,018.77) ~ 3.14 (157,296.36) It is expected to re-establish the trend by rising near the above range. The coin market is likely to experience a major bear market around the week of January 26, 2026. - Thank you for reading. I wish you successful trading. -------------------------------------------------- - Here's an explanation of the big picture. (3-year bull market, 1-year bear market pattern) I will explain more in detail when the bear market begins. ------------------------------------------------------#BTCUSDT The key is whether the price can find support and rise in the 84739.74-87944.84 range. An uptrend reversal is expected when the price rises above the left Fibonacci level of 3.14 (93570.28). If the price falls below 84739.74, it is likely to fall to the 69000-73499.86 range. This is because the OBV indicator is expected to fall below the Low Line and EMA 3, indicating a strong sell-off. However, given the formation of the HA-Low indicator, we should focus on finding the right time to buy in installments.
readCrypto
رمزگشایی آینده ZECUSDT: آیا قیمت میتواند از 422.80 عبور کند؟
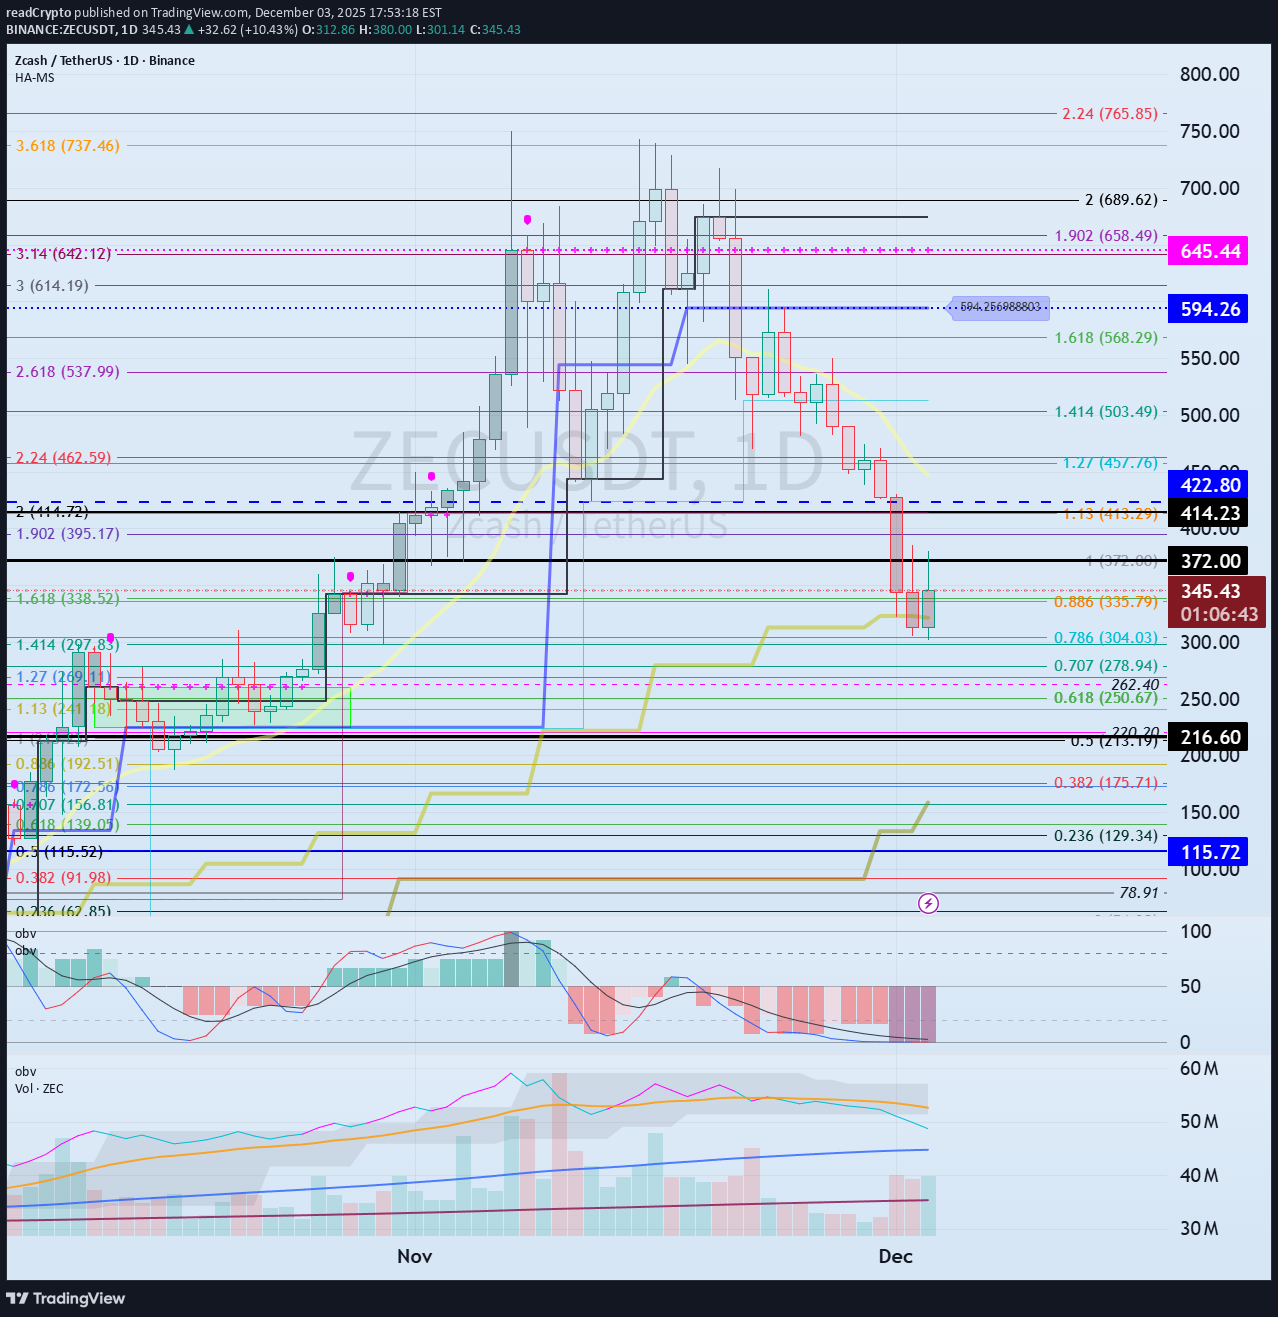
Hello? Hello, traders. If you "Follow" us, you'll always get the latest information quickly. Have a great day. ------------------------------------- (ZECUSDT 1D Chart) After a sharp rise, the price is showing a sharp decline. The key to a bullish turn is whether the price can rise above 422.80 and hold. If the uptrend fails, we need to check for support around 216.60. If it falls below 216.60, it's likely to take time to rise again. Although the price is showing a short-term downtrend, falling below the M-Signal indicator on the 1D chart, it should be considered an ongoing uptrend because the M-Signal indicator on the 1D chart > M-Signal on the 1W chart > M-Signal on the 1M chart is arranged in this order. Therefore, if the M-Signal indicator on the 1W chart declines, consider whether it can find support near the M-Signal indicator on the 1M chart and consider a response plan. Therefore, the movement when the price falls to around 216.60 is crucial. There is a possibility that the price will rise above the OBV High indicator, sustaining the price and indicating further upward movement. However, since the OBV Low indicator is still above the OBV High indicator, a sideways movement seems likely. - Thank you for reading to the end. We wish you successful trading. --------------------------------------------------
readCrypto
پیشبینی تکانههای بزرگ بازار ارز دیجیتال: تاریخ حساس و سطوح خرید و فروش حیاتی!
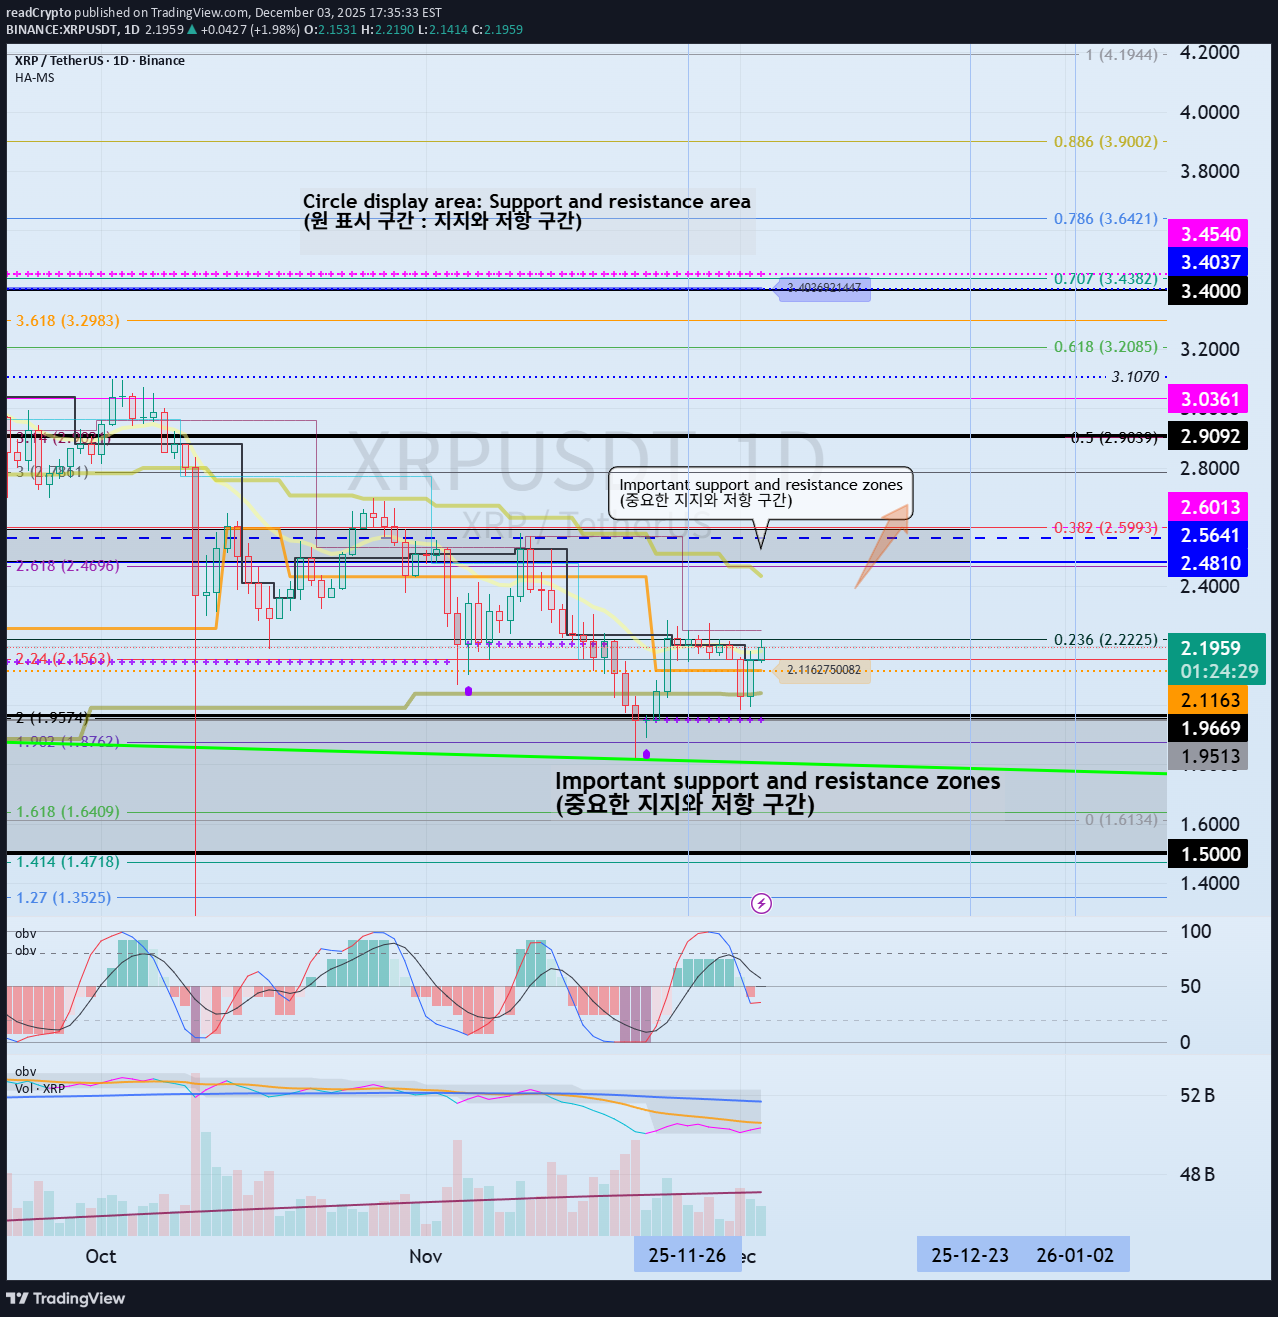
Hello? Hello, traders. If you "Follow" us, you'll always get the latest information quickly. Have a great day. ------------------------------------- (XRPUSDT 1D Chart) I believe the expected uptrend will continue when the price rises above 2.4810-2.6013. Therefore, the final buy zone is the 2.4810-2.6013 zone. If the price falls below the 1.5-19669 zone, a long-term downtrend should be considered. Therefore, if support is found around the 1.5-19669 zone, it would be a good time to buy from a long-term perspective. As it's difficult to determine the support level on a 1D chart alone, the StochRSI 80 and 20 indicators on the 1M chart are marked. Therefore, the 1.8209-1.9575 range should be considered the support level for a continued uptrend. If the price rises above the OBV High indicator and holds, further upside is likely. However, it must break above the M-Signal indicator on the 1W chart. - Thank you for reading. We wish you successful trading. --------------------------------------------------
readCrypto
رمز عبور صعود بیت کوین کش: آیا از محدوده حیاتی ۶۱۶ دلار عبور میکند؟
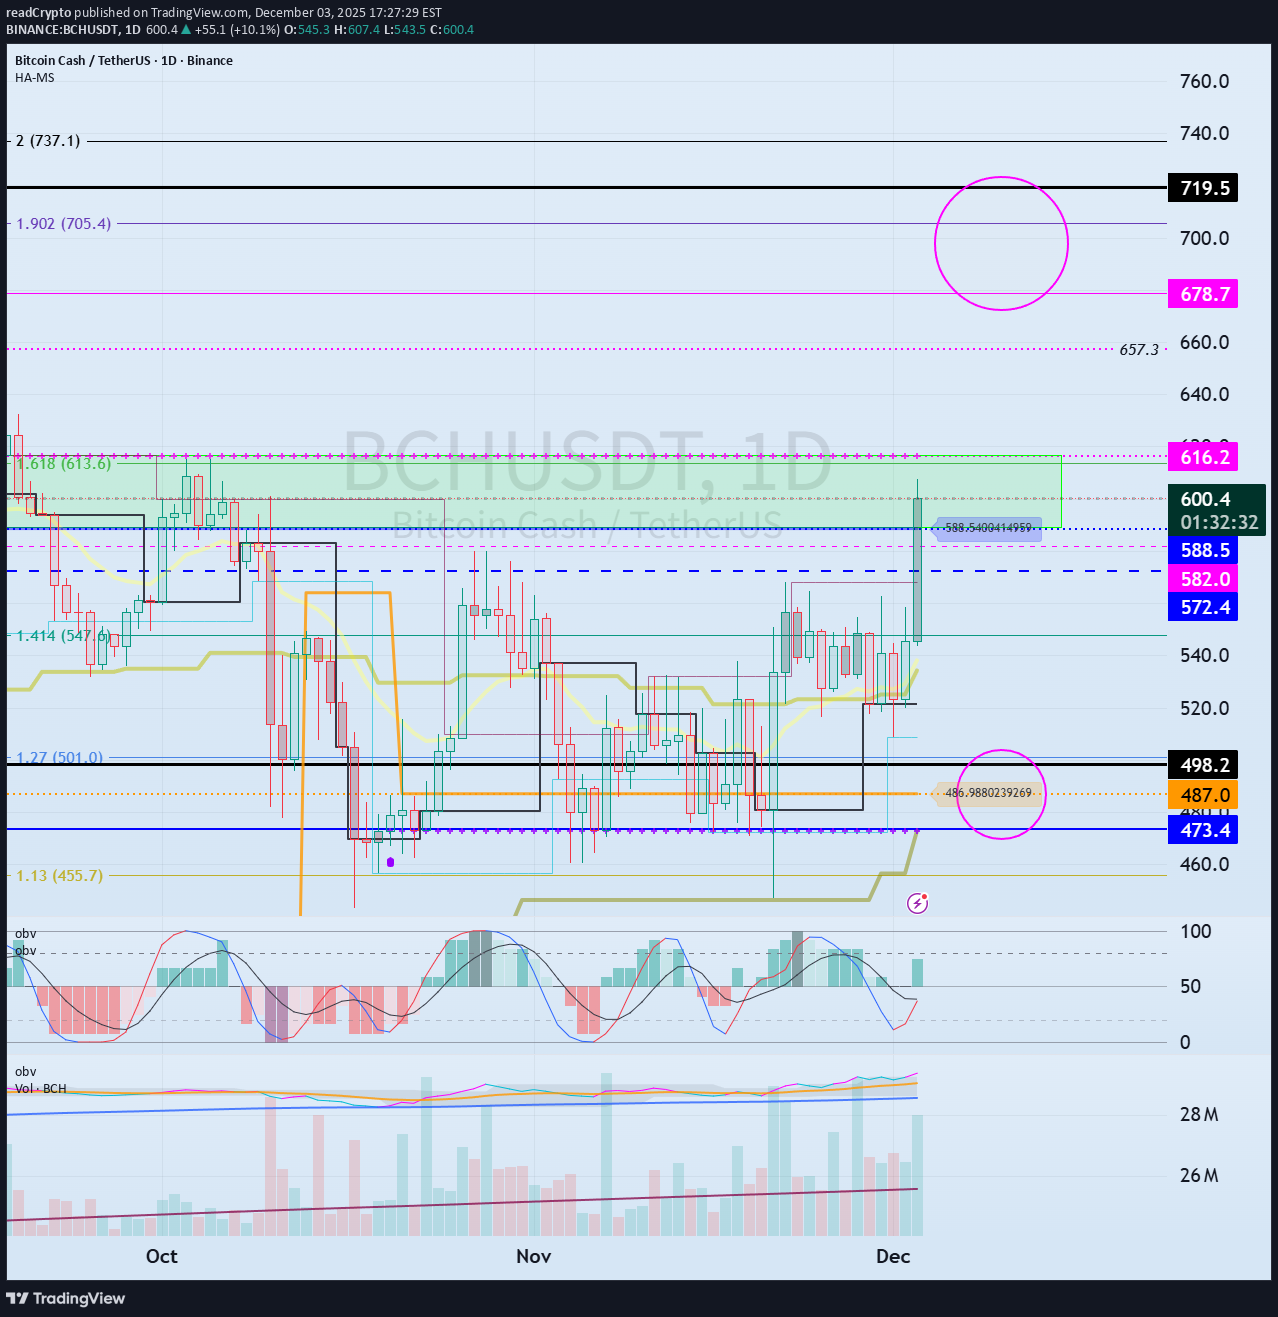
Hello, traders! Follow us to get the latest information quickly. Have a great day. ------------------------------------- (BCHUSDT 1D chart) The 1D chart is rising towards the HA-High ~ DOM (60) range, raising expectations for a bullish trend. Accordingly, the key question is whether the 588.5-616.2 range can be supported and the price can rise. If it rises, we should examine whether it can break above the 678.7-719.5 range, which is the range formed by the DOM (60) indicator on the 1M chart and the previous high. To continue the uptrend by breaking above key points or ranges, the StochRSI, TC, and OBV indicators must show upward trends. If possible, - The StochRSI indicator should not have entered an overbought zone. - The TC indicator should remain above zero. - The OBV indicator should remain above the High Line. Therefore, we should examine the movements of the StochRSI, TC, and OBV indicators when the price rises above the DOM (60) indicator. If the StochRSI falls below 80, it's considered a stop loss, as further declines are likely. - Thank you for reading. We wish you successful trading. --------------------------------------------------
Disclaimer
Any content and materials included in Sahmeto's website and official communication channels are a compilation of personal opinions and analyses and are not binding. They do not constitute any recommendation for buying, selling, entering or exiting the stock market and cryptocurrency market. Also, all news and analyses included in the website and channels are merely republished information from official and unofficial domestic and foreign sources, and it is obvious that users of the said content are responsible for following up and ensuring the authenticity and accuracy of the materials. Therefore, while disclaiming responsibility, it is declared that the responsibility for any decision-making, action, and potential profit and loss in the capital market and cryptocurrency market lies with the trader.