
SUN
Sun (New)
| تریدر | نوع سیگنال | حد سود/ضرر | زمان انتشار | مشاهده پیام |
|---|---|---|---|---|
 DragonCaoBRank: 2773 | خرید | حد سود: تعیین نشده حد ضرر: تعیین نشده | 12/14/2025 | |
 BullBearBTC1Rank: 31226 | خرید | حد سود: تعیین نشده حد ضرر: تعیین نشده | 12/15/2025 | |
 Alpha-GoldFXRank: 32114 | خرید | حد سود: تعیین نشده حد ضرر: تعیین نشده | 12/13/2025 |
Price Chart of Sun (New)
سود 3 Months :
سیگنالهای Sun (New)
Filter
Sort messages by
Trader Type
Time Frame
BullBearBTC1
تحلیل بلندمدت SUN/USDT: نقاط ورود دقیق و سطوح سود (1R و 2R)
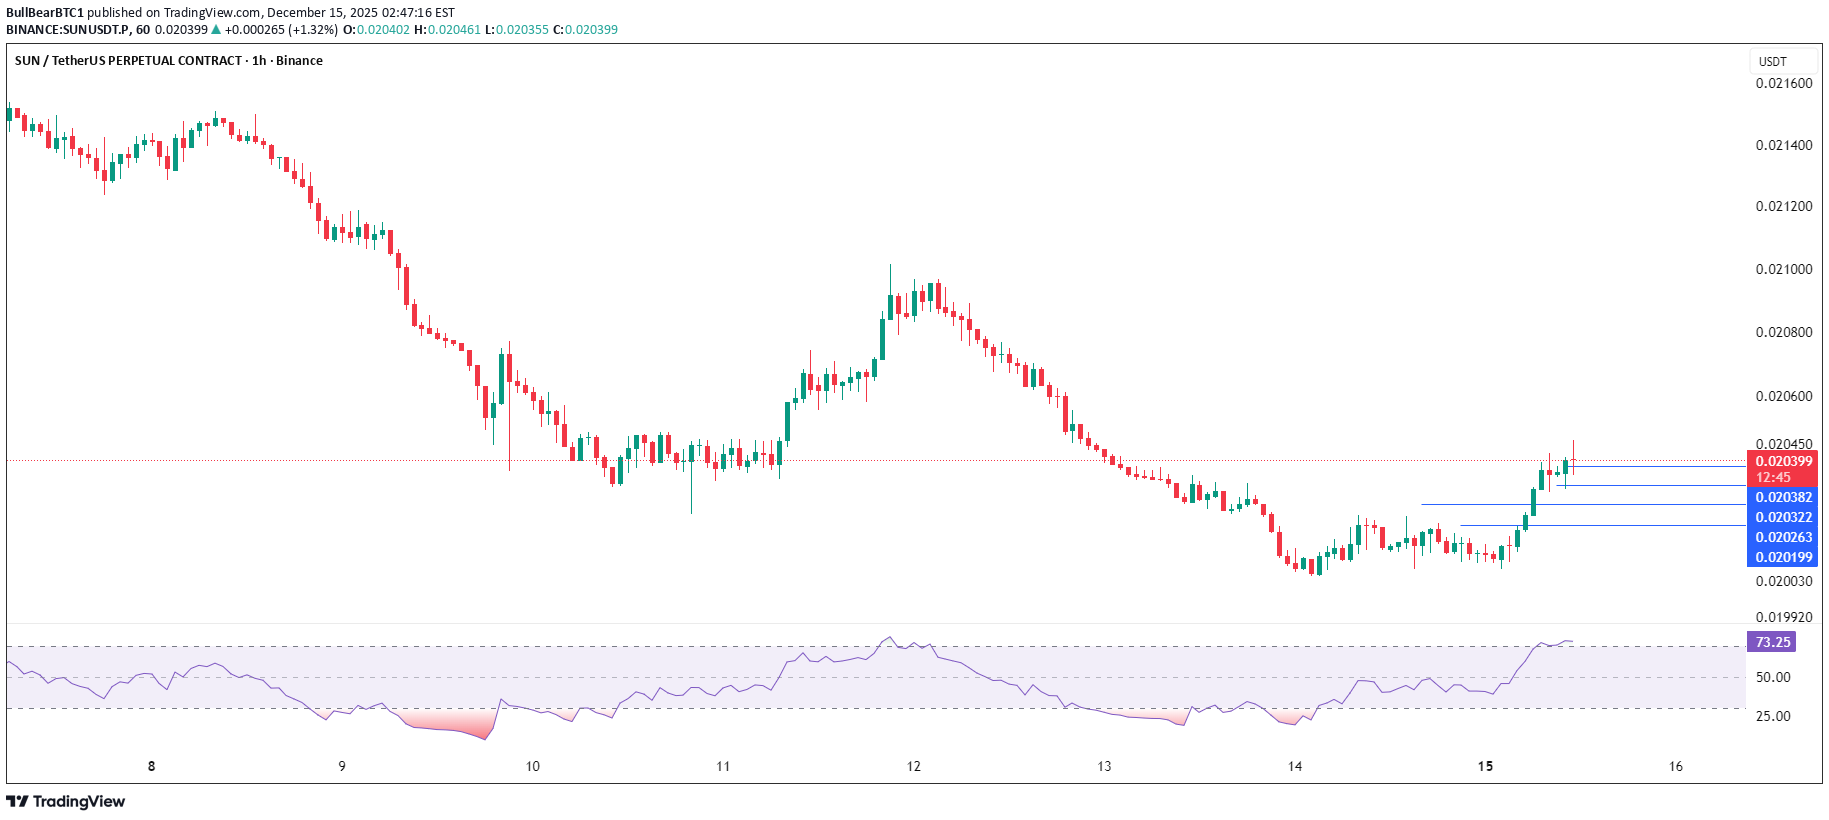
pull back entry. Invalid if make a new high Long idea with entries mentioned on the chart. 1R and 2R trade
DragonCaoB
سیگنال خرید قوی: خورشید (SUN) در آستانه انفجار صعودی! (تحلیل تکنیکال)
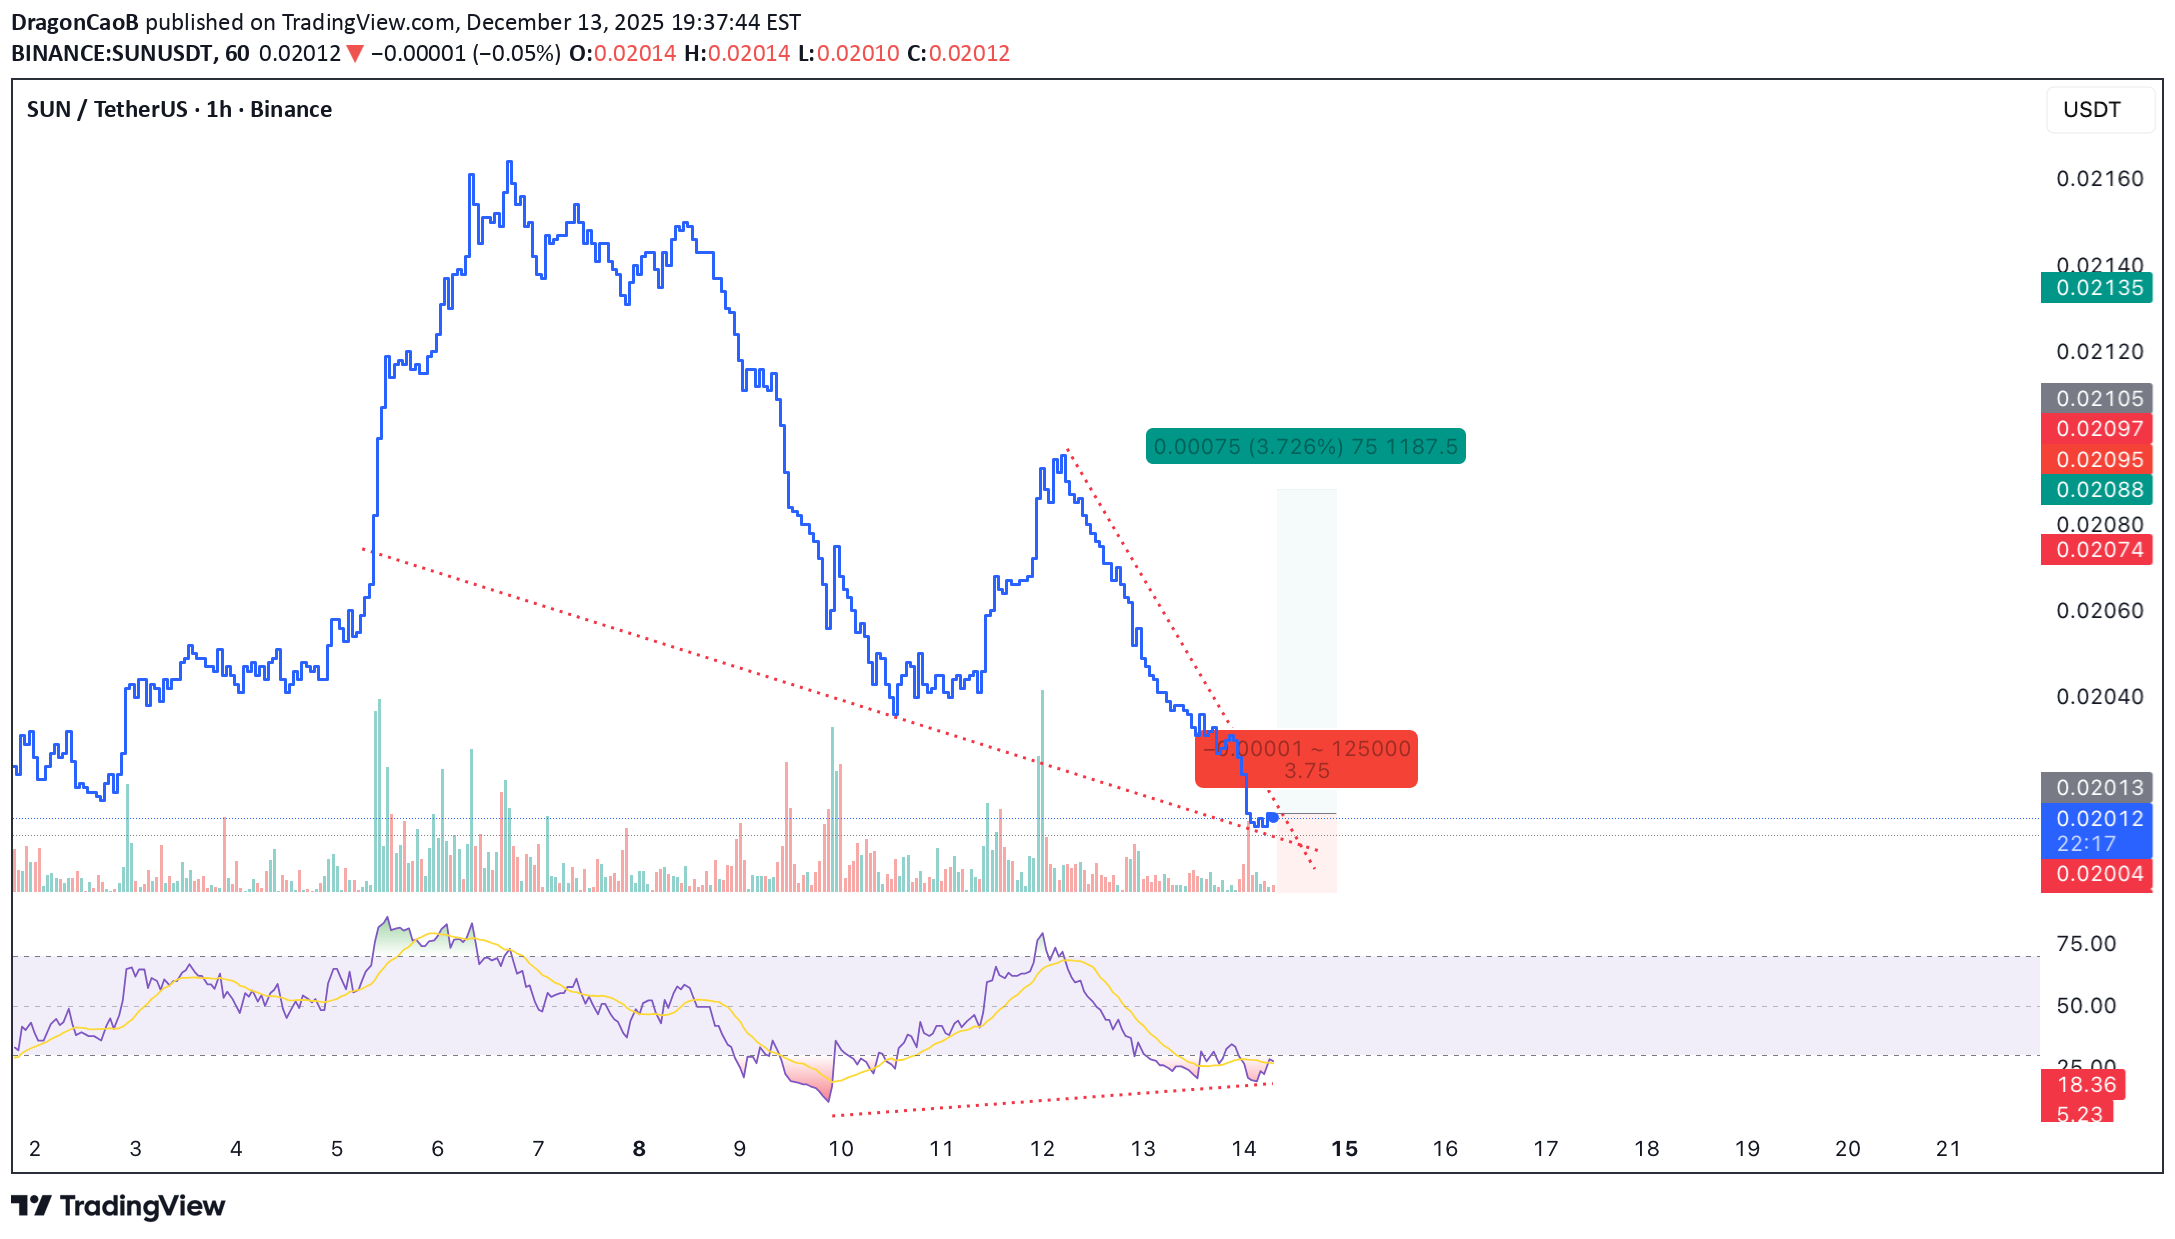
🐂 Scalp LONG – SUN SUN is deeply oversold on the 1h timeframe, signaling exhaustion on the sell side. Price action is compressing and approaching a classic breakout structure, suggesting momentum is building for a sharp upside expansion. A strong bullish breakout is anticipated. 🎯 TP: 0.02088 🛡️ SL: 0.01993 📊 RR: 1 : 3.75 A high-quality long setup: 1h oversold conditions + breakout structure → strong rebound potential with attractive risk-to-reward.
Alpha-GoldFX
سیگنال صعودی بزرگ در SUNUSDT: منتظر جهش ۵۰ درصدی باشید!
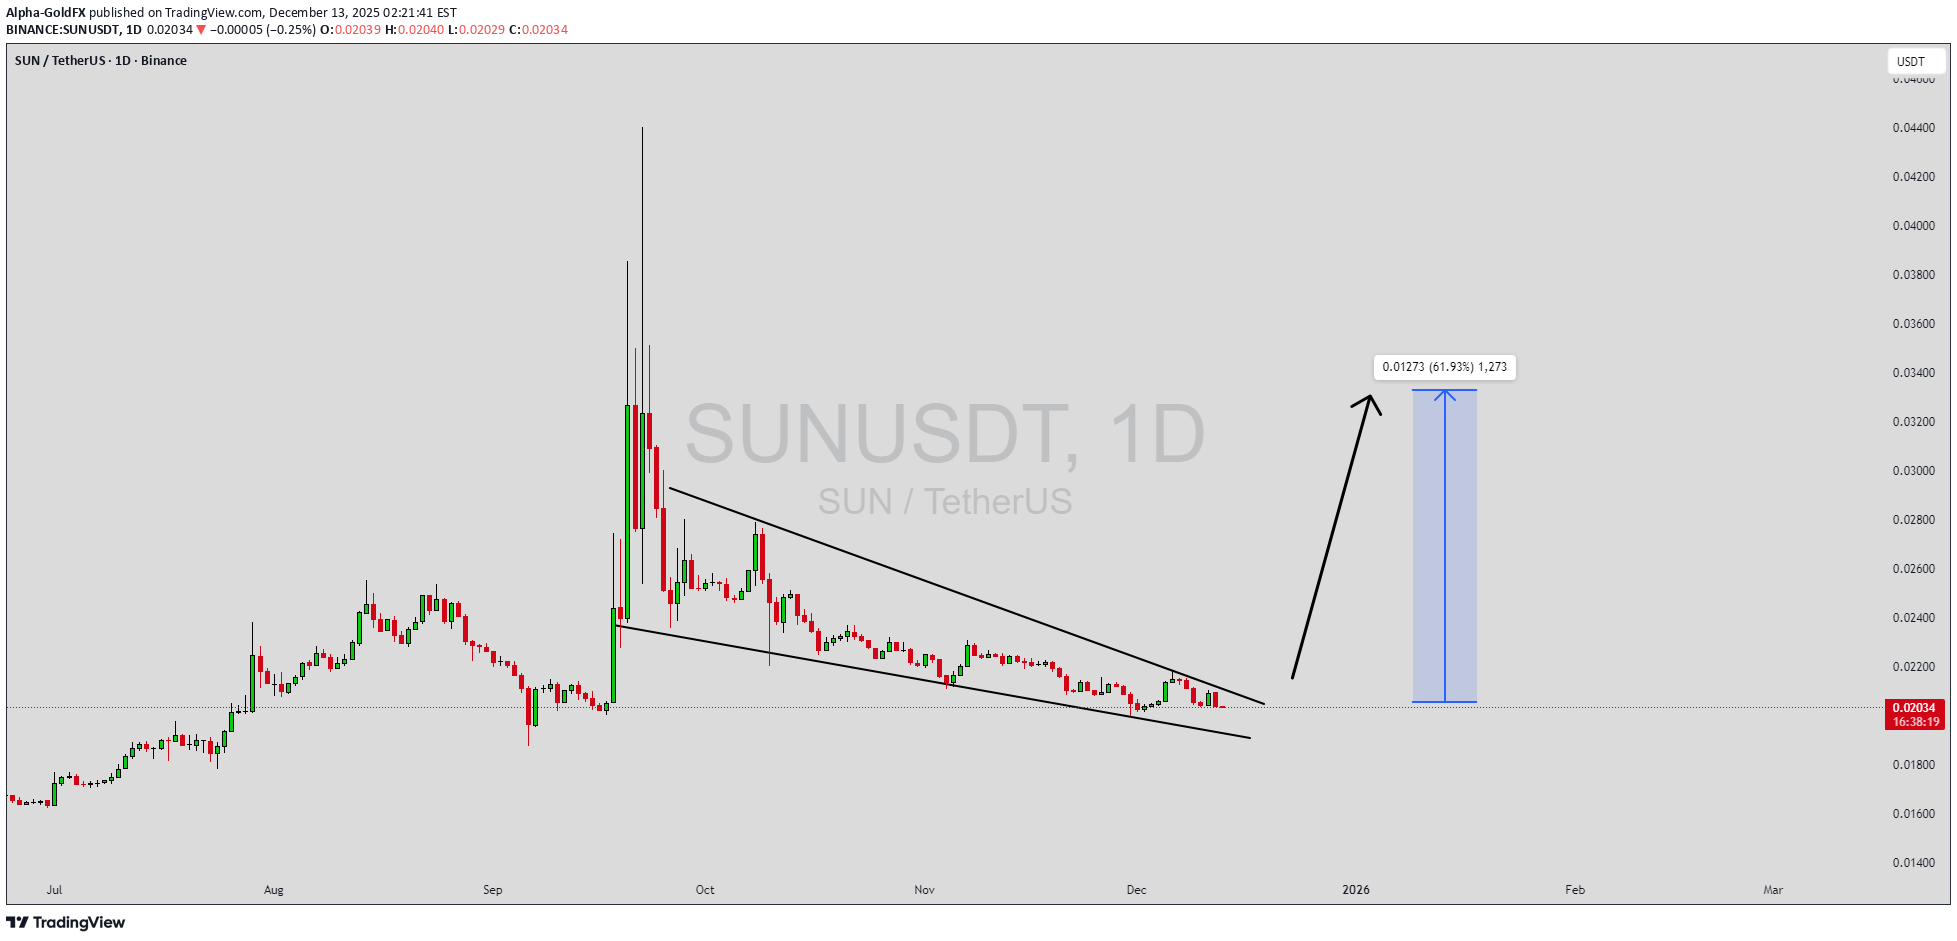
SUNUSDT is forming a clear falling wedge pattern, a classic bullish reversal signal that often indicates an upcoming breakout. The price has been consolidating within a narrowing range, suggesting that selling pressure is weakening while buyers are beginning to regain control. With consistent volume confirming accumulation at lower levels, the setup hints at a potential bullish breakout soon. The projected move could lead to an impressive gain of around 50% to 60% once the price breaks above the wedge resistance. This falling wedge pattern is typically seen at the end of downtrends or corrective phases, and it represents a potential shift in market sentiment from bearish to bullish. Traders closely watching SUNUSDT are noting the strengthening momentum as it nears a breakout zone. The good trading volume adds confidence to this pattern, showing that market participants are positioning early in anticipation of a reversal. Investors’ growing interest in SUNUSDT reflects rising confidence in the project’s long-term fundamentals and current technical strength. If the breakout confirms with sustained volume, this could mark the start of a fresh bullish leg. Traders might find this a valuable setup for medium-term gains, especially as the wedge pattern completes and buying momentum accelerates. ✅ Show your support by hitting the like button and ✅ Leaving a comment below! (What is your opinion about this Coin?) Your feedback and engagement keep me inspired to share more insightful market analysis with you!

Bithereum_io
تحلیل تکنیکال SUNUSDT: شکست گُوِه نزولی و اهداف قیمتی هیجانانگیز!
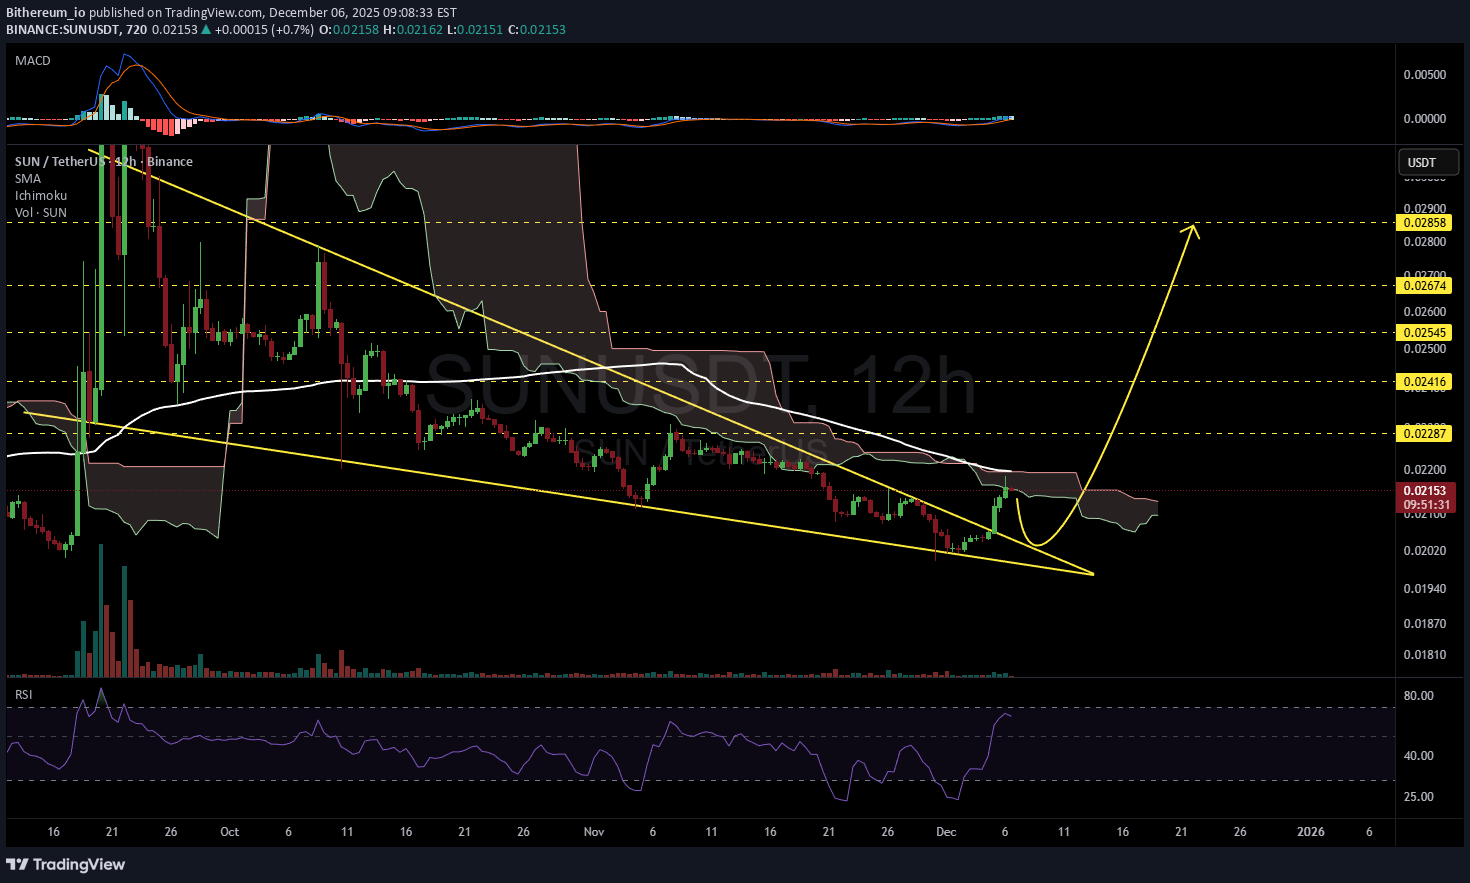
#SUN has broken above the falling wedge pattern on the 12H timeframe chart and is currently facing the Ichimoku cloud and the 12H SMA100, which may cause a pullback to retest the wedge. In case of a breakout above these levels, the potential targets are: 🎯 $0.02287 🎯 $0.02416 🎯 $0.02545 🎯 $0.02674 🎯 $0.02858 ⚠️ Always remember to use a tight stop-loss and maintain proper risk management.

نوسانات اقتصاد جهانی: عامل اصلی تغییرات و چالشهای پیش رو

1. Understanding Fluctuations in the Global Economy Fluctuations refer to periodic or unpredictable changes in economic indicators such as GDP growth, employment levels, inflation, or market prices. These shifts can be short-term (cyclical), medium-term (structural), or long-term (systemic). Types of Fluctuations: Business Cycle Fluctuations: These are natural phases of expansion, peak, contraction, and recovery in an economy. Every country experiences these cycles, though their duration and intensity vary. Financial Market Fluctuations: Driven by investor sentiment, interest rates, and corporate performance, these include stock market rallies and crashes that influence global wealth and investment. Currency and Exchange Rate Fluctuations: Changes in the value of one currency against another affect trade competitiveness, inflation, and cross-border investments. Commodity Price Fluctuations: Volatile prices of oil, gold, natural gas, and agricultural goods can create inflationary or deflationary pressures worldwide. Geopolitical and Policy Fluctuations: Political instability, trade wars, and monetary policy changes often disrupt global supply chains and financial flows. These fluctuations are not random; they emerge from a complex interaction of economic fundamentals, investor behavior, and policy interventions. 2. Causes Behind Global Economic Fluctuations Understanding why fluctuations occur is crucial to managing their impact. Several interrelated factors trigger these shifts: Monetary and Fiscal Policy Changes: Central banks influence liquidity through interest rates and quantitative easing. When interest rates are low, borrowing increases, spurring growth. However, tightening measures to control inflation can slow down the economy, causing cyclical fluctuations. Global Supply and Demand Imbalances: A mismatch between production and consumption—such as oversupply in commodities or chip shortages in technology—creates price volatility. Technological Innovations: Innovations can disrupt existing industries. For instance, the rise of renewable energy affects oil prices, while AI and automation reshape job markets. Investor Psychology and Speculation: Markets are heavily influenced by collective emotion—fear and greed. A surge in optimism can inflate asset bubbles, while panic can trigger sharp corrections. Geopolitical Tensions and Conflicts: Wars, sanctions, and trade barriers affect global trade routes and resource availability, leading to supply shocks and inflationary spikes. Natural Disasters and Pandemics: Events like COVID-19 illustrate how quickly global production, logistics, and consumption patterns can be disrupted, leading to large-scale fluctuations. 3. The Domino Effect: How Fluctuations Spread Globally In today’s globalized economy, no country operates in isolation. Fluctuations in one economy can cascade through several channels: Trade Linkages: When demand drops in one major economy, exporters in others suffer. For instance, a slowdown in China can hurt commodity exporters like Brazil or Australia. Financial Markets: Global investors move capital rapidly between countries. A crisis in one market can trigger sell-offs across others, as seen during the 2008 financial crisis. Currency Transmission: Exchange rate volatility affects import-export competitiveness. A weakening yen, for example, can pressure South Korea’s exports. Commodity Channels: Oil price swings influence transportation costs, inflation rates, and household spending worldwide. Sentiment and Confidence: Even without direct exposure, economies can feel the psychological effects of global uncertainty, reducing investment and spending. 4. Impact on Different Sectors of the Global Economy A. Trade and Manufacturing Trade volumes fluctuate with changing demand and currency valuations. A strong dollar may make U.S. exports expensive, while a weaker rupee might boost India’s export competitiveness. Manufacturing sectors dependent on global supply chains—such as electronics or automobiles—are especially sensitive to such shifts. B. Energy and Commodities Oil and natural gas prices are key determinants of inflation and transportation costs. A sudden oil price surge can trigger global inflation, while a drop can hurt energy-exporting nations like Saudi Arabia or Russia. C. Financial Markets Stock indices mirror investor confidence. Bull markets encourage investment and innovation, while bear markets reduce liquidity and consumer spending. Fluctuations here affect everything from pension funds to venture capital. D. Employment and Wages During downturns, companies cut costs, leading to layoffs and wage stagnation. Conversely, economic expansions raise demand for labor, increasing incomes but sometimes fueling inflation. E. Developing Economies Emerging markets often bear the brunt of global volatility. Their currencies weaken faster, capital outflows rise, and inflation accelerates due to dependence on imported goods. 5. The Psychological and Social Ripple Effects Economic fluctuations don’t just affect balance sheets—they shape social behavior and confidence. When stock markets fall, households feel poorer, spending less and saving more. Consumer pessimism can then deepen recessions. Similarly, rising prices or unemployment can lead to political instability, protests, and shifts in leadership. Governments facing such pressures often turn to populist or protectionist measures, altering global policy landscapes. The social cost of economic instability is immense—ranging from increased inequality to reduced access to education and healthcare in developing regions. 6. Case Studies: Major Global Fluctuations A. The 2008 Financial Crisis Triggered by the U.S. housing bubble, this crisis spread globally through financial markets. Banks collapsed, trade volumes shrank, and unemployment surged worldwide. It illustrated how interconnected the global economy had become and led to reforms in banking regulations and monetary policy coordination. B. The COVID-19 Pandemic (2020–2021) The sudden halt in production, transportation, and consumption caused one of the sharpest global recessions in history. Yet, it also accelerated digital transformation and remote work adoption—showing how fluctuations can drive structural change. C. The Russia-Ukraine Conflict (2022–Present) This geopolitical event caused major energy and food supply disruptions. The resulting surge in oil and grain prices led to inflationary pressures in both developed and developing nations. D. Global Inflation Wave (2023–2024) As economies recovered post-pandemic, demand outpaced supply. Central banks raised interest rates aggressively, leading to sharp corrections in equity and bond markets. This episode reminded policymakers of the delicate balance between growth and stability. 7. Policy and Institutional Responses Governments and central banks play critical roles in mitigating the impact of fluctuations. Their responses can stabilize markets or, if misjudged, worsen volatility. Monetary Policies: Central banks use interest rate adjustments, bond purchases, and liquidity injections to influence credit availability and inflation. Fiscal Policies: Governments can increase public spending or reduce taxes to stimulate demand during downturns, or tighten budgets to cool overheated economies. Regulatory Reforms: Post-crisis regulations like Basel III enhanced global banking stability by improving liquidity and capital requirements. International Cooperation: Institutions like the IMF and World Bank provide financial aid and policy coordination to manage crises across borders. Market Transparency and Digitalization: Technologies like blockchain and AI now enhance real-time monitoring of global economic trends, reducing reaction delays. 8. Long-Term Effects: Evolution Through Fluctuation Though painful in the short term, fluctuations often lead to long-term growth and innovation. Crises expose weaknesses in economic systems, prompting reforms and resilience-building. For instance: The 2008 crisis accelerated the move toward digital banking. COVID-19 expanded e-commerce and remote working ecosystems. Energy market disruptions are fueling investment in renewables. Thus, fluctuations, while disruptive, serve as catalysts for modernization and adaptation. 9. Strategies to Navigate Global Fluctuations For nations, corporations, and investors, adaptability is key. Some strategic measures include: Diversification: Spreading investments across sectors and regions reduces exposure to single-market shocks. Sustainable Development: Economies focusing on renewable energy, digital infrastructure, and innovation withstand shocks better. Prudent Monetary Management: Maintaining healthy foreign reserves and debt levels allows flexibility during crises. Data-Driven Decision-Making: Using predictive analytics helps governments and businesses anticipate market turns. Global Collaboration: Shared crisis management mechanisms—like coordinated rate cuts or trade agreements—strengthen collective resilience. Conclusion: Embracing the Waves of Change Economic fluctuations are neither entirely avoidable nor entirely harmful. They are intrinsic to the global economic system—signaling transitions, correcting excesses, and driving innovation. The key lies in how the world responds to them. Policymakers must balance growth with stability, corporations must plan for volatility, and investors must understand that uncertainty is the price of opportunity. The global economy, much like the ocean, will always have tides of expansion and contraction. Learning to navigate these waves—rather than resisting them—is the essence of sustainable progress. In essence, fluctuations are not the enemies of the global economy—they are its rhythm, its pulse, and its path toward evolution.

minno91
Quick Scalp or Just a Dump?
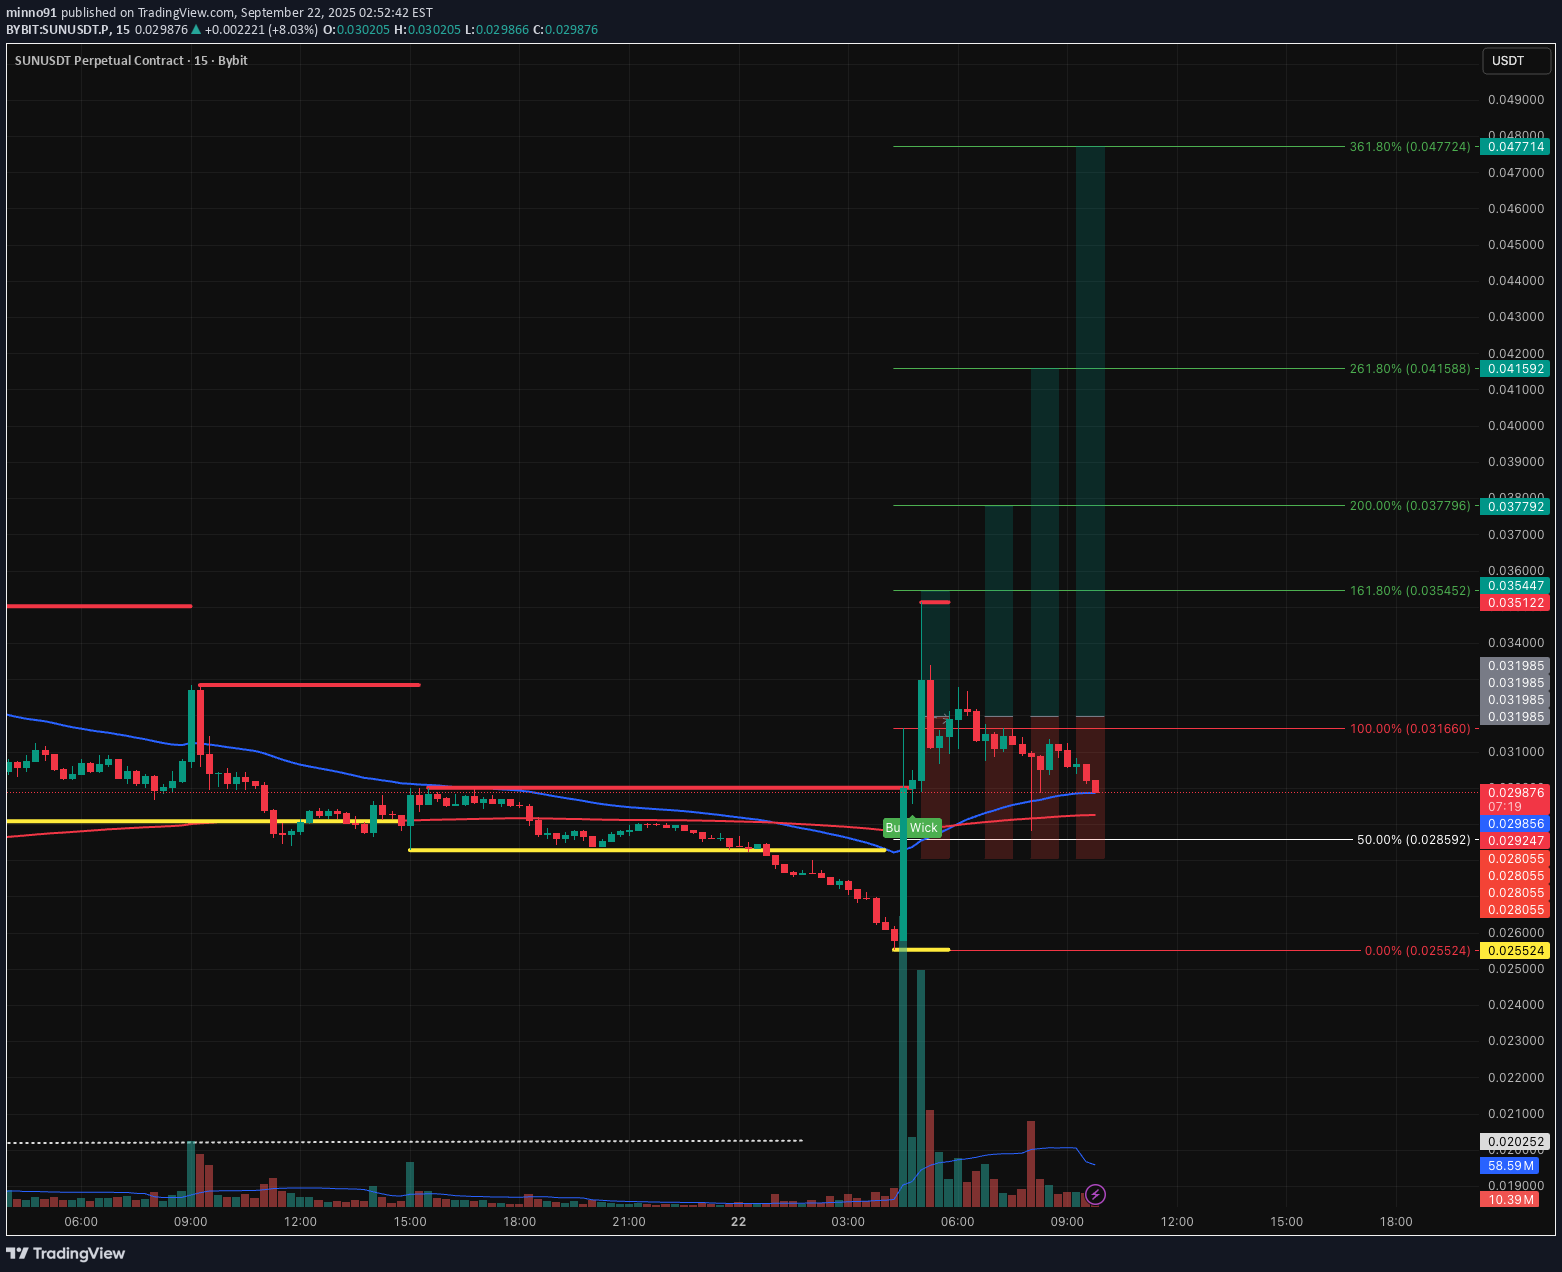
Market’s showing some dumping pressure right now, but that also opens the door for a fast recovery. This is a pure scalp setup — could play out in just minutes. High risk, quick trade, nothing long-term — but sometimes these fast ideas are worth a shot. Let’s see how it works out! 👀🔥

WaveRiders2

AltcoinPiooners
Explode Your Gains: Epic $SUN Trading Breakthrough Awaits!
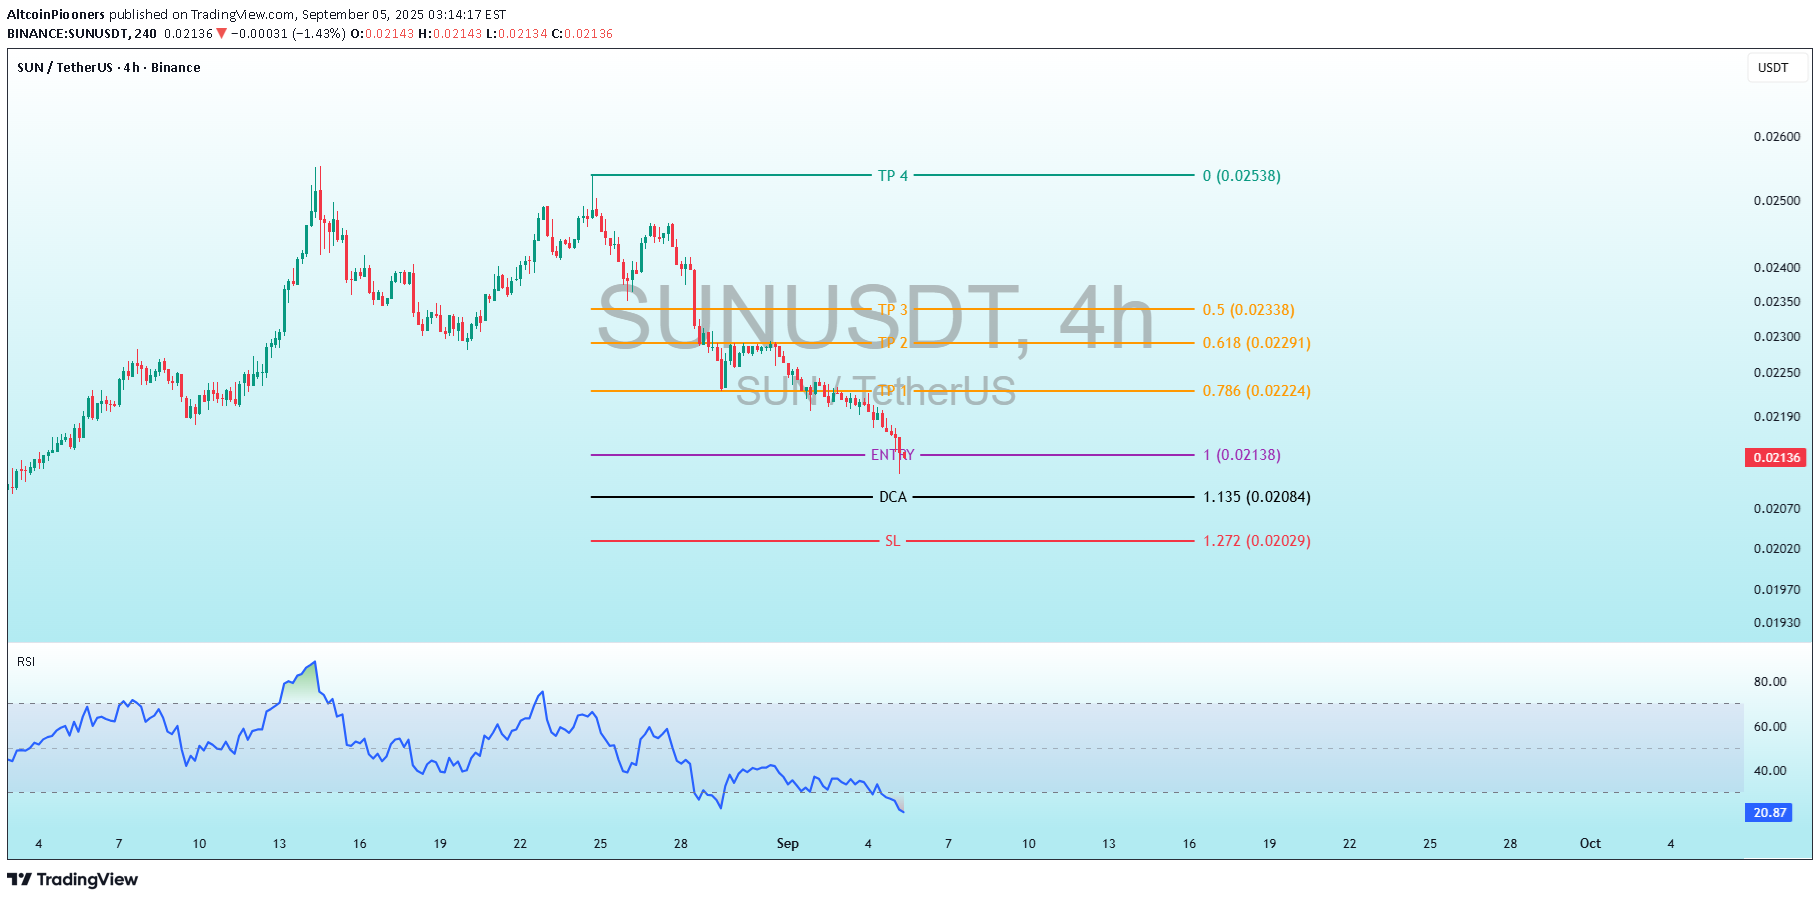
SUNUSDT Explode Your Gains: Epic SUN Trading Breakthrough Awaits! Key Patterns: The uptrend forms a clear parabolic rise with increasing volatility (longer wicks on candles). The downtrend resembles a "dump" phase, with a near-vertical drop, possibly driven by profit-taking or market sentiment shifts. Current price is consolidating near a potential support zone (0.0190–0.0200 USDT), with small-bodied candles indicating indecision. No clear reversal pattern (e.g., hammer or double bottom) is visible yet, but the proximity to marked levels suggests a setup for one. Volatility and Range: The price range over the period is from ~0.0170 USDT (lows) to 0.0600 USDT (highs). Recent action is low-volatility compared to the peak, with the price hugging the lower end. Indicator Analysis: RSI The RSI (14-period) is plotted at the bottom, ranging from 0 to 100, with overbought (>70) and oversold (<30) thresholds marked implicitly (horizontal lines at 80, 60, 40, 20). Behavior: RSI mirrored the price action closely. It spiked to over 80 during the uptrend (overbought, signaling potential exhaustion), then plunged sharply to around 20–25 by early September (oversold, indicating potential buying opportunity). Current Reading: The RSI is at approximately 21 (visible on the right), deep in oversold territory. It has been trending downward but flattening slightly in the recent candles, which could hint at divergence if price stabilizes— a bullish signal if confirmed. Interpretation: Oversold RSI often precedes reversals in trending markets, especially in crypto. However, in strong downtrends, it can remain oversold for extended periods. No clear bullish divergence (RSI higher lows while price makes lower lows) is evident yet, but watch for it as a confirmation of upside. Marked Levels and Trading Strategy The chart includes multiple horizontal lines with labels, colors, and Fibonacci ratios (e.g., 0.786, 1.618), suggesting a Fibonacci-based trading plan for a long position. This is common in crypto trading for projecting targets and risk management. The levels appear anchored from a recent swing low to high (likely the August low to peak). Stop Loss (SL): Red line at 1.272 USDT, labeled "SL" with Fib 1.272 (0.02029) – slight discrepancy in label, possibly a calculation note). This is the risk level where the trade would be invalidated if price breaks lower. Dollar Cost Average (DCA): Black line at 1.135 (1.135 Fib, 0.02004). This suggests adding to the position if price dips further, averaging down the entry cost. Entry: Purple line at 1 (1.0 Fib, 0.02140-0.02135). This is the primary buy level, where the trader would enter a long position. Current price is very close or slightly below this, making it active or imminent. Take Profit (TP) Levels: Multiple orange and cyan lines upward, labeled with Fib extensions (e.g., 0.786, 1.618, 3.0, 4.618, 5.0) and prices: TP1: ~0.02224 USDT (0.786 Fib, 0.02224) TP2: ~0.02291 USDT (1.618 Fib, 0.02291) TP3: ~0.02338 USDT (likely 3.0 or 4.0 Fib, 0.02338) TP4: Cyan at 0 (extended target 0.02538 USDT, possibly 5.0 Fib or the previous high).
Alpha-GoldFX
SUNUSDT Forming Descending Triangle
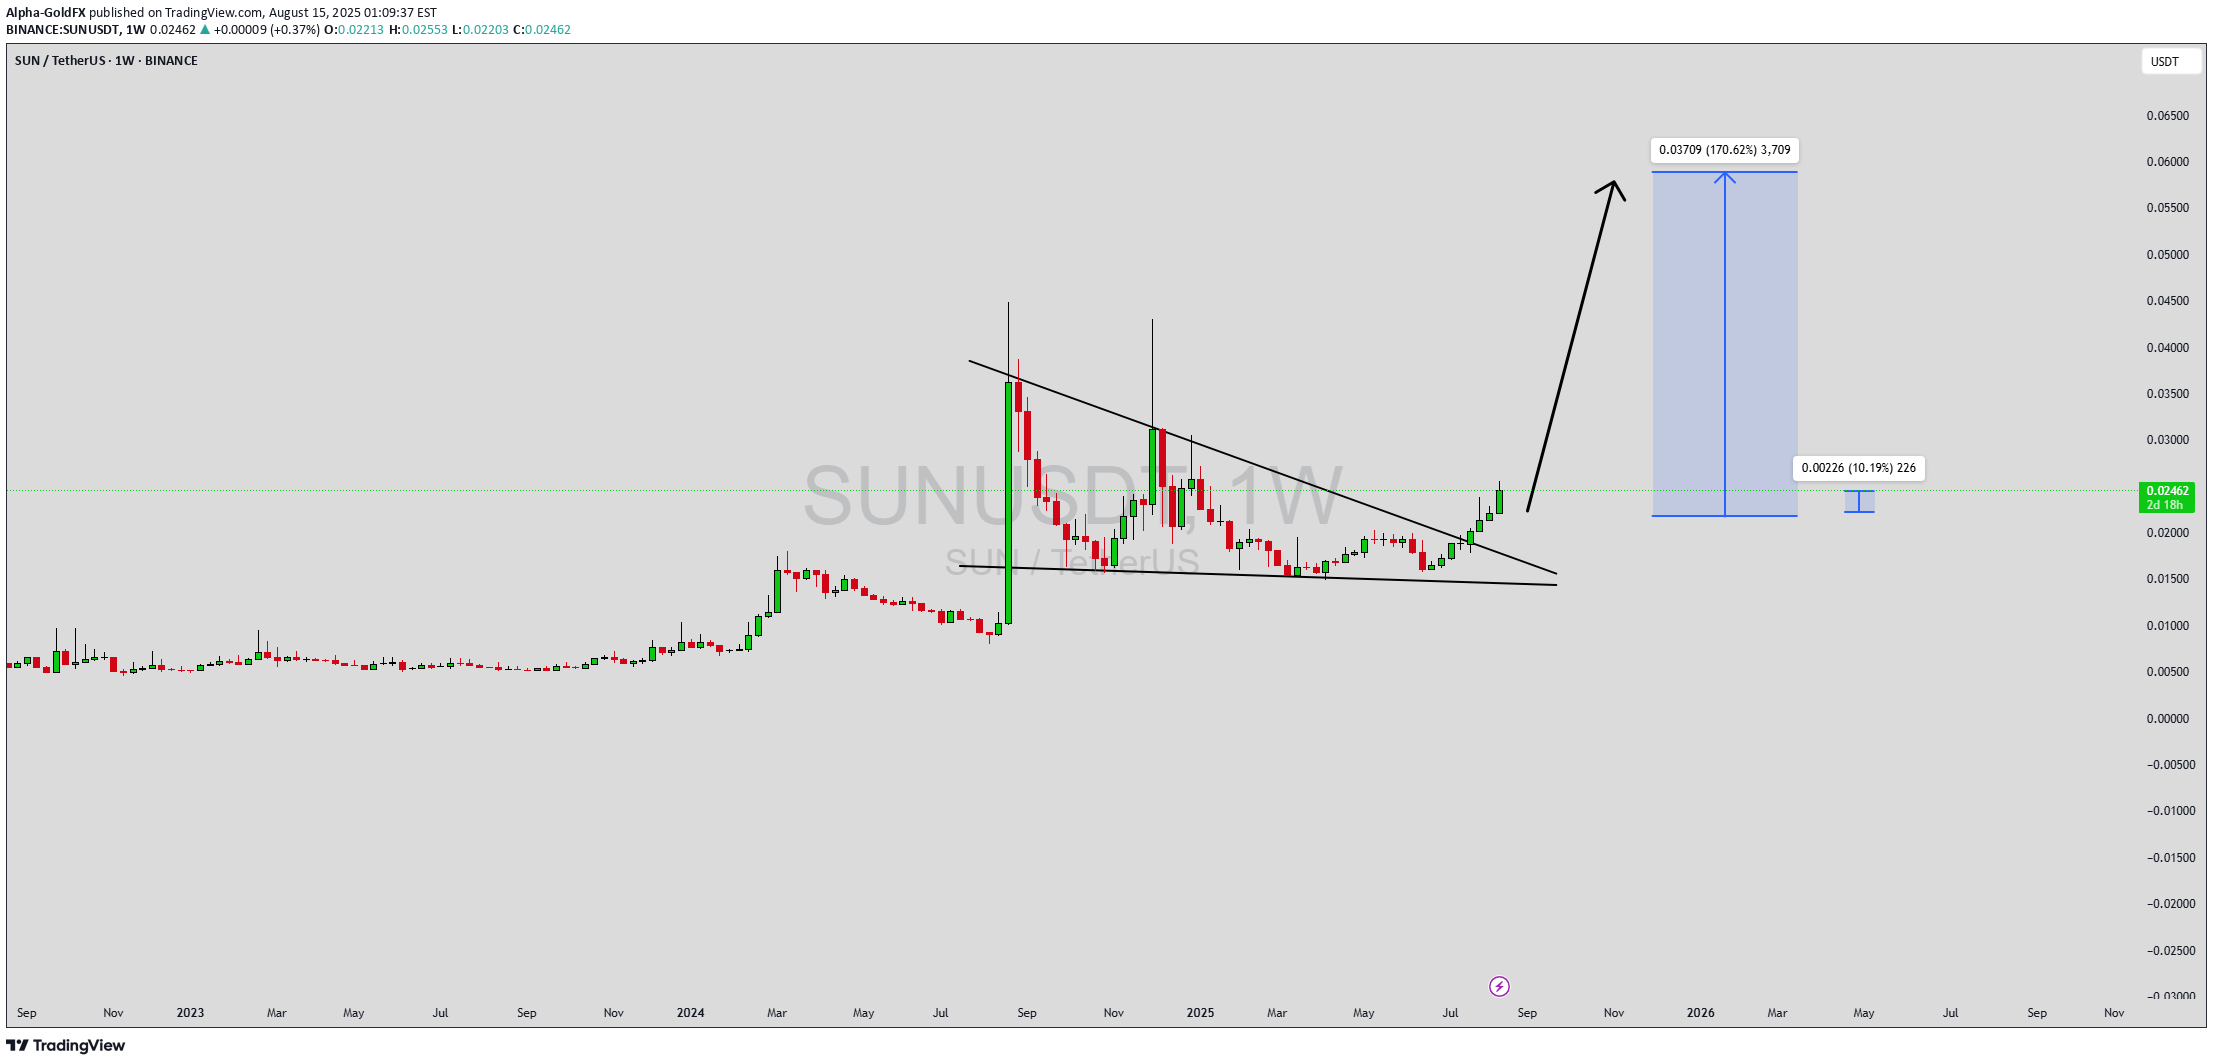
SUNUSDT is showing a strong bullish breakout from a long-term descending triangle, a formation that often precedes explosive price action. The weekly chart reveals a sustained breakout above the multi-month trendline resistance, indicating a shift in market structure and signaling that bulls are gaining control. With volume gradually building up and a clear structure confirming accumulation, SUNUSDT appears ready for a significant move. Based on the current chart setup, there’s potential for an impressive 140% to 150% upside. Historically, SUN has shown sharp vertical rallies following periods of consolidation. The current breakout mimics past behavior and could lead to a powerful trend continuation toward the 0.06000 USDT region. Traders and investors alike are paying close attention to this level, as the next wave of bullish sentiment could send SUNUSDT into price discovery, especially with the crypto market showing renewed optimism. Market sentiment around SUN is also improving due to increasing attention from retail and institutional players. Social buzz, coupled with increased transaction volumes, reflects growing confidence in this project's roadmap and future prospects. If current momentum continues, SUNUSDT might outperform other altcoins in the short-to-medium term. ✅ Show your support by hitting the like button and ✅ Leaving a comment below! (What is You opinion about this Coin) Your feedback and engagement keep me inspired to share more insightful market analysis with you!
Alpha-GoldFX
SUNUSDT Forming Potential Breakout

SUNUSDT is currently forming a promising potential breakout pattern that traders and investors should closely watch. The price action has shown a period of consolidation near key support zones, building a strong base for a potential explosive move. With volume gradually increasing and bulls taking control, the pair appears primed to break past resistance levels, signaling the beginning of a new uptrend phase. The technical structure supports a bullish bias, with the potential to achieve a gain of 140% to 150%+ if the breakout materializes fully. Historical price behavior and recent candle formations suggest that SUNUSDT is gearing up for a rally, especially as it approaches a crucial trendline. If confirmed, this breakout could lead to a parabolic move, driven by renewed market interest and buying pressure. SUN, being part of the TRON ecosystem, benefits from a solid foundation and increasing usage in DeFi applications. The token has seen growing investor interest, further fueling positive sentiment and long-term potential. The fundamentals are aligning well with the current technical outlook, providing additional confidence to bullish traders eyeing high-reward setups. Given the momentum and improving market dynamics, SUNUSDT has become a high-potential watchlist candidate for both swing traders and long-term investors. A confirmed breakout above the current range could open the door to significant upside gains. ✅ Show your support by hitting the like button and ✅ Leaving a comment below! (What is You opinion about this Coin) Your feedback and engagement keep me inspired to share more insightful market analysis with you!
Disclaimer
Any content and materials included in Sahmeto's website and official communication channels are a compilation of personal opinions and analyses and are not binding. They do not constitute any recommendation for buying, selling, entering or exiting the stock market and cryptocurrency market. Also, all news and analyses included in the website and channels are merely republished information from official and unofficial domestic and foreign sources, and it is obvious that users of the said content are responsible for following up and ensuring the authenticity and accuracy of the materials. Therefore, while disclaiming responsibility, it is declared that the responsibility for any decision-making, action, and potential profit and loss in the capital market and cryptocurrency market lies with the trader.