
DragonCaoB
@t_DragonCaoB

What symbols does the trader recommend buying?
Purchase History
پیام های تریدر
Filter
DragonCaoB
سیگنال خرید قوی: خورشید (SUN) در آستانه انفجار صعودی! (تحلیل تکنیکال)
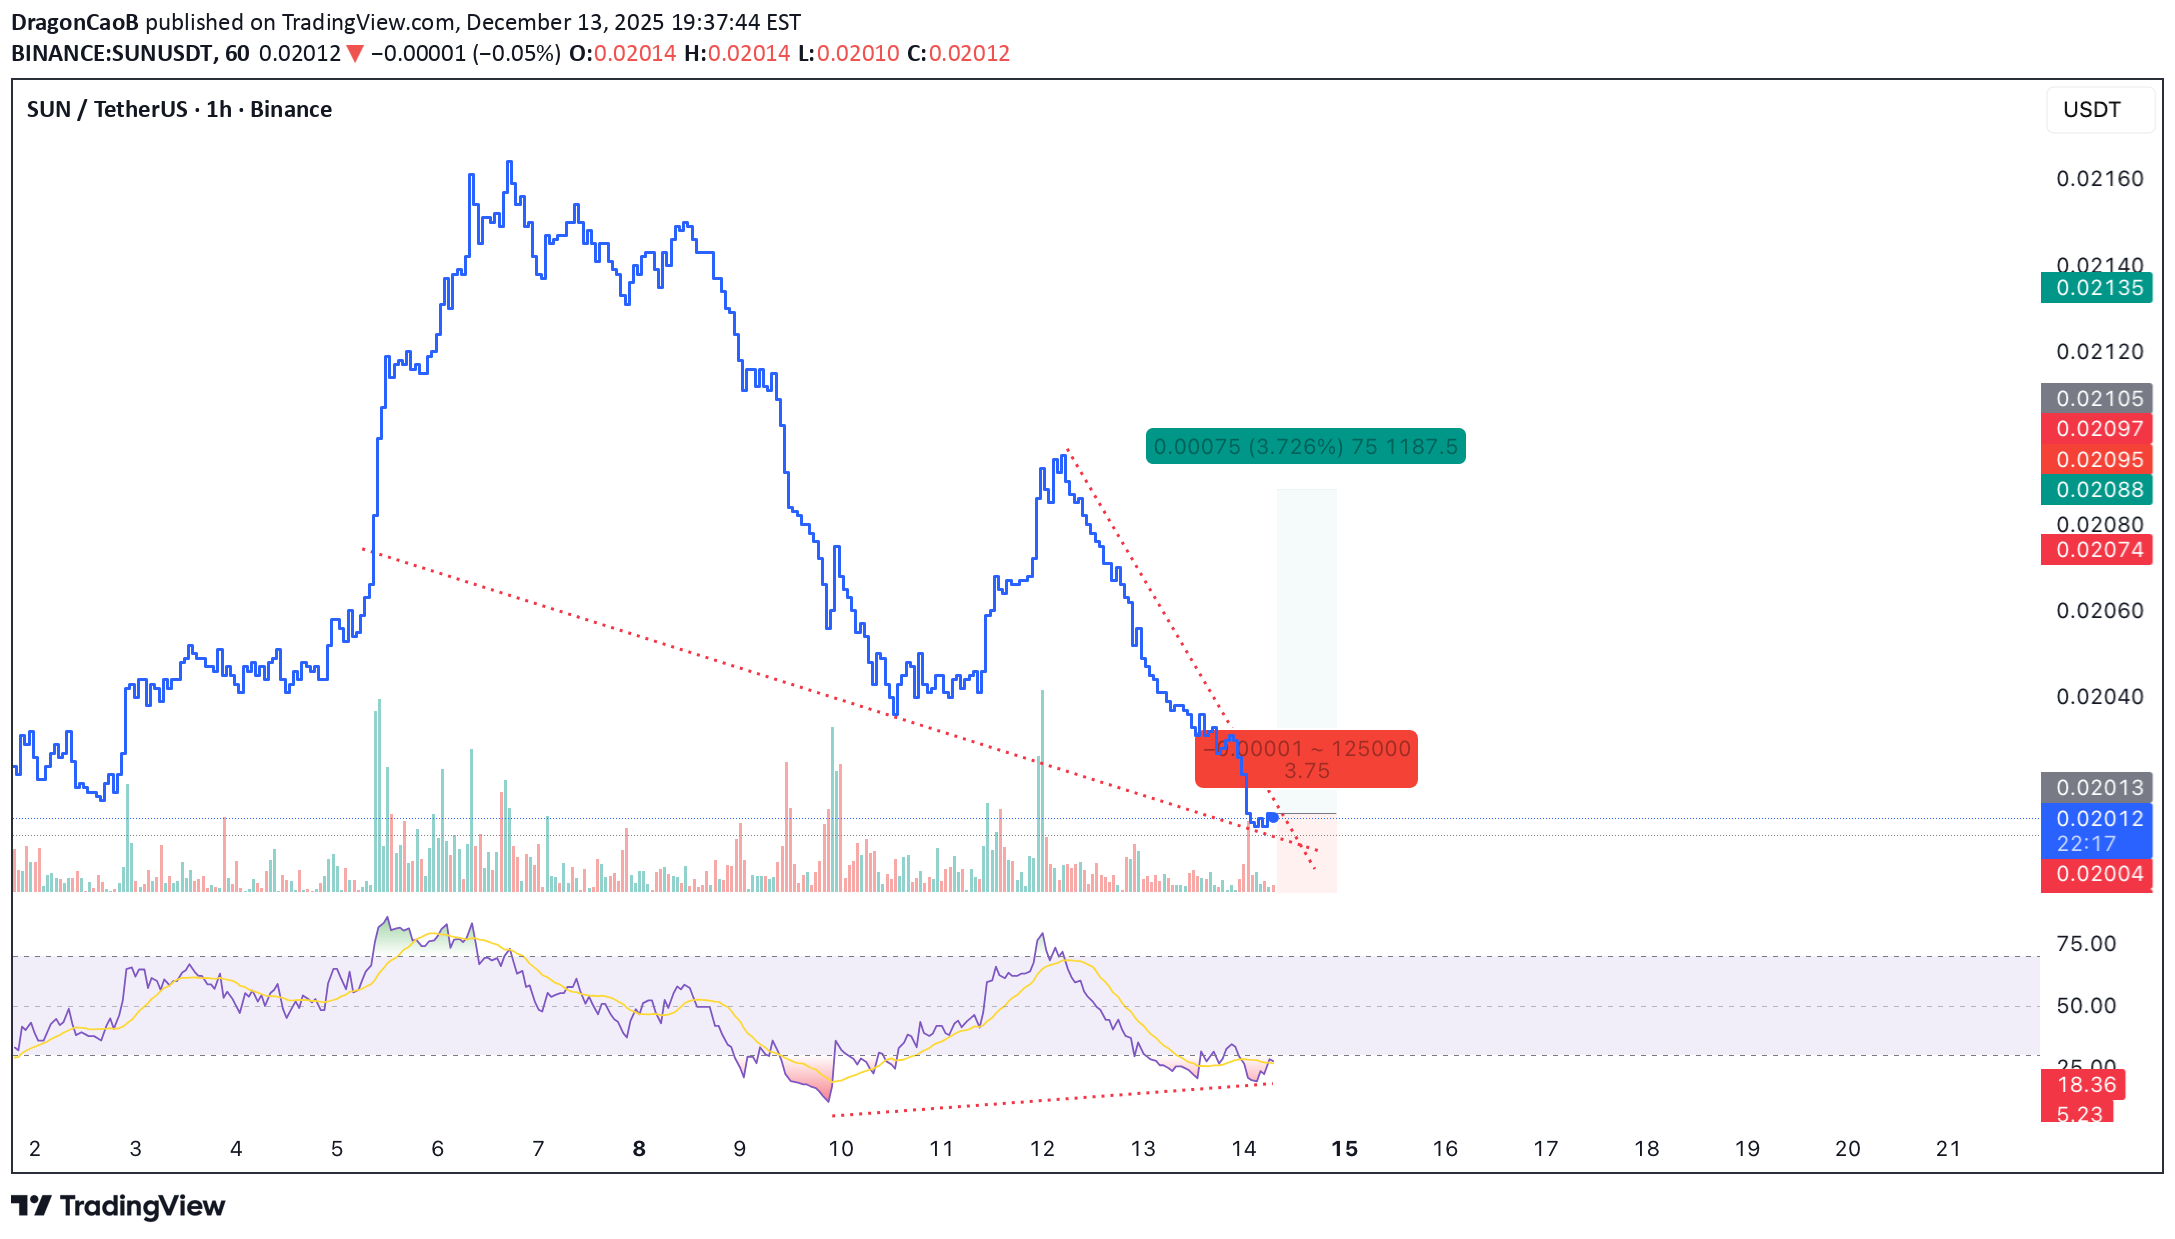
🐂 Scalp LONG – SUN SUN is deeply oversold on the 1h timeframe, signaling exhaustion on the sell side. Price action is compressing and approaching a classic breakout structure, suggesting momentum is building for a sharp upside expansion. A strong bullish breakout is anticipated. 🎯 TP: 0.02088 🛡️ SL: 0.01993 📊 RR: 1 : 3.75 A high-quality long setup: 1h oversold conditions + breakout structure → strong rebound potential with attractive risk-to-reward.
DragonCaoB
ریزش سنگین LSK در راه است؟ سیگنال فروش قدرتمند پس از اوجگیری انفجاری!
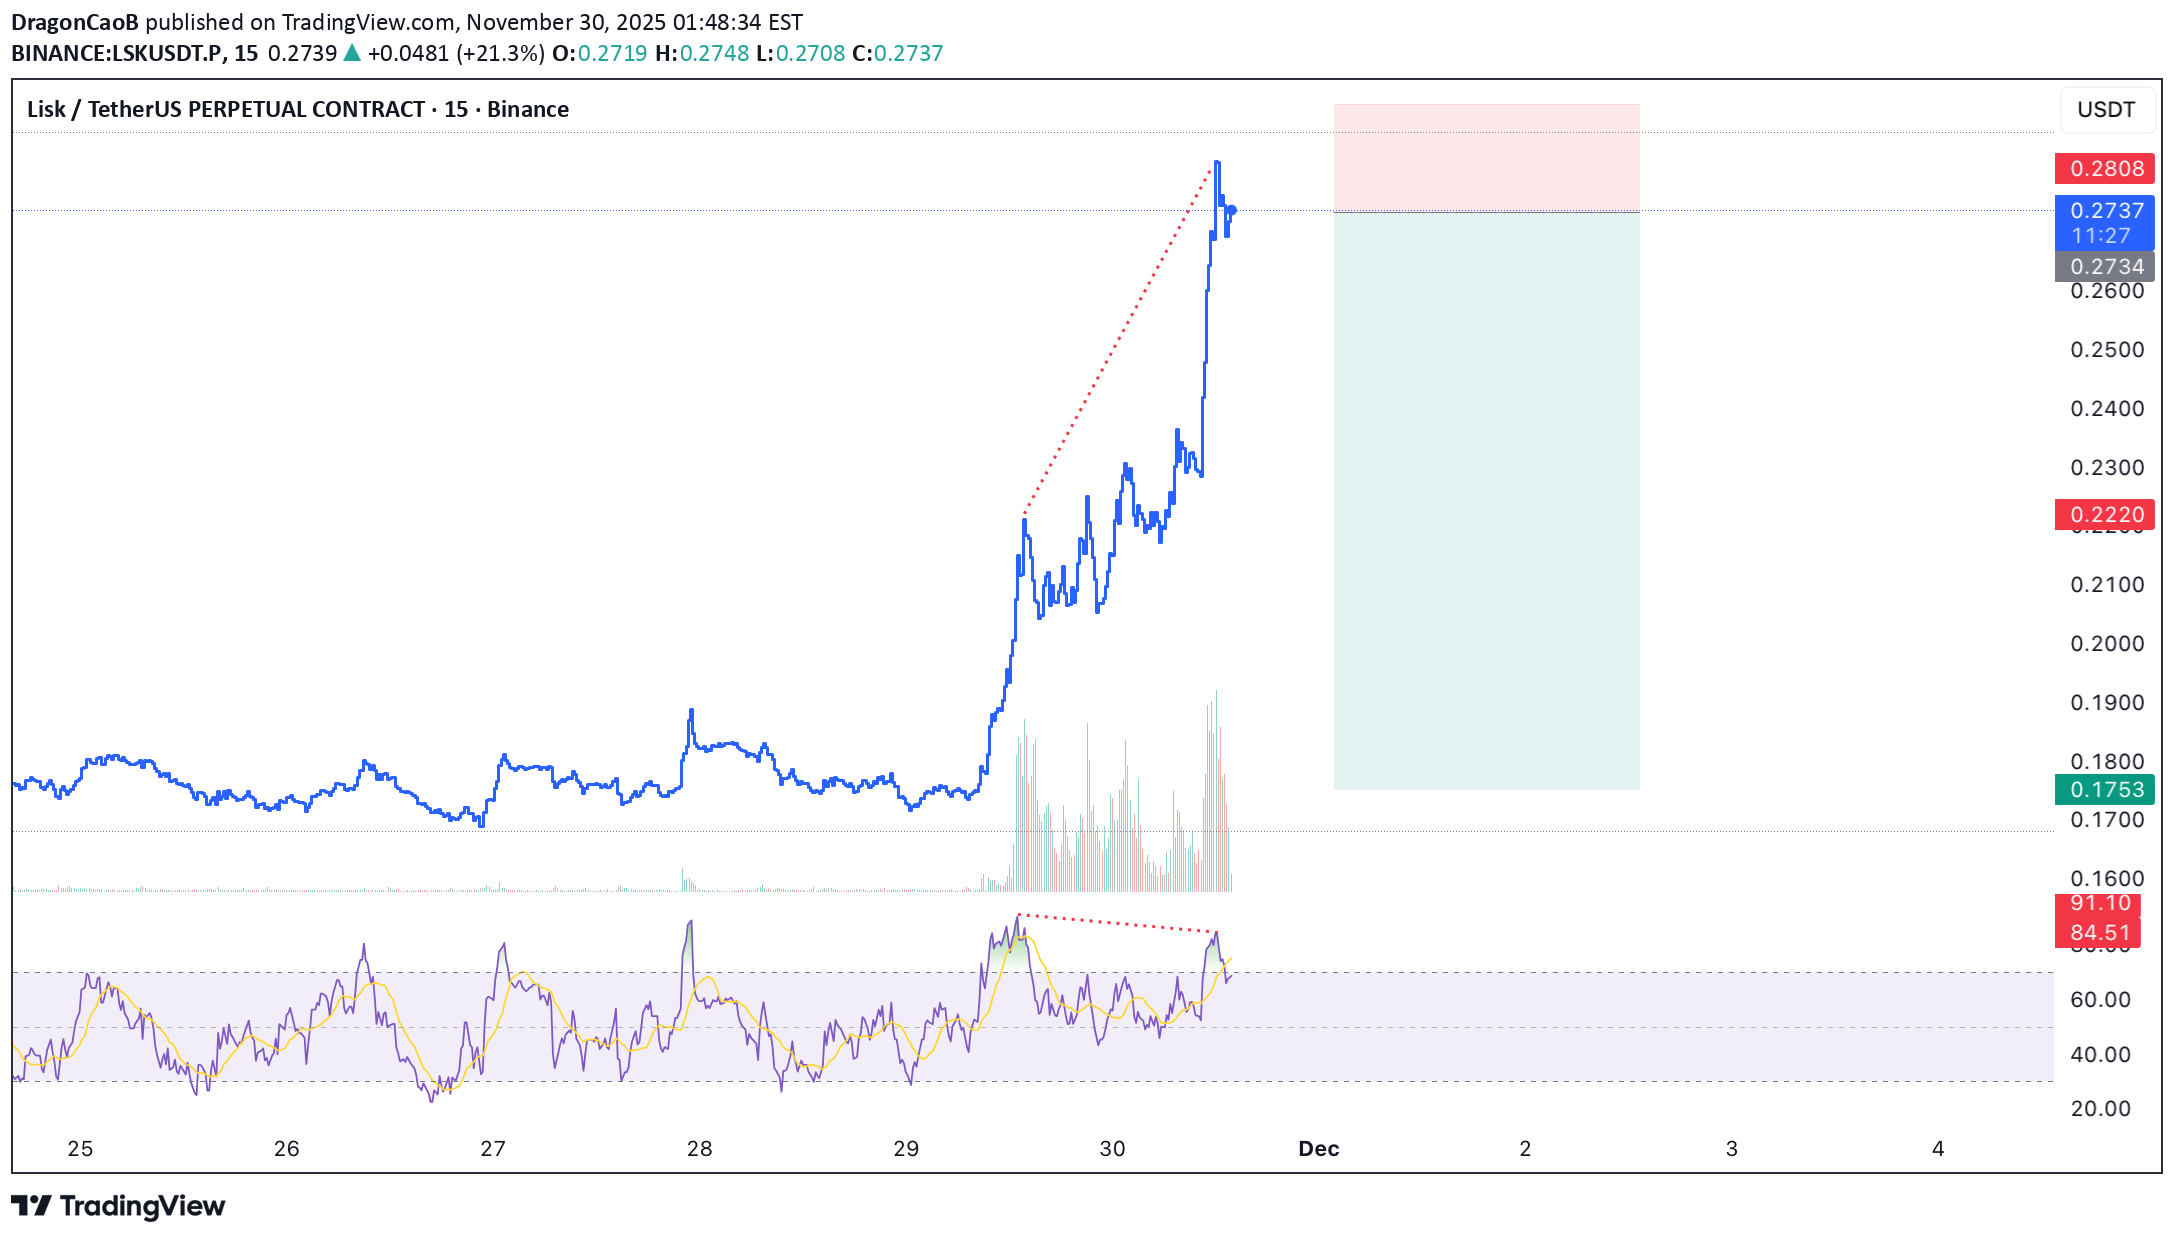
🐻 Scalp SHORT – LSK LSK has surged aggressively, pushing RSI into extreme overbought territory (reaching up to 90) and forming strong bearish divergences on both the 15m and 1h timeframes. Buying momentum is clearly weakening, while price action shows exhaustion near the local top. This strongly signals a potential sharp correction. 🎯 TP: 0.1756 🛡️ SL: 0.2917 📊 RR: 1 : 5.33 A clean short setup: extreme overbought conditions + multi-timeframe bearish divergence → high probability of downside pressure.
DragonCaoB
سیگنال خرید قوی BOB: شکست روند نزولی و صعود هیجانانگیز تا سقف جدید!
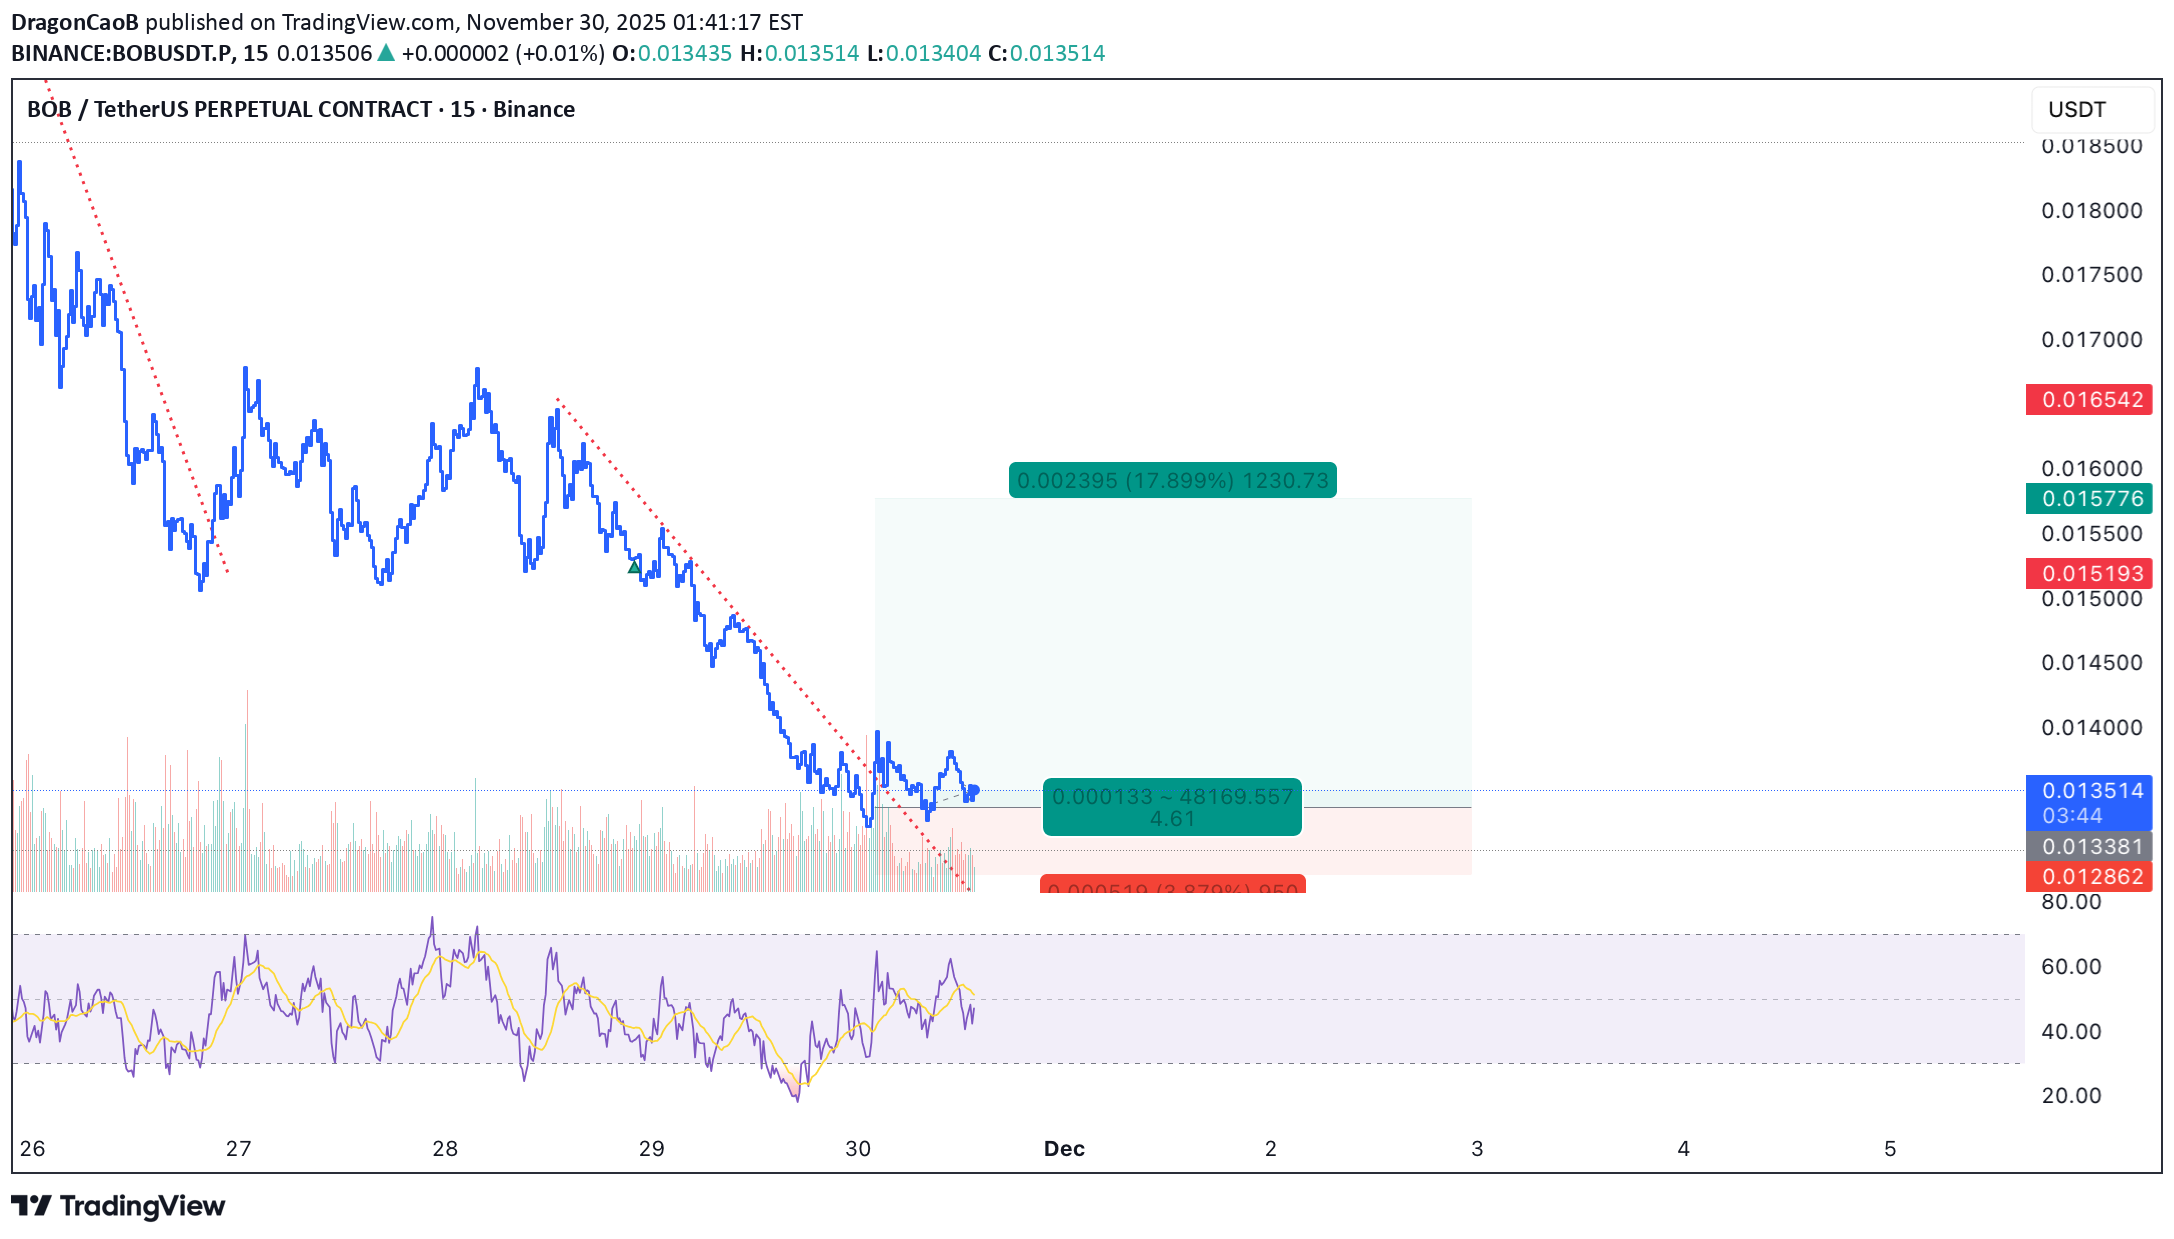
🐂 Scalp LONG – BOB BOB has broken the downtrend and completed a successful retest, confirming a short-term market structure shift. Price is currently trading above a strong multi-timeframe support zone, where buyers are consistently absorbing sell pressure. As long as this support holds, the probability of a bullish rebound toward the recent high is very strong. Key Technical Points: Downtrend break + successful retest Trading above strong support Short-term structure turning bullish 🎯 TP: 0.015776 🛡️ SL: 0.0123862 📊 RR: 1 : 4.61 A clean, professional long setup focused on confirmed reversal signals and solid support strength.
DragonCaoB
سیگنال خرید قوی: صعود قریبالوقوع پس از شکست روند نزولی (Scalp LONG – BOB)
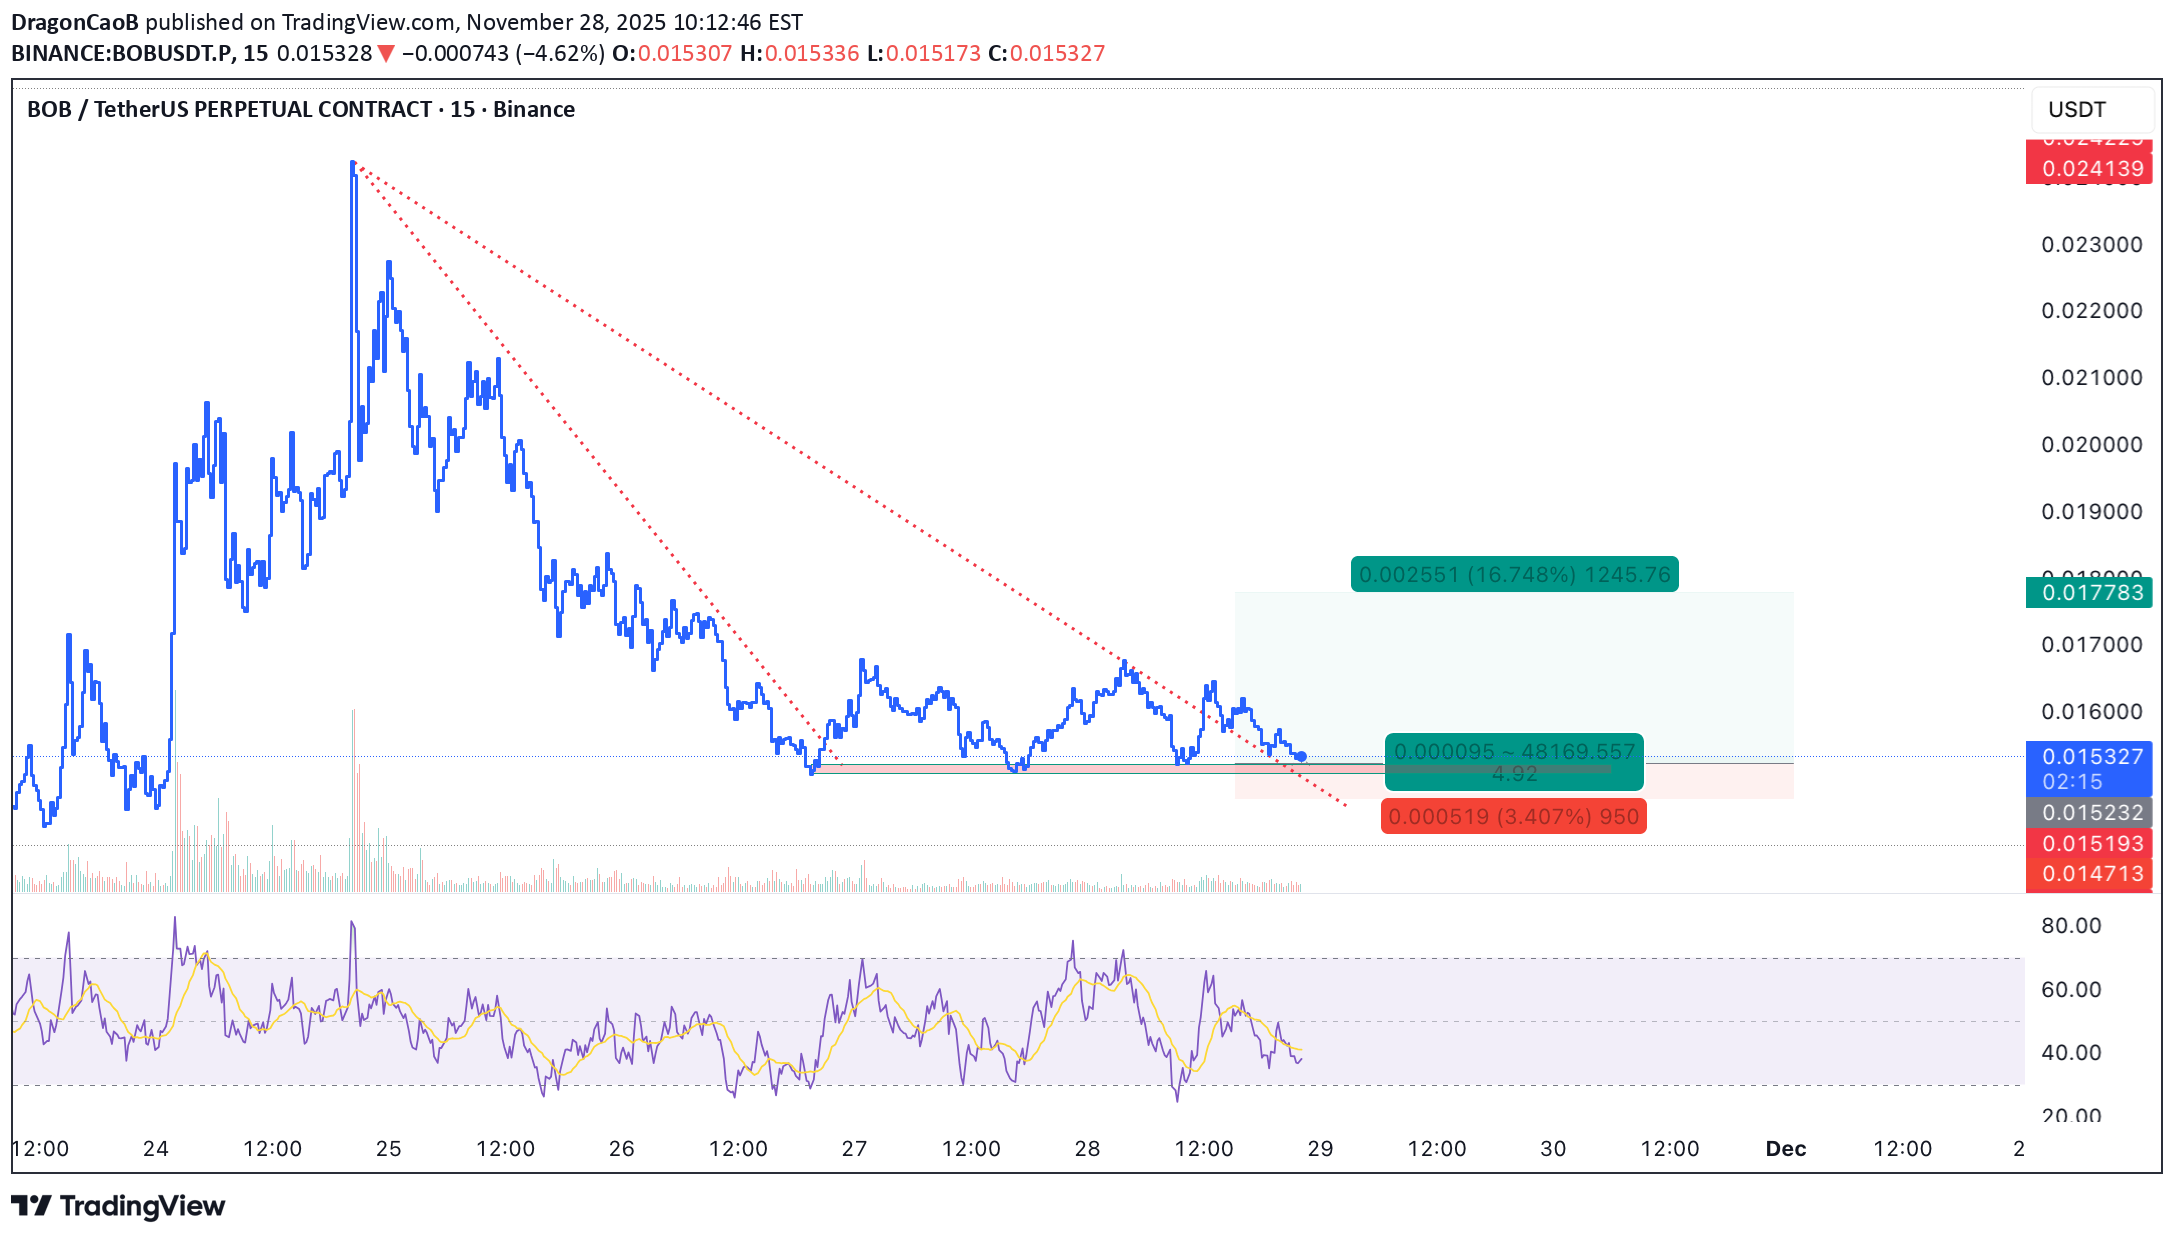
🐂 Scalp LONG – BOB BOB has broken its downtrend and successfully retested the breakout zone, confirming a structural shift in momentum. Price is now sitting firmly on a major multi-frame support, indicating strong buy-side defense. With sellers exhausted and structure reclaimed, a short-term recovery leg is highly probable. Key Signals Downtrend break + confirmed retest Strong multi-timeframe support holding Momentum recovery forming from the base 🎯 TP: 0.017783 🛡️ SL: 0.014713 📊 RR: 1 : 4.92 Một setup long rõ ràng, dựa trên cấu trúc đảo chiều và hỗ trợ vững chắc.
DragonCaoB
تحلیل تکنیکال زوماوت ZRX: فرصت طلایی خرید با پتانسیل رشد بالا!

🐂 Scalp LONG – ZRX ZRX has broken its downtrend and is now pressing against the upper boundary of its accumulation range. A clean breakout from this box would open a strong path for price to retest the previous high. Momentum is stabilizing, and structure favors a bullish continuation if liquidity is cleared above the range. Key Signals Downtrend already broken → structure shifting bullish Price compressing at the top of accumulation Breakout = high probability move toward prior highs 🎯 TP: 0.1791 🛡️ SL: 0.1500 📊 RR: 1 : 2.38 A focused long setup, waiting for confirmation as ZRX escapes the range.
DragonCaoB
سیگنال خرید قوی ROSE: شکست روند نزولی و آماده صعود به قله قبلی!
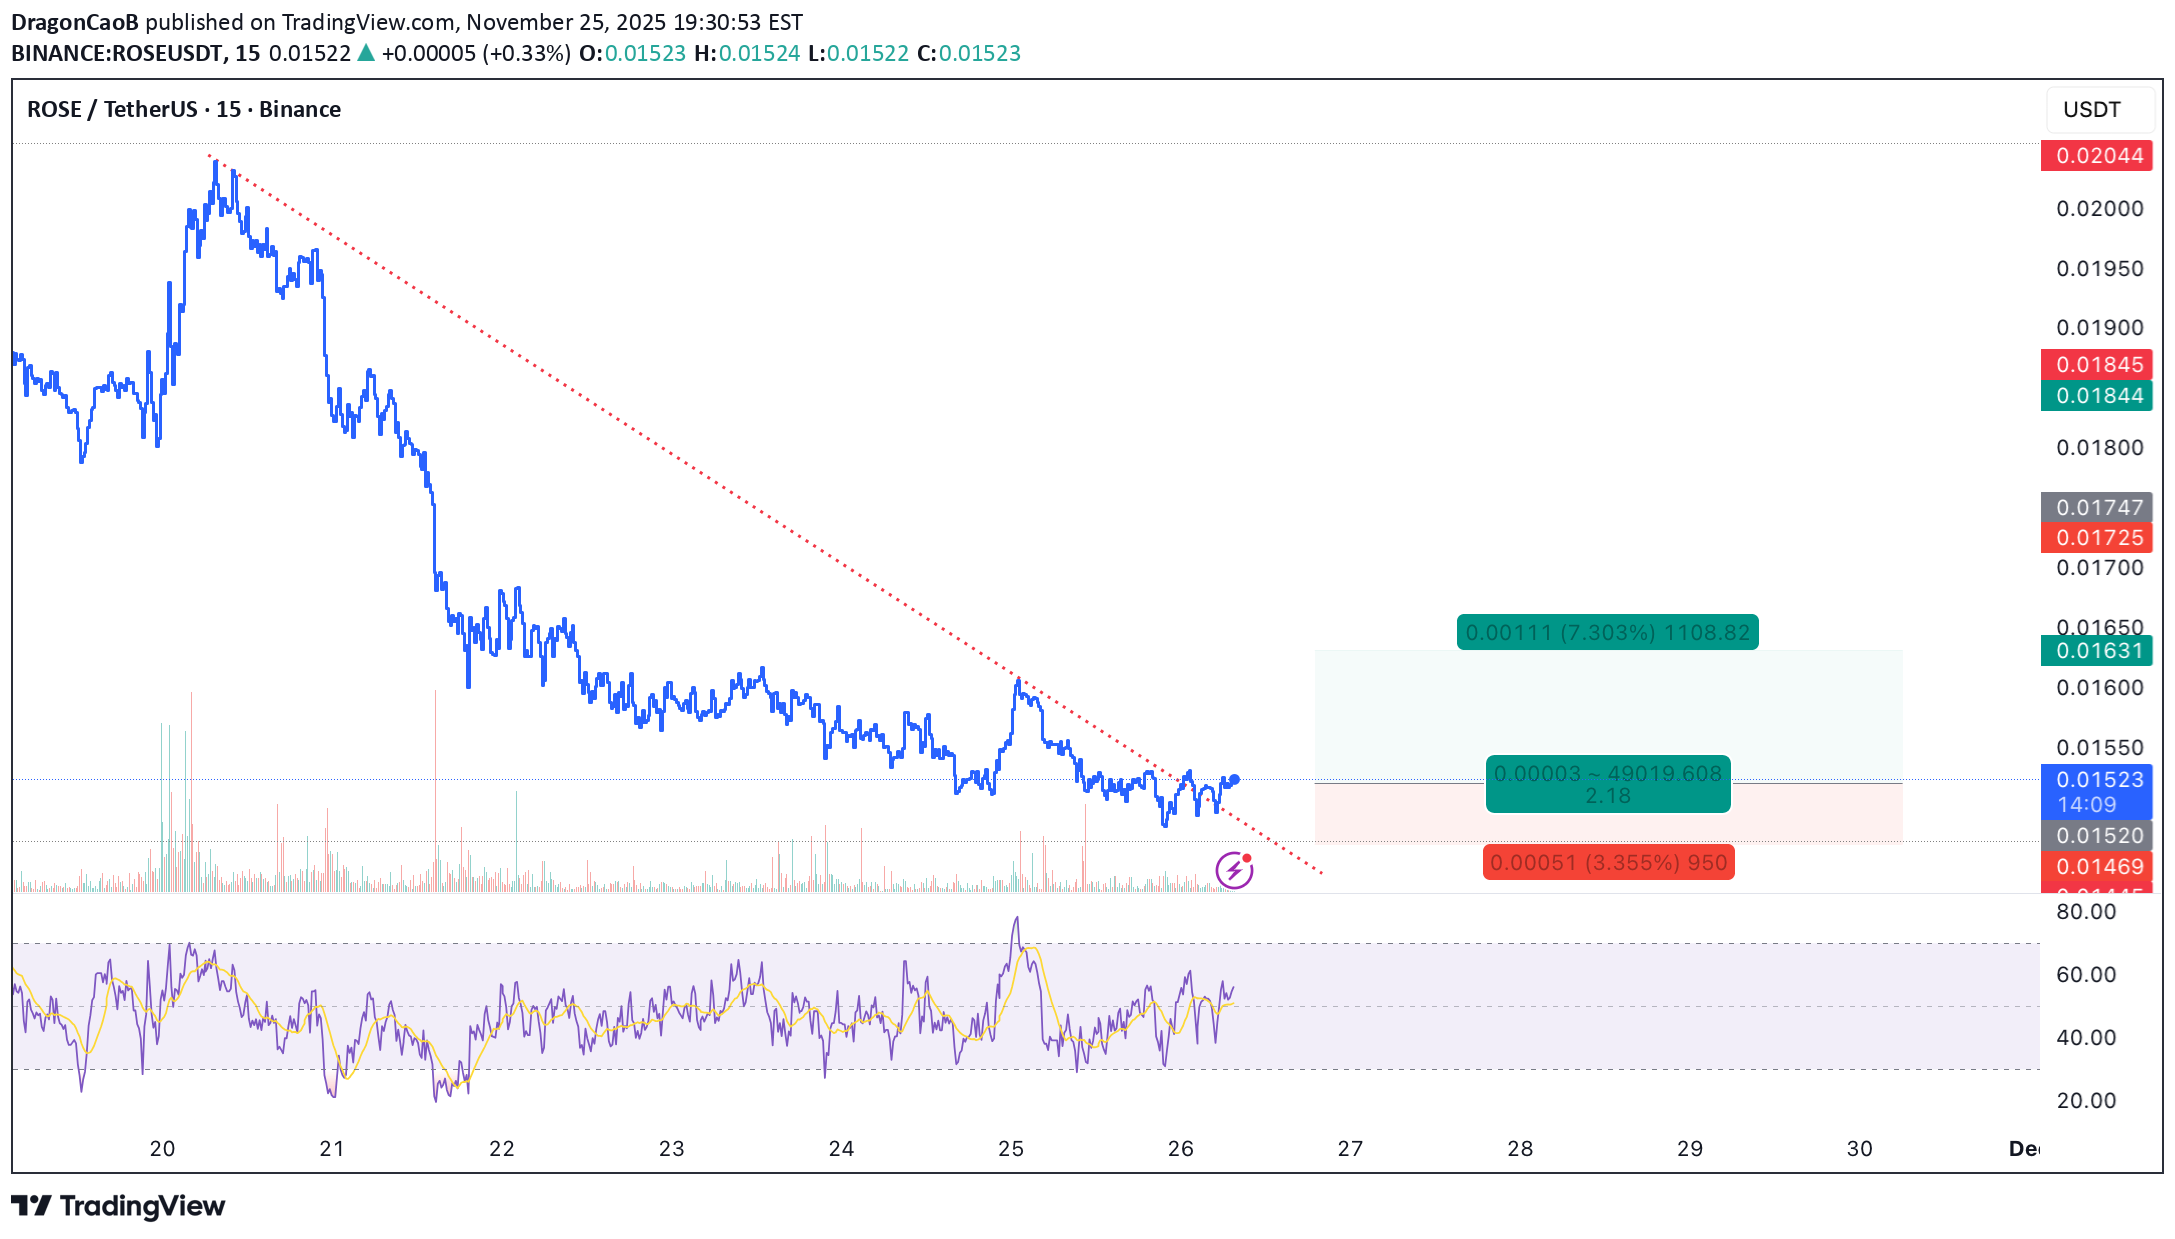
🐂 Scalp LONG – ROSE ROSE has broken its short-term downtrend and is now stabilizing above a strong multi-timeframe support zone. RSI is turning upward, indicating improving momentum. With structure shifting bullish and overhead resistance nearby, a retest of the recent high is likely. Key Signals Short-term downtrend clearly broken Price holding firmly above strong support RSI rising → momentum recovery underway 🎯 TP: 0.01631 🛡️ SL: 0.01469 📊 RR: 1 : 2.18 A clean long setup aiming for a continuation push toward the previous high.
DragonCaoB
سیگنال فروش داغ: ترید نزولی استراتژیک با ریسک به ریوارد عالی (STRK)
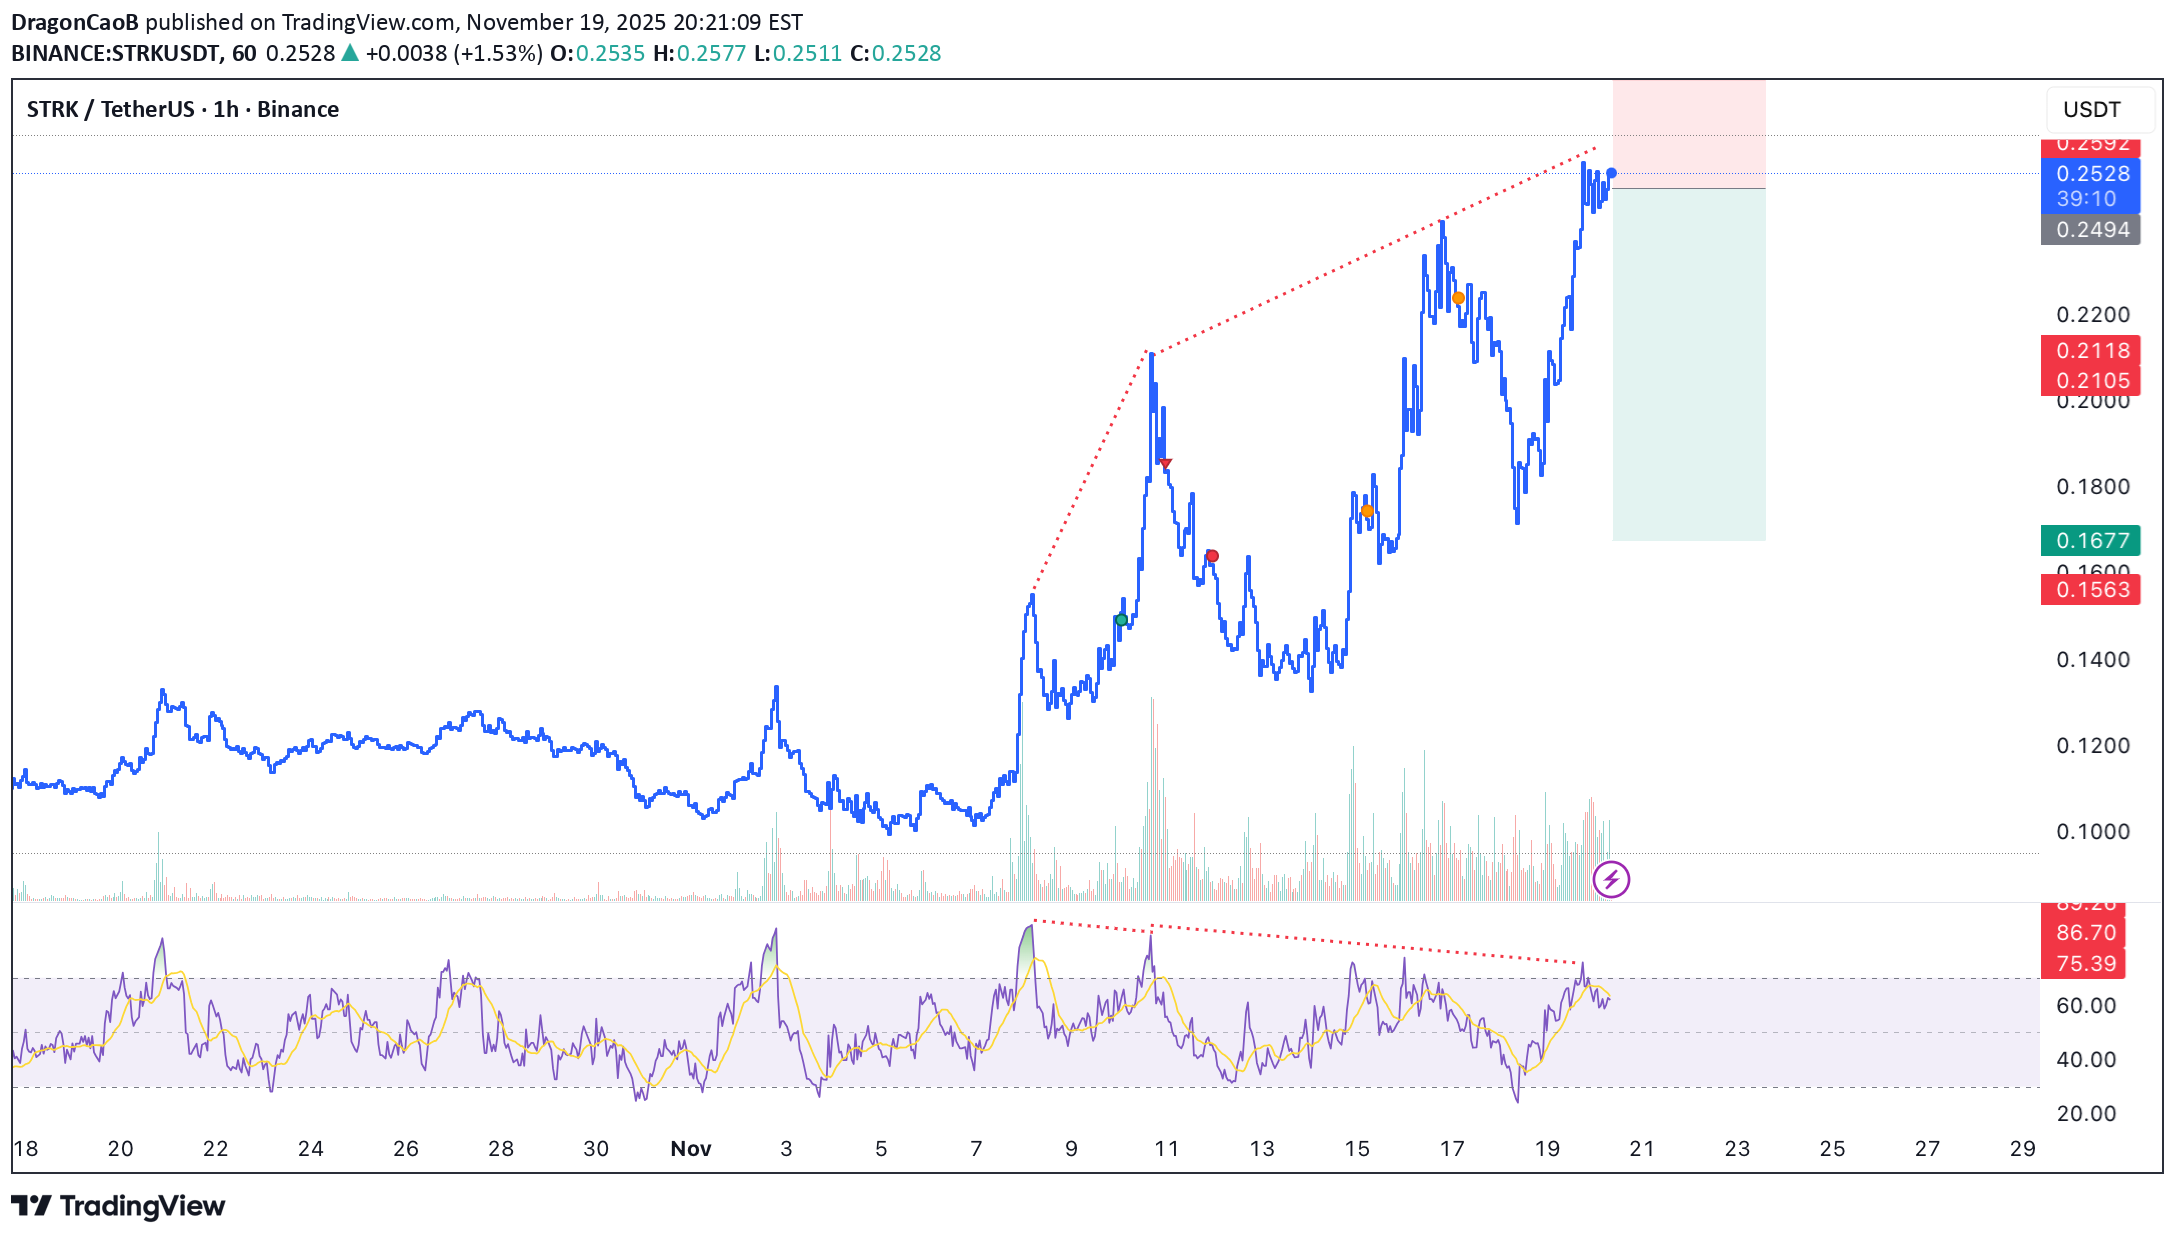
🐻 Scalp SHORT – STRK RSI is extremely overbought on the 1h timeframe, accompanied by two clear bearish divergences, signaling weakening bullish momentum. Price has repeatedly failed to break major resistance, confirming selling pressure is taking control and a downside correction is highly probable. 🎯 Trade Setup: TP: 0.1678 SL: 3.28 RR: 1 : 5.12 A clean short setup: strong bearish divergence, failed breakout attempts, and clear correction signals.
DragonCaoB
سیگنال خرید بیت کوین: آماده جهش بزرگ با این شواهد قدرتمند!

📈 Scalp Long – BTC RSI has printed two strong bullish divergences on the 15m timeframe, signaling clear momentum reversal. Higher timeframes are also deeply oversold, suggesting selling pressure is exhausted. If this isn’t a buy zone, it’s hard to imagine a better one. A recovery bounce is highly probable as liquidity rotates back into the market. 🎯 Trade Setup: Take Profit (TP): 103,490 Stop Loss (SL): 92,945 Risk/Reward Ratio (RR): 1 : 3.39 A disciplined long setup based on multi-timeframe oversold conditions and repeated bullish divergence
DragonCaoB
پیشنهاد خرید قاطع مانا (MANA): فرصت اسکالپ سود سریع با ریسک کنترلشده!
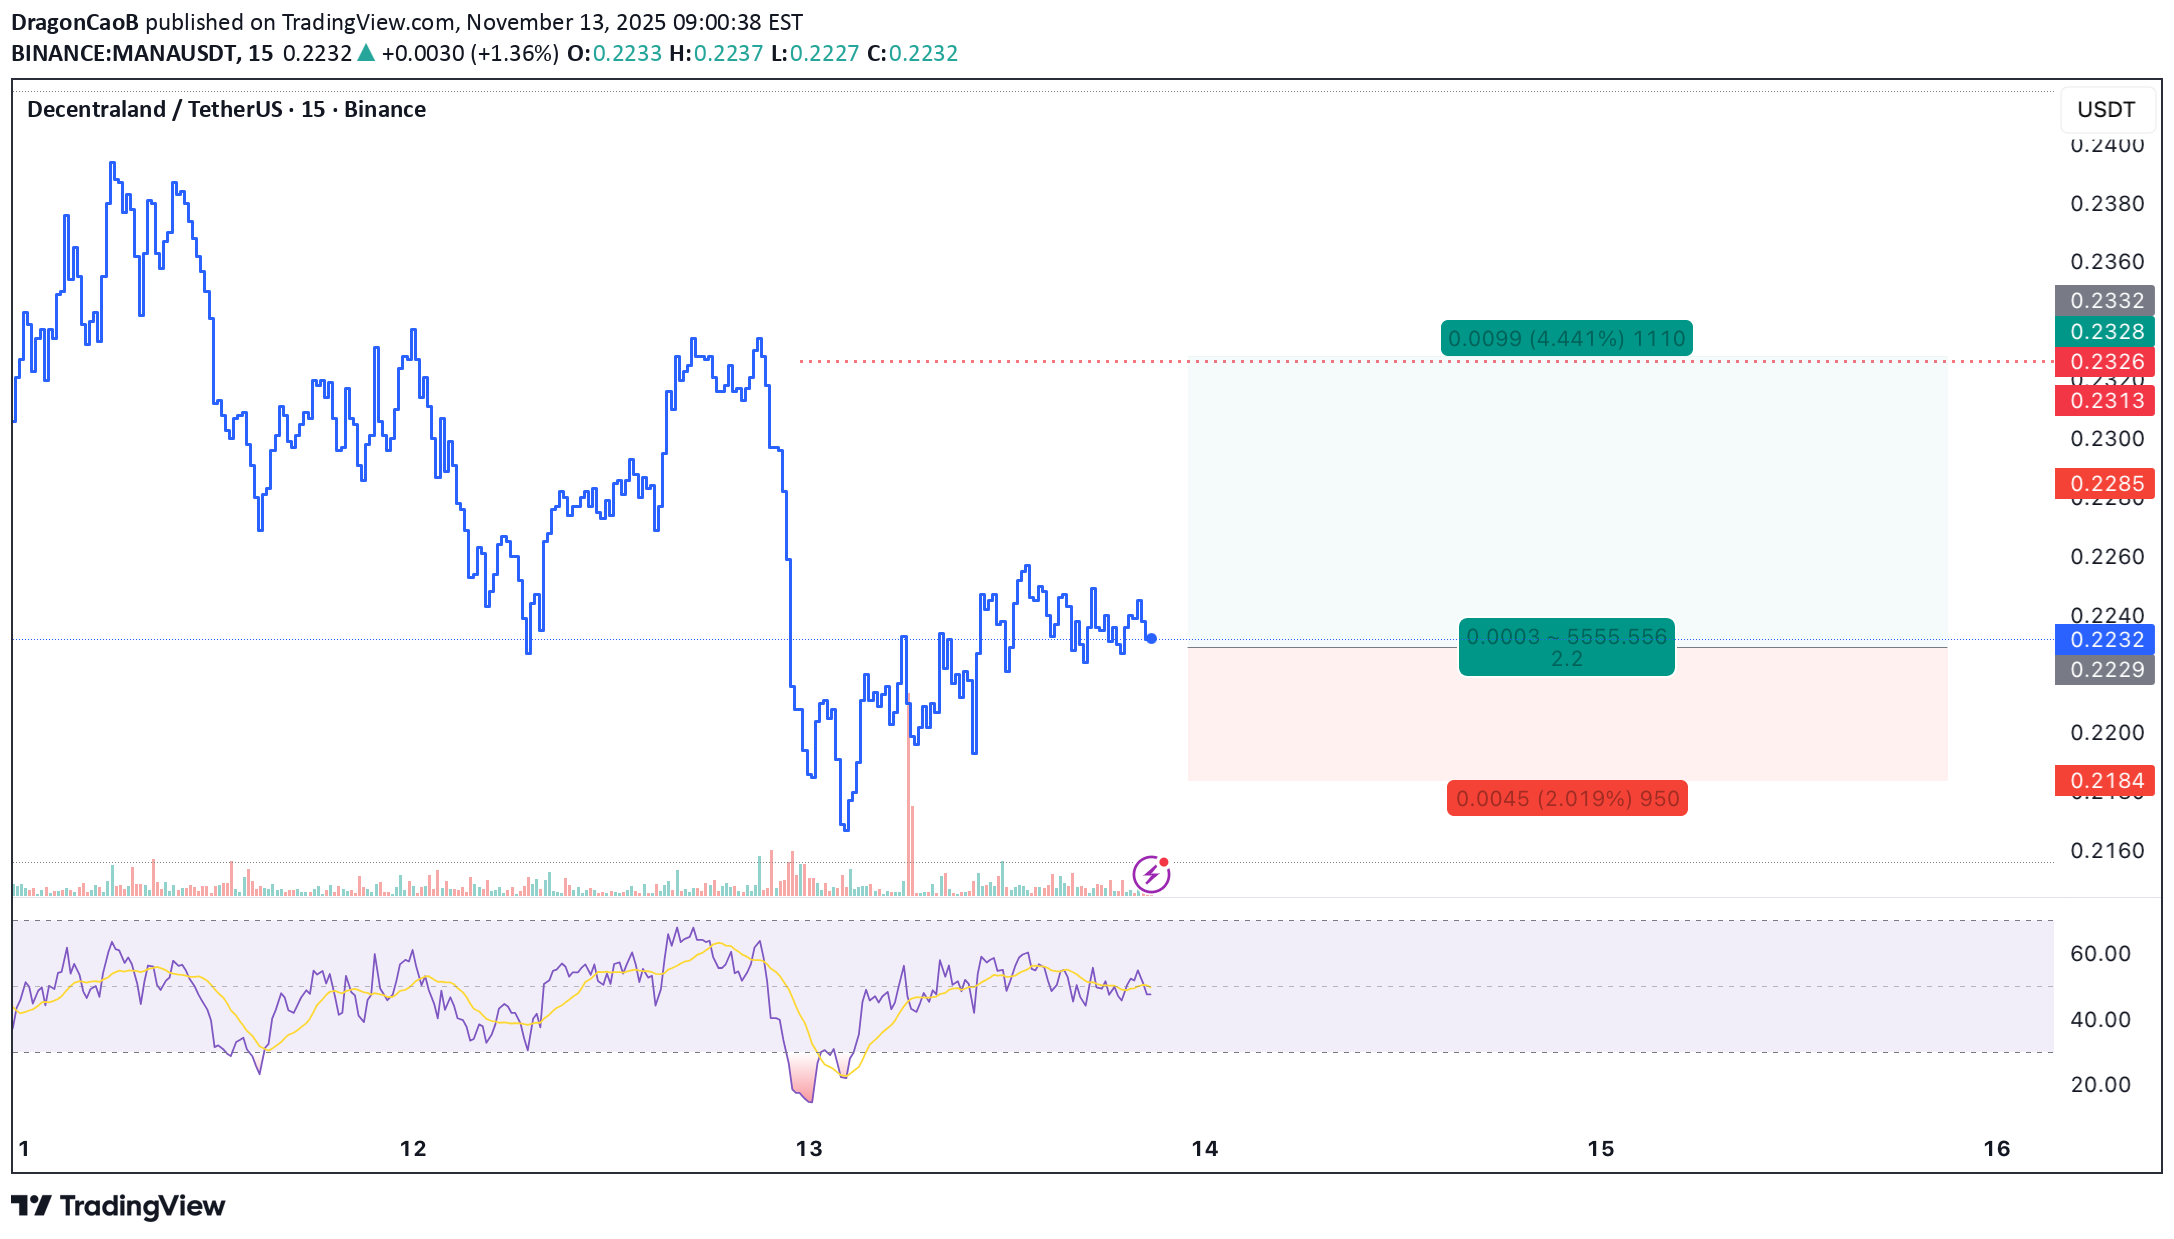
📈 Scalp Long – MANA Price is holding firmly above a strong support zone. Buying pressure has reappeared on the 5m and 15m timeframes, signaling potential upward momentum. A short-term move to retest the local high is likely. 🎯 Trade Setup: Take Profit (TP): 0.2328 Stop Loss (SL): 0.2184 Risk/Reward Ratio (RR): 1 : 2.2 A clean long setup supported by solid demand and renewed bullish momentum — ideal for a precise scalp
DragonCaoB
پیشنهاد معامله خرید (Long) برای MLN: سود ۲ برابری با ریسک کنترلشده!
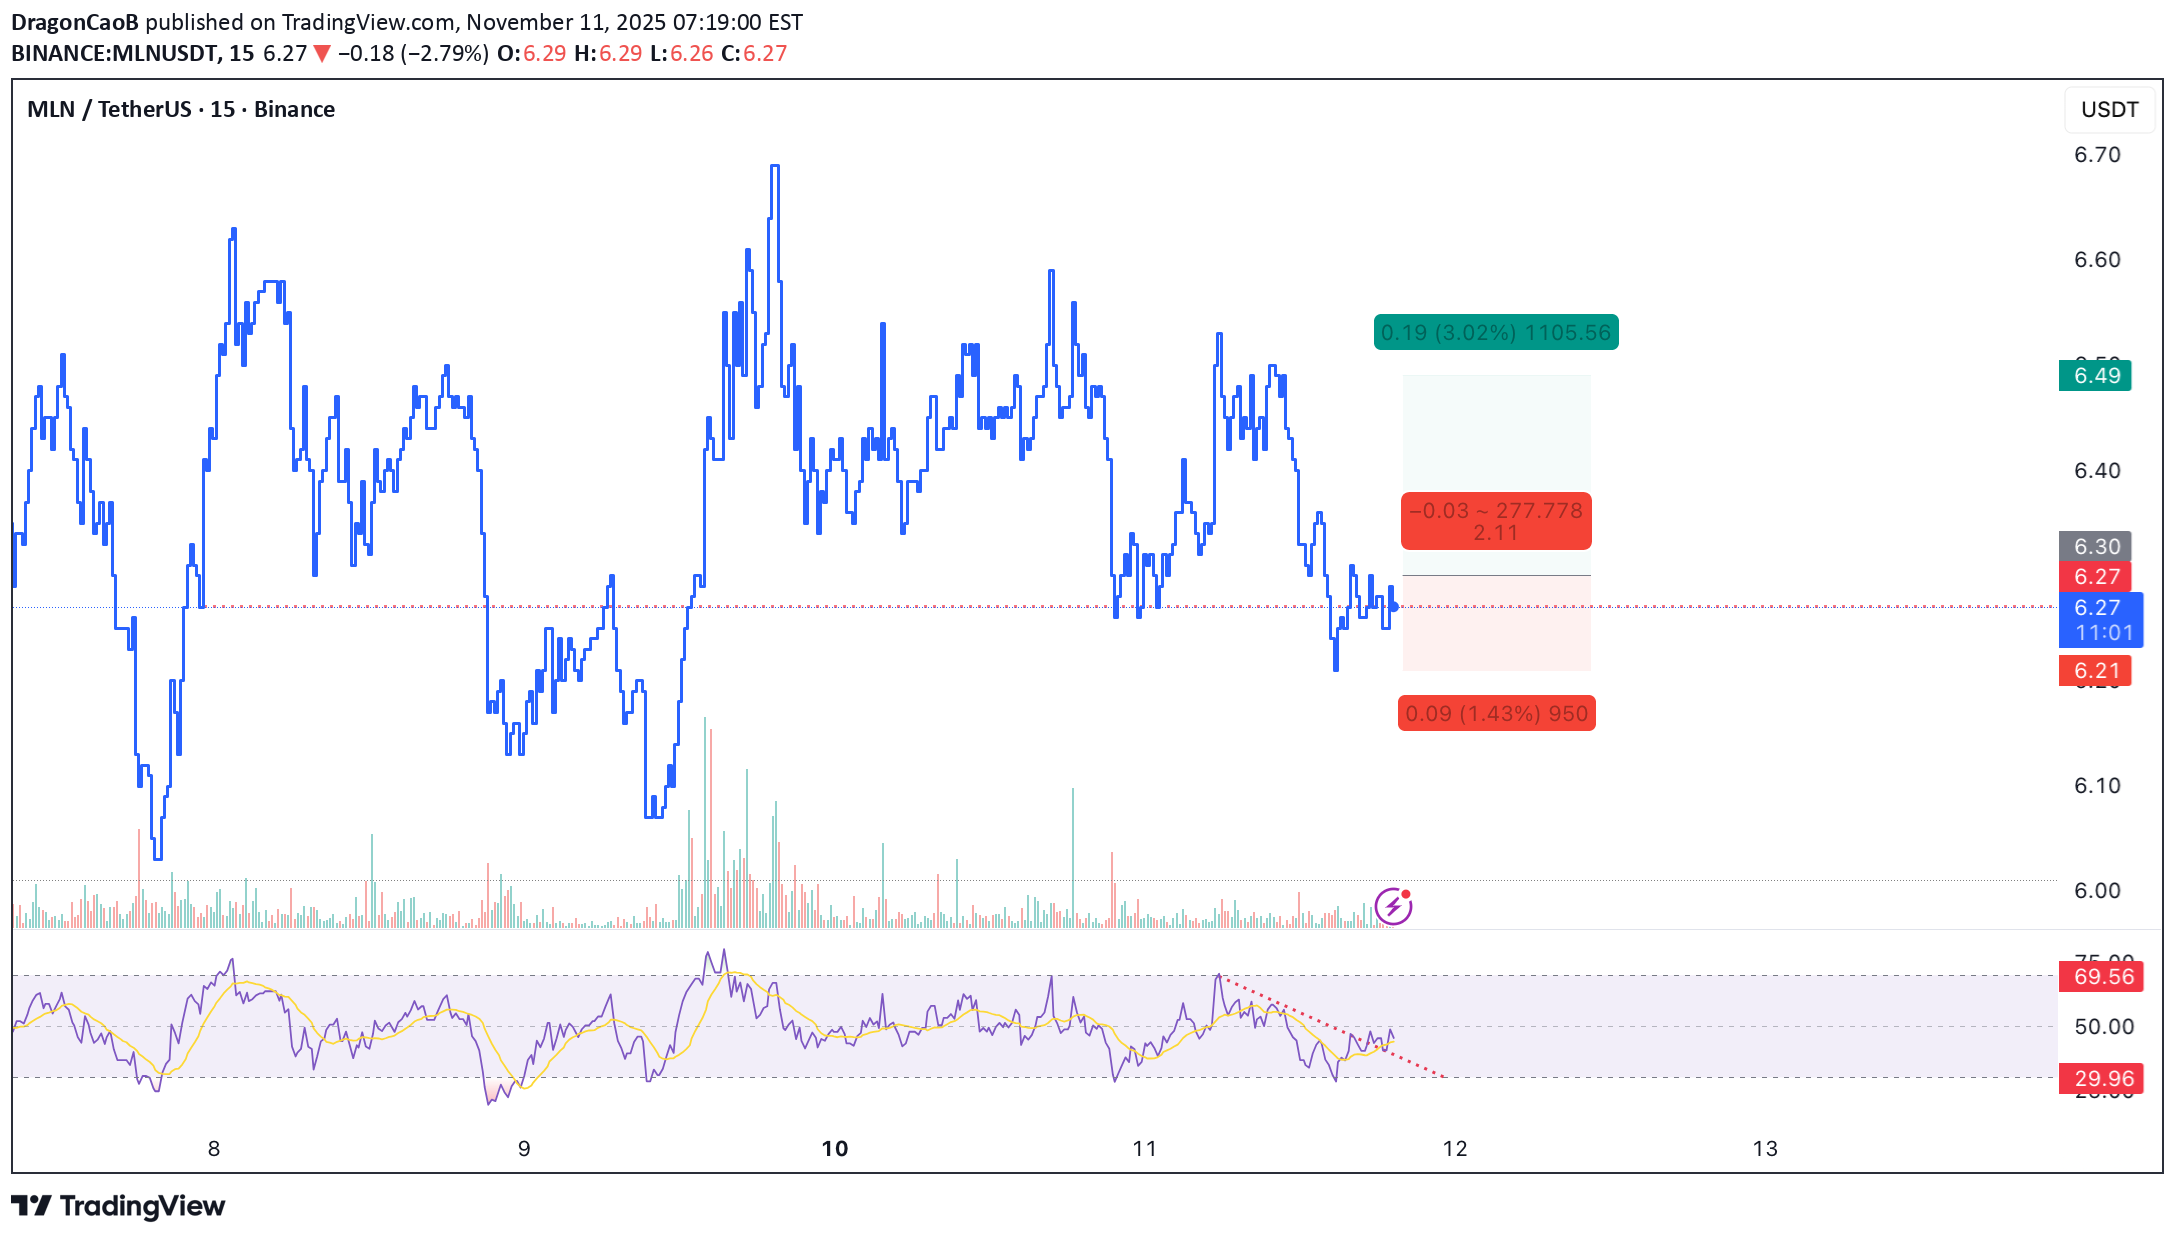
📈 Scalp Long – MLN Strong buying momentum is returning across lower timeframes, and price action indicates a potential move to retest the local high. The price is currently holding above a solid support zone, suggesting a favorable setup for continuation. 🎯 Trade Setup: Take Profit (TP): 6.49 Stop Loss (SL): 6.21 Risk/Reward Ratio (RR): 1 : 2.11 A concise long setup supported by renewed buying pressure and solid structural support.
Disclaimer
Any content and materials included in Sahmeto's website and official communication channels are a compilation of personal opinions and analyses and are not binding. They do not constitute any recommendation for buying, selling, entering or exiting the stock market and cryptocurrency market. Also, all news and analyses included in the website and channels are merely republished information from official and unofficial domestic and foreign sources, and it is obvious that users of the said content are responsible for following up and ensuring the authenticity and accuracy of the materials. Therefore, while disclaiming responsibility, it is declared that the responsibility for any decision-making, action, and potential profit and loss in the capital market and cryptocurrency market lies with the trader.