Technical analysis by AltcoinPiooners about Symbol SUN: Buy recommendation (9/5/2025)

AltcoinPiooners
Explode Your Gains: Epic $SUN Trading Breakthrough Awaits!
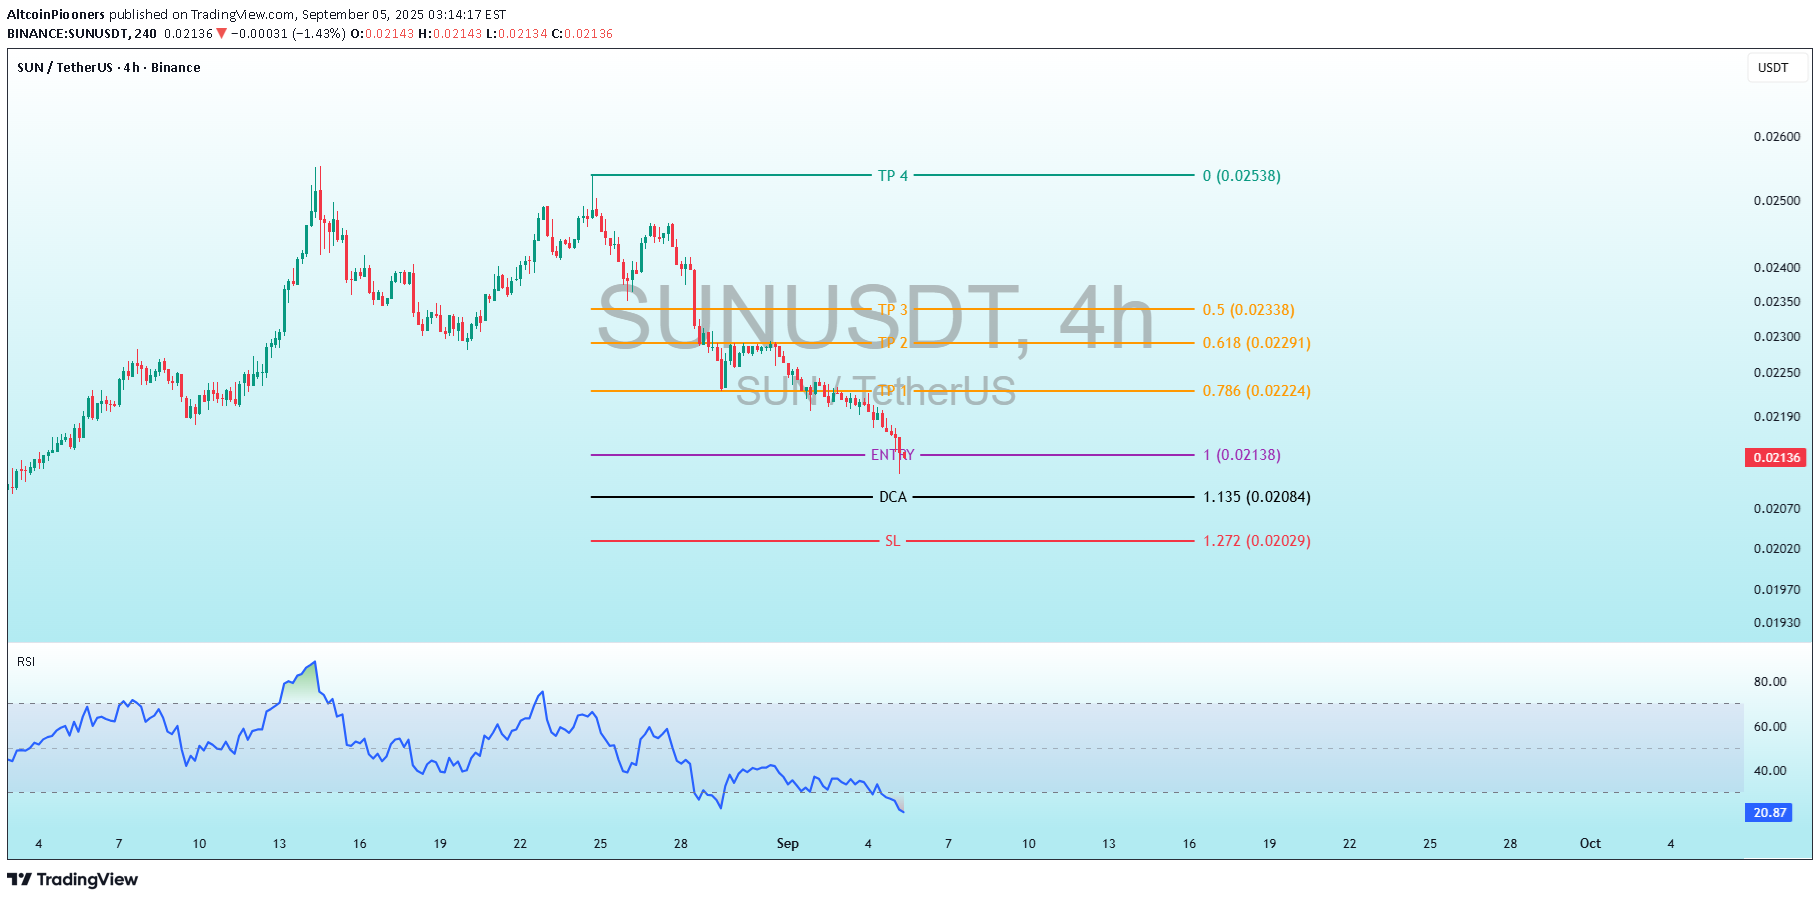
SUNUSDT Explode Your Gains: Epic SUN Trading Breakthrough Awaits! Key Patterns: The uptrend forms a clear parabolic rise with increasing volatility (longer wicks on candles). The downtrend resembles a "dump" phase, with a near-vertical drop, possibly driven by profit-taking or market sentiment shifts. Current price is consolidating near a potential support zone (0.0190–0.0200 USDT), with small-bodied candles indicating indecision. No clear reversal pattern (e.g., hammer or double bottom) is visible yet, but the proximity to marked levels suggests a setup for one. Volatility and Range: The price range over the period is from ~0.0170 USDT (lows) to 0.0600 USDT (highs). Recent action is low-volatility compared to the peak, with the price hugging the lower end. Indicator Analysis: RSI The RSI (14-period) is plotted at the bottom, ranging from 0 to 100, with overbought (>70) and oversold (<30) thresholds marked implicitly (horizontal lines at 80, 60, 40, 20). Behavior: RSI mirrored the price action closely. It spiked to over 80 during the uptrend (overbought, signaling potential exhaustion), then plunged sharply to around 20–25 by early September (oversold, indicating potential buying opportunity). Current Reading: The RSI is at approximately 21 (visible on the right), deep in oversold territory. It has been trending downward but flattening slightly in the recent candles, which could hint at divergence if price stabilizes— a bullish signal if confirmed. Interpretation: Oversold RSI often precedes reversals in trending markets, especially in crypto. However, in strong downtrends, it can remain oversold for extended periods. No clear bullish divergence (RSI higher lows while price makes lower lows) is evident yet, but watch for it as a confirmation of upside. Marked Levels and Trading Strategy The chart includes multiple horizontal lines with labels, colors, and Fibonacci ratios (e.g., 0.786, 1.618), suggesting a Fibonacci-based trading plan for a long position. This is common in crypto trading for projecting targets and risk management. The levels appear anchored from a recent swing low to high (likely the August low to peak). Stop Loss (SL): Red line at 1.272 USDT, labeled "SL" with Fib 1.272 (0.02029) – slight discrepancy in label, possibly a calculation note). This is the risk level where the trade would be invalidated if price breaks lower. Dollar Cost Average (DCA): Black line at 1.135 (1.135 Fib, 0.02004). This suggests adding to the position if price dips further, averaging down the entry cost. Entry: Purple line at 1 (1.0 Fib, 0.02140-0.02135). This is the primary buy level, where the trader would enter a long position. Current price is very close or slightly below this, making it active or imminent. Take Profit (TP) Levels: Multiple orange and cyan lines upward, labeled with Fib extensions (e.g., 0.786, 1.618, 3.0, 4.618, 5.0) and prices: TP1: ~0.02224 USDT (0.786 Fib, 0.02224) TP2: ~0.02291 USDT (1.618 Fib, 0.02291) TP3: ~0.02338 USDT (likely 3.0 or 4.0 Fib, 0.02338) TP4: Cyan at 0 (extended target 0.02538 USDT, possibly 5.0 Fib or the previous high).