
QNT
Quant
| تریدر | نوع سیگنال | حد سود/ضرر | زمان انتشار | مشاهده پیام |
|---|---|---|---|---|
خرید | حد سود: تعیین نشده حد ضرر: تعیین نشده | 12/10/2025 | ||
خرید | حد سود: تعیین نشده حد ضرر: تعیین نشده | 12/9/2025 | ||
خرید | حد سود: تعیین نشده حد ضرر: تعیین نشده | 12/4/2025 | ||
خرید | حد سود: تعیین نشده حد ضرر: تعیین نشده | 11/30/2025 | ||
خرید | حد سود: تعیین نشده حد ضرر: تعیین نشده | 11/29/2025 |


Price Chart of Quant
سود 3 Months :
سیگنالهای Quant
Filter
Sort messages by
Trader Type
Time Frame

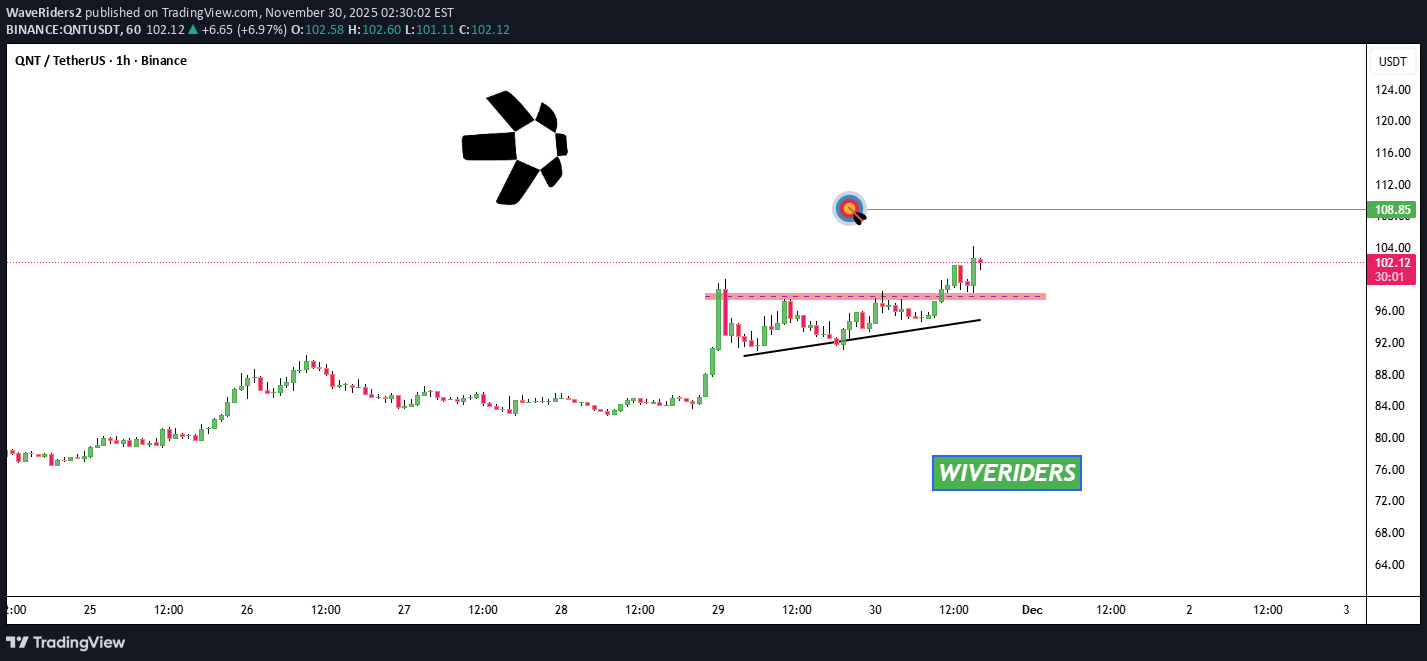
QNT's Big Move Is Coming!
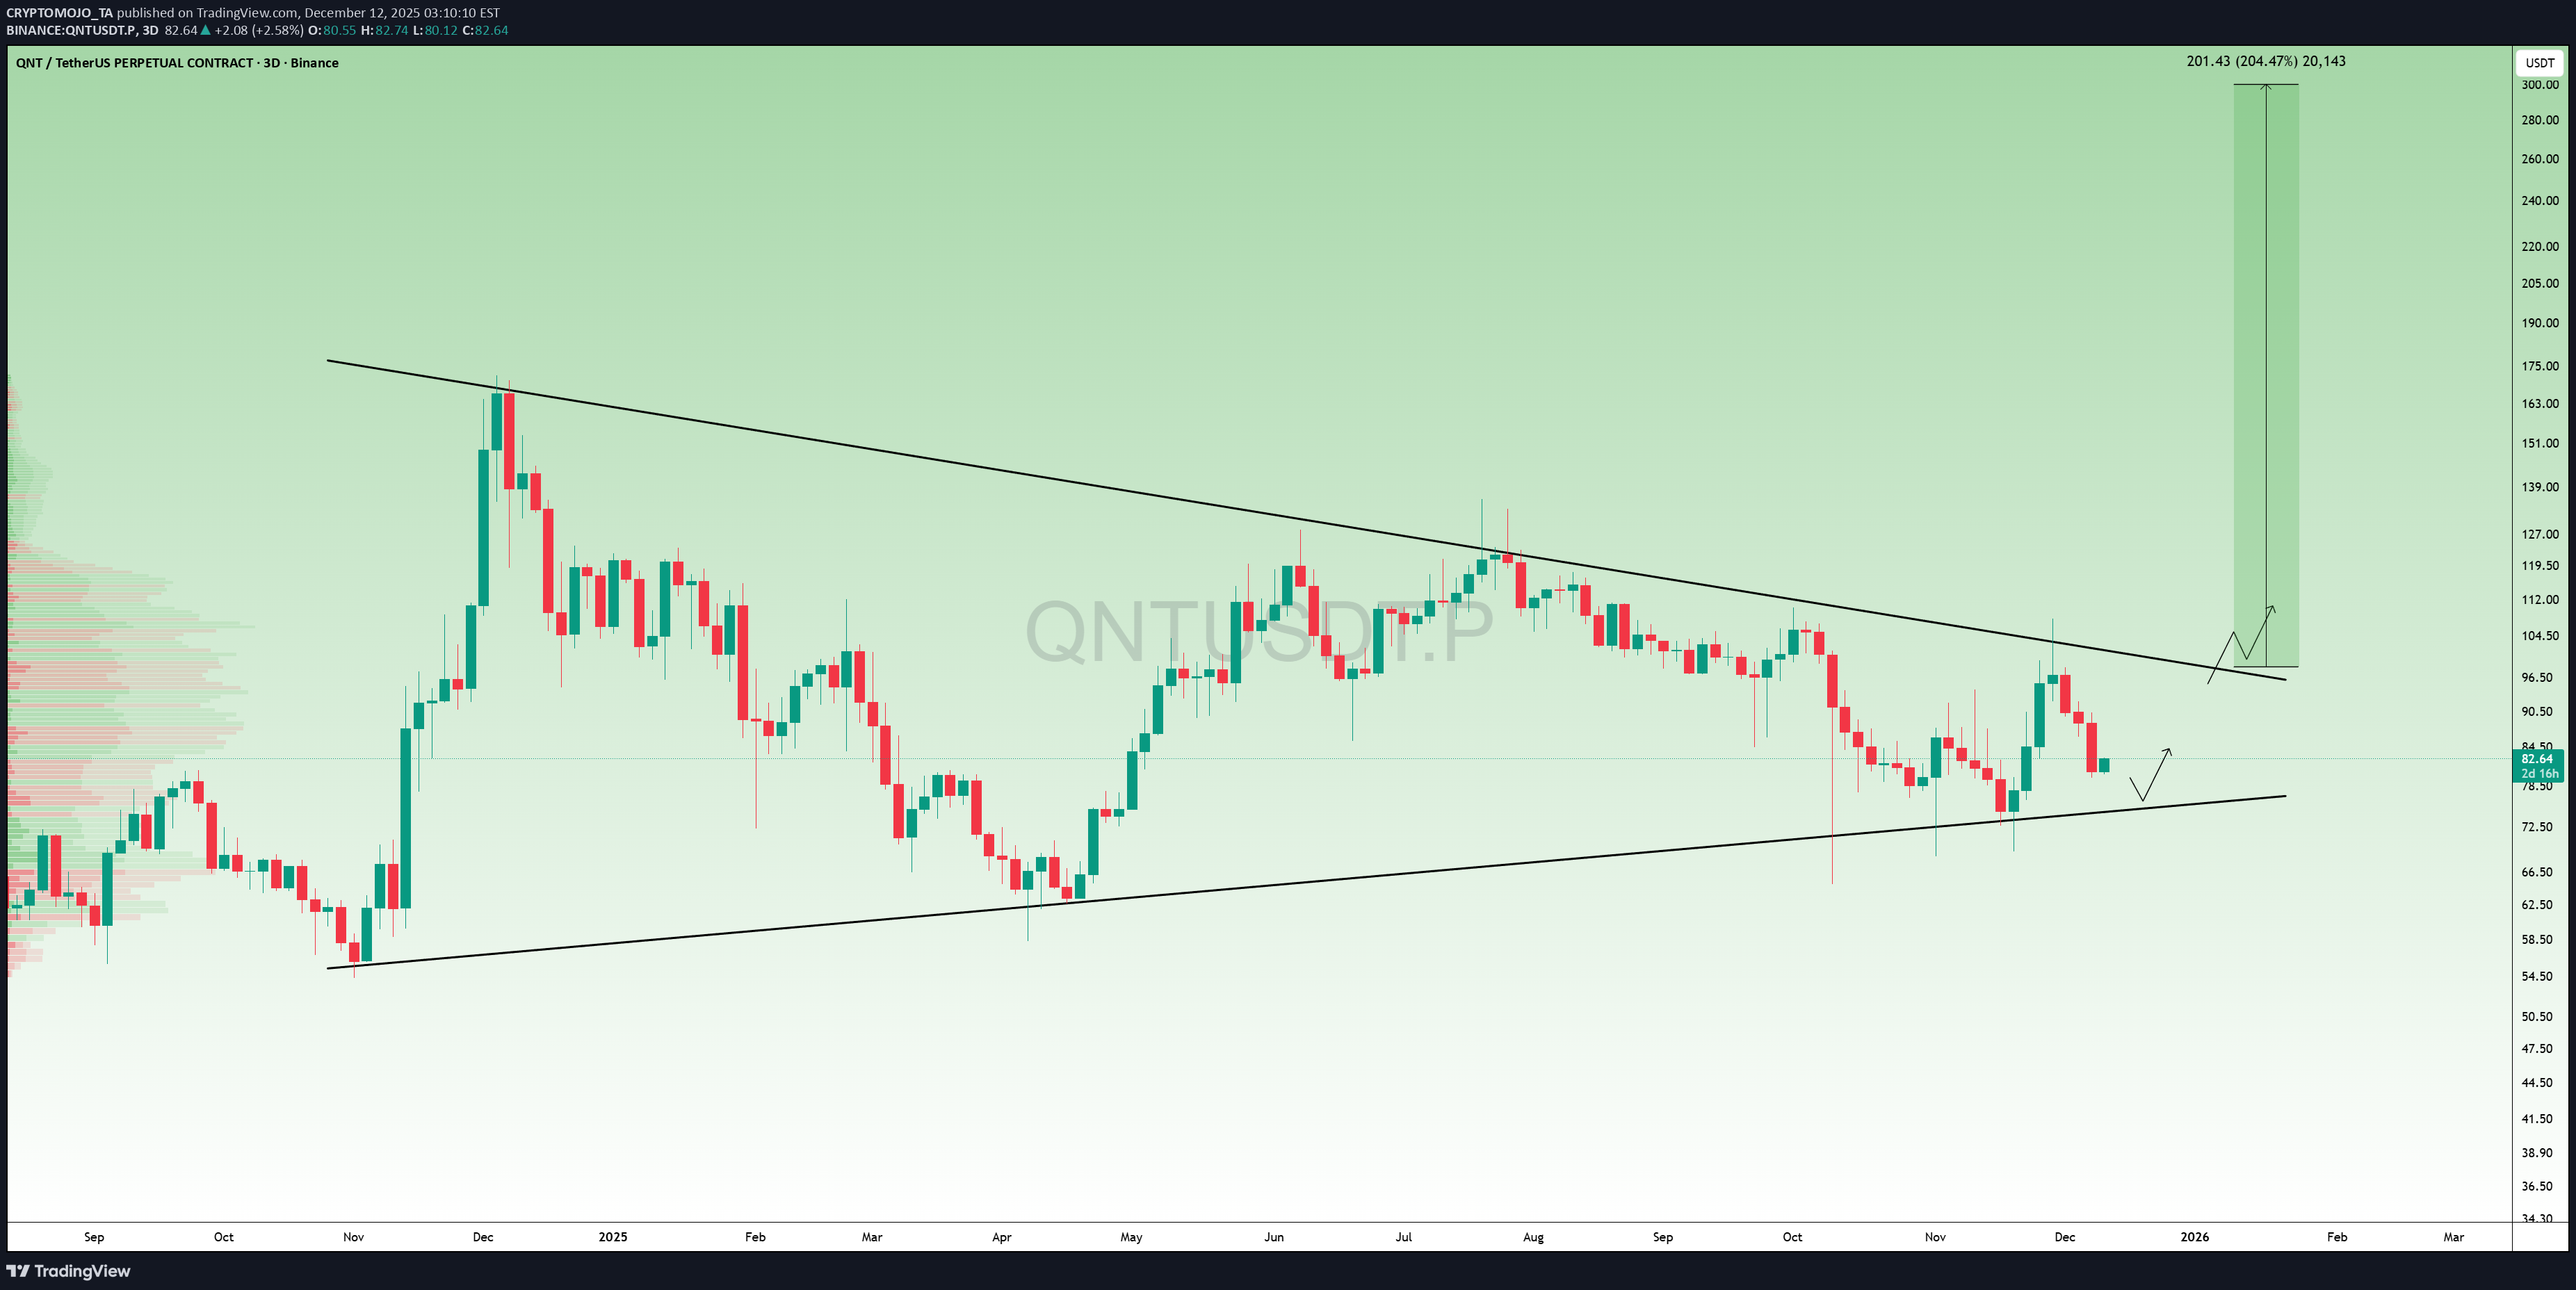
QNT is quietly forming one of the cleanest macro patterns in the market. Price has been squeezing inside this huge falling wedge for over a YEAR… And every time QNT touched the bottom trendline, it bounced hard. Now we’re getting close to the breakout zone. A breakout from here points to a 200% move toward the $250–$300 range. Not financial advice just respecting the chart. This one might surprise a LOT of people.
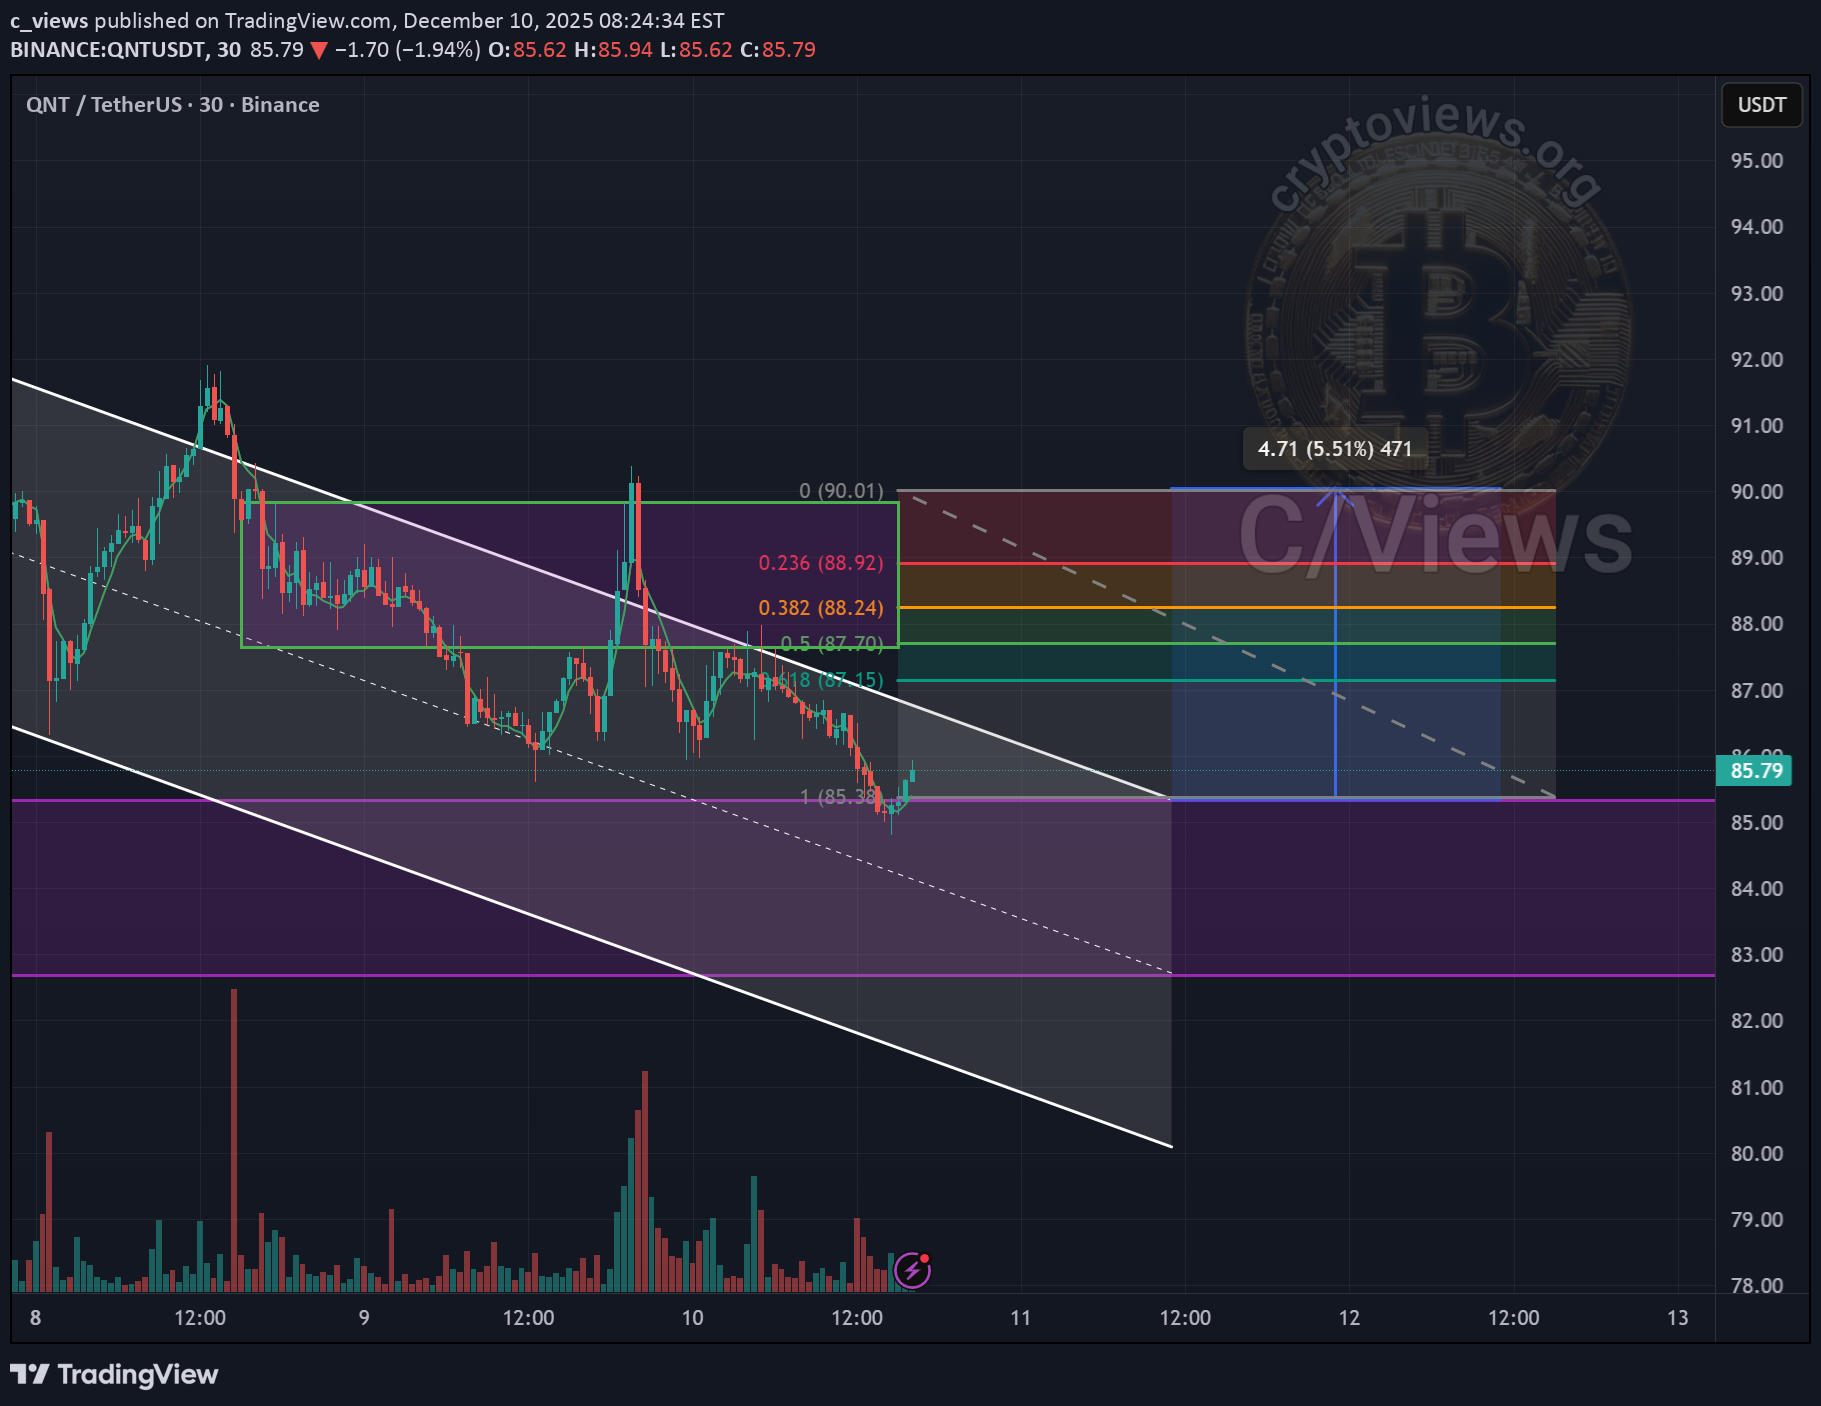
#QNT/USDT — Rebound from Historical Zone or Breakdown into Aby
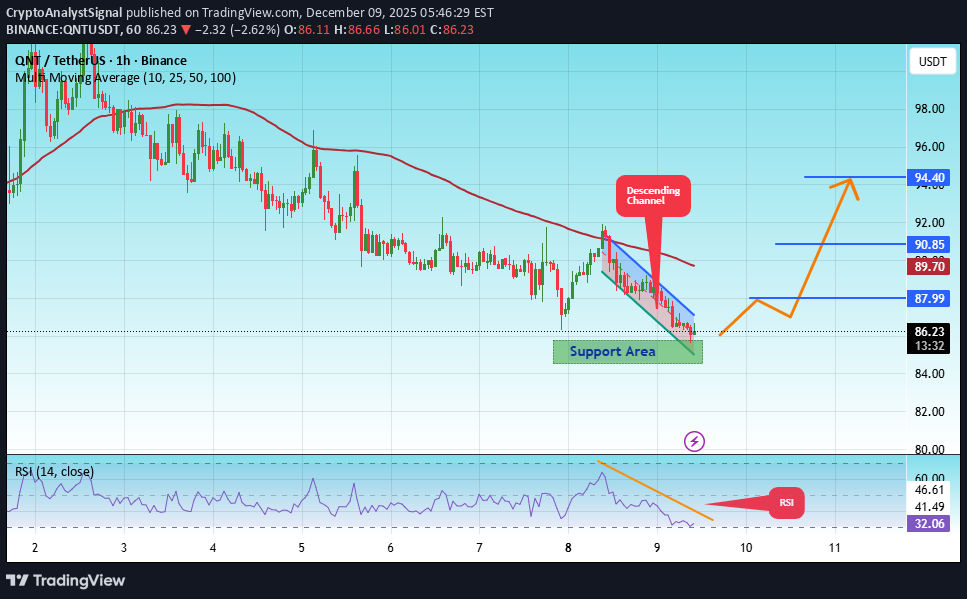
#QNT The price is moving in a descending channel on the 1-hour timeframe. It has reached the lower boundary and is heading towards breaking above it, with a retest of the upper boundary expected. We have a downtrend on the RSI indicator, which has reached near the lower boundary, and an upward rebound is expected. There is a key support zone in green at 85.00. The price has bounced from this level multiple times and is expected to bounce again. We have a trend towards consolidation above the 100-period moving average, as we are moving close to it, which supports the upward movement. Entry price: 86.33 First target: 88.00 Second target: 90.85 Third target: 94.40 Don't forget a simple principle: money management. Place your stop-loss below the support zone in green. For any questions, please leave a comment. Thank you.

هشدار جدی: الگوی سر و شانه در نمودار کوانتوم (QNT) | احتمال سقوط به زیر ۷۰ دلار!
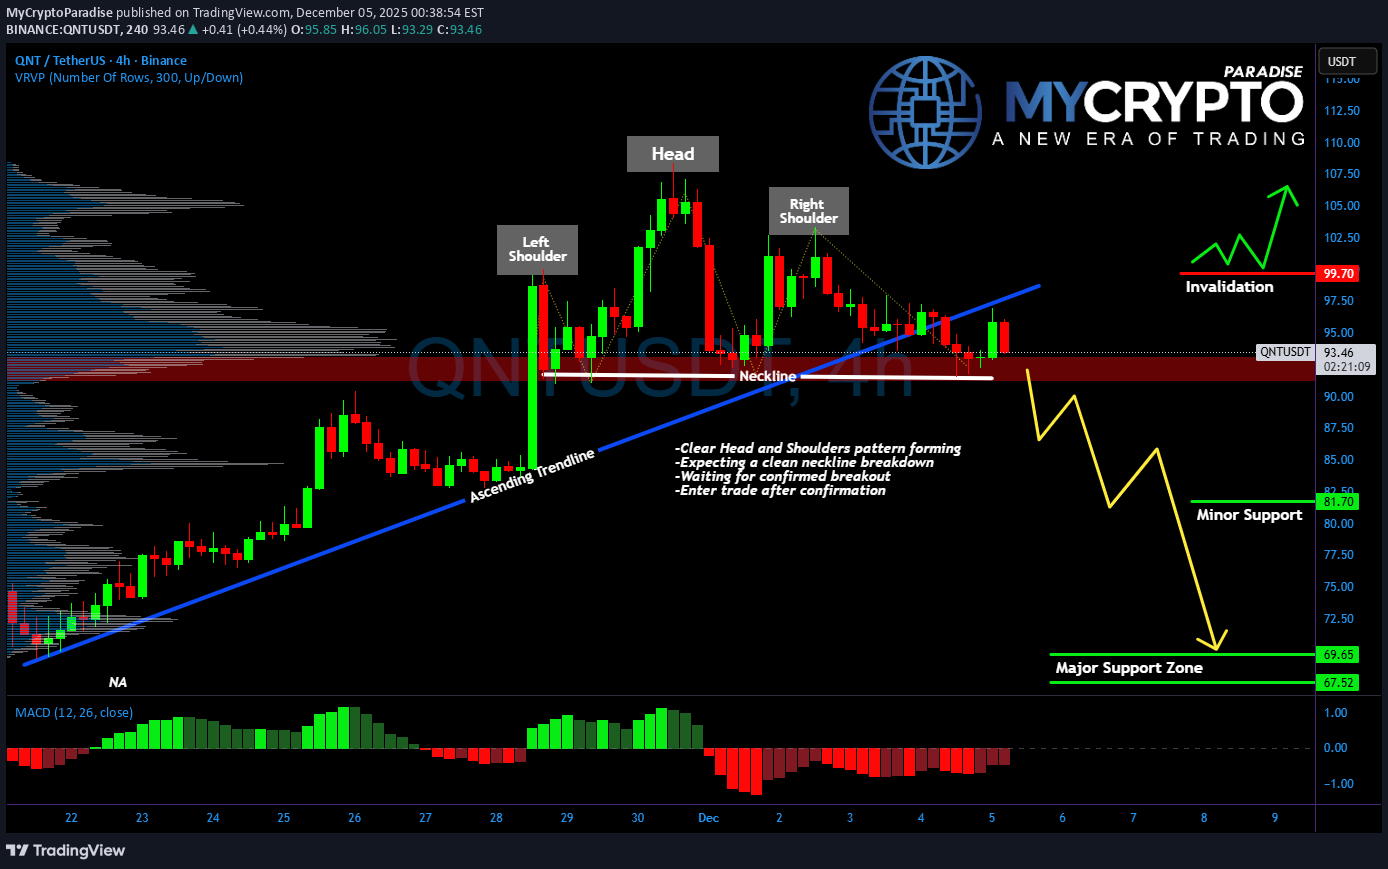
Yello Paradisers! Have you seen what’s forming on #QNT’s chart? A clean Head and Shoulders pattern is developing, and it’s signaling that a major move could be just around the corner. 💎The structure shows clear bullish exhaustion, with the left shoulder, head, and right shoulder all forming under weakening momentum. Price is now pressing directly against the neckline supports the final barrier before a potential trend reversal. 💎Adding fuel to the fire, #QNT has already broken below its ascending trendline, confirming that buyers are losing grip. If we get a confirmed close below the neckline with volume, the bearish setup becomes active, opening the door to more downside. 💎The first area to watch is 81.70, a minor support where short-term buyers may react. But the main downside target sits between 69.65 and 67.52, a strong historical demand zone and high-volume area that could attract heavier bids. 💎As long as QNT stays below 99.70, the bearish outlook holds. A reclaim of that level would invalidate the pattern and give bulls another shot at pushing higher. Stay sharp, the setup is clean, but it’s also a classic trap zone. MyCryptoParadise iFeel the success🌴💎#QNTUSDT Hits a 12.98%– All According to Plan
آیا کوآنت (QNT) در آستانه انفجار قیمتی است؟ پایان الگوی مثلث صعودی!
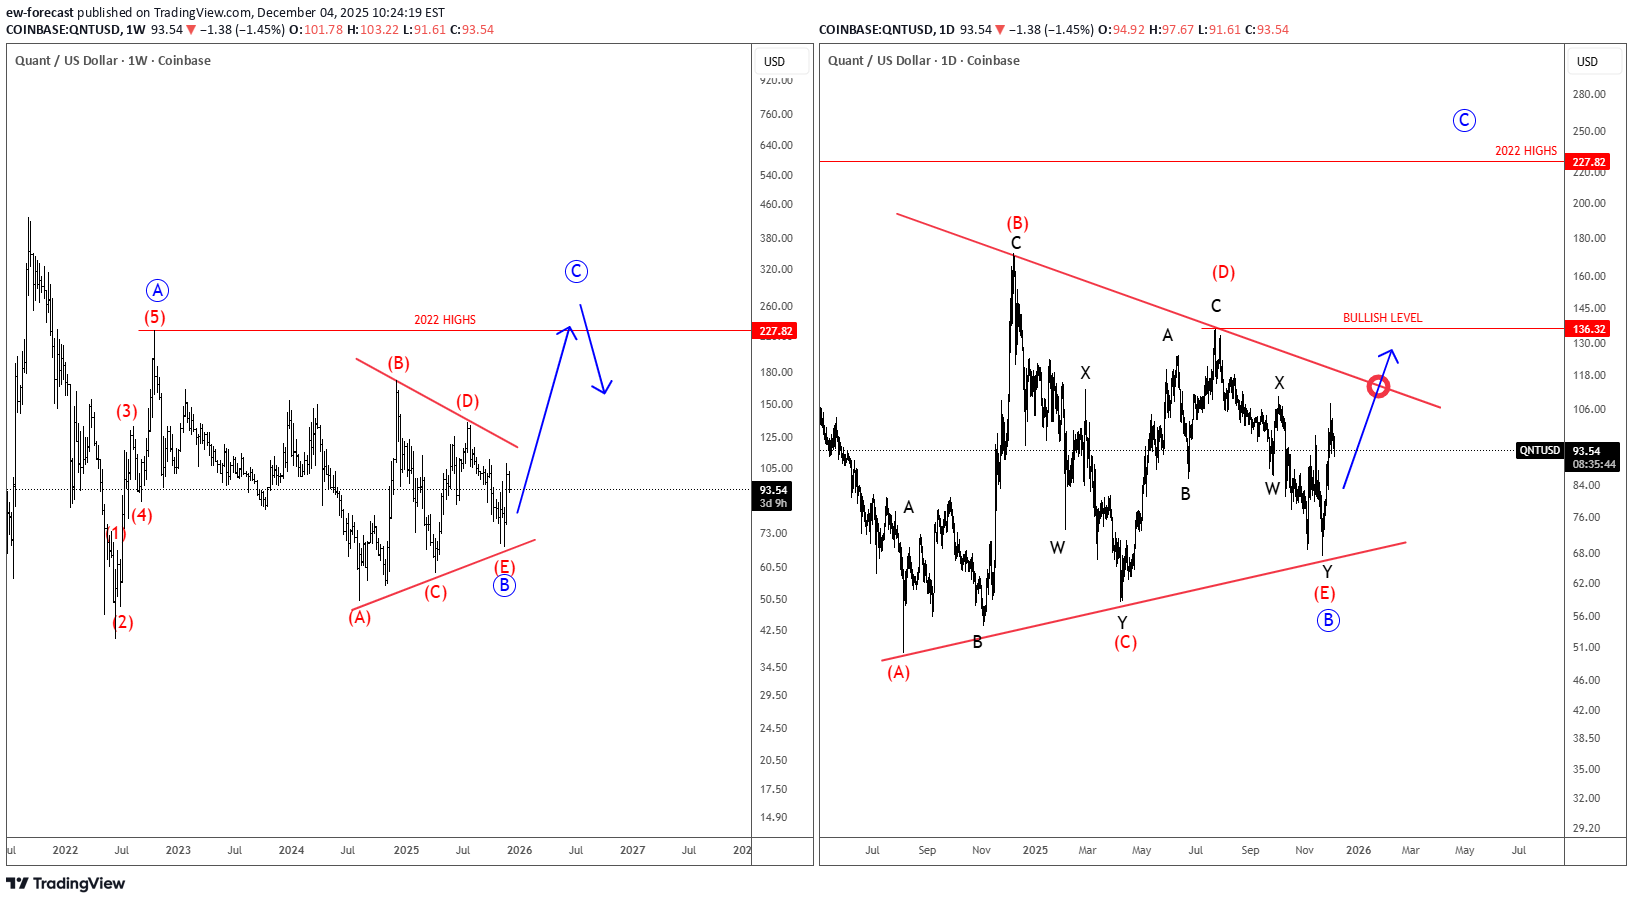
Quant Network is a blockchain interoperability project that lets different blockchains communicate with each other. Its operating system, Overledger, allows developers and businesses to build apps that can run across multiple blockchains at the same time. The token QNT is used to access and pay for Overledger services. Quant with ticker QNTUSD is still holding up well above the lower triangle line, so bulls are still here. On the weekly basis, we can now see it finishing a bullish triangle pattern in wave B before we may see another rally for wave C. On a daily chart, it may actually have a completed complex W-X-Y decline within final wave (E) of B, but bullish confirmation for wave C is only above the upper triangle line and 136 level.

تئوری امواج الیوت برای مبتدیان: چطور با جهتگیری بازار سود کنید؟
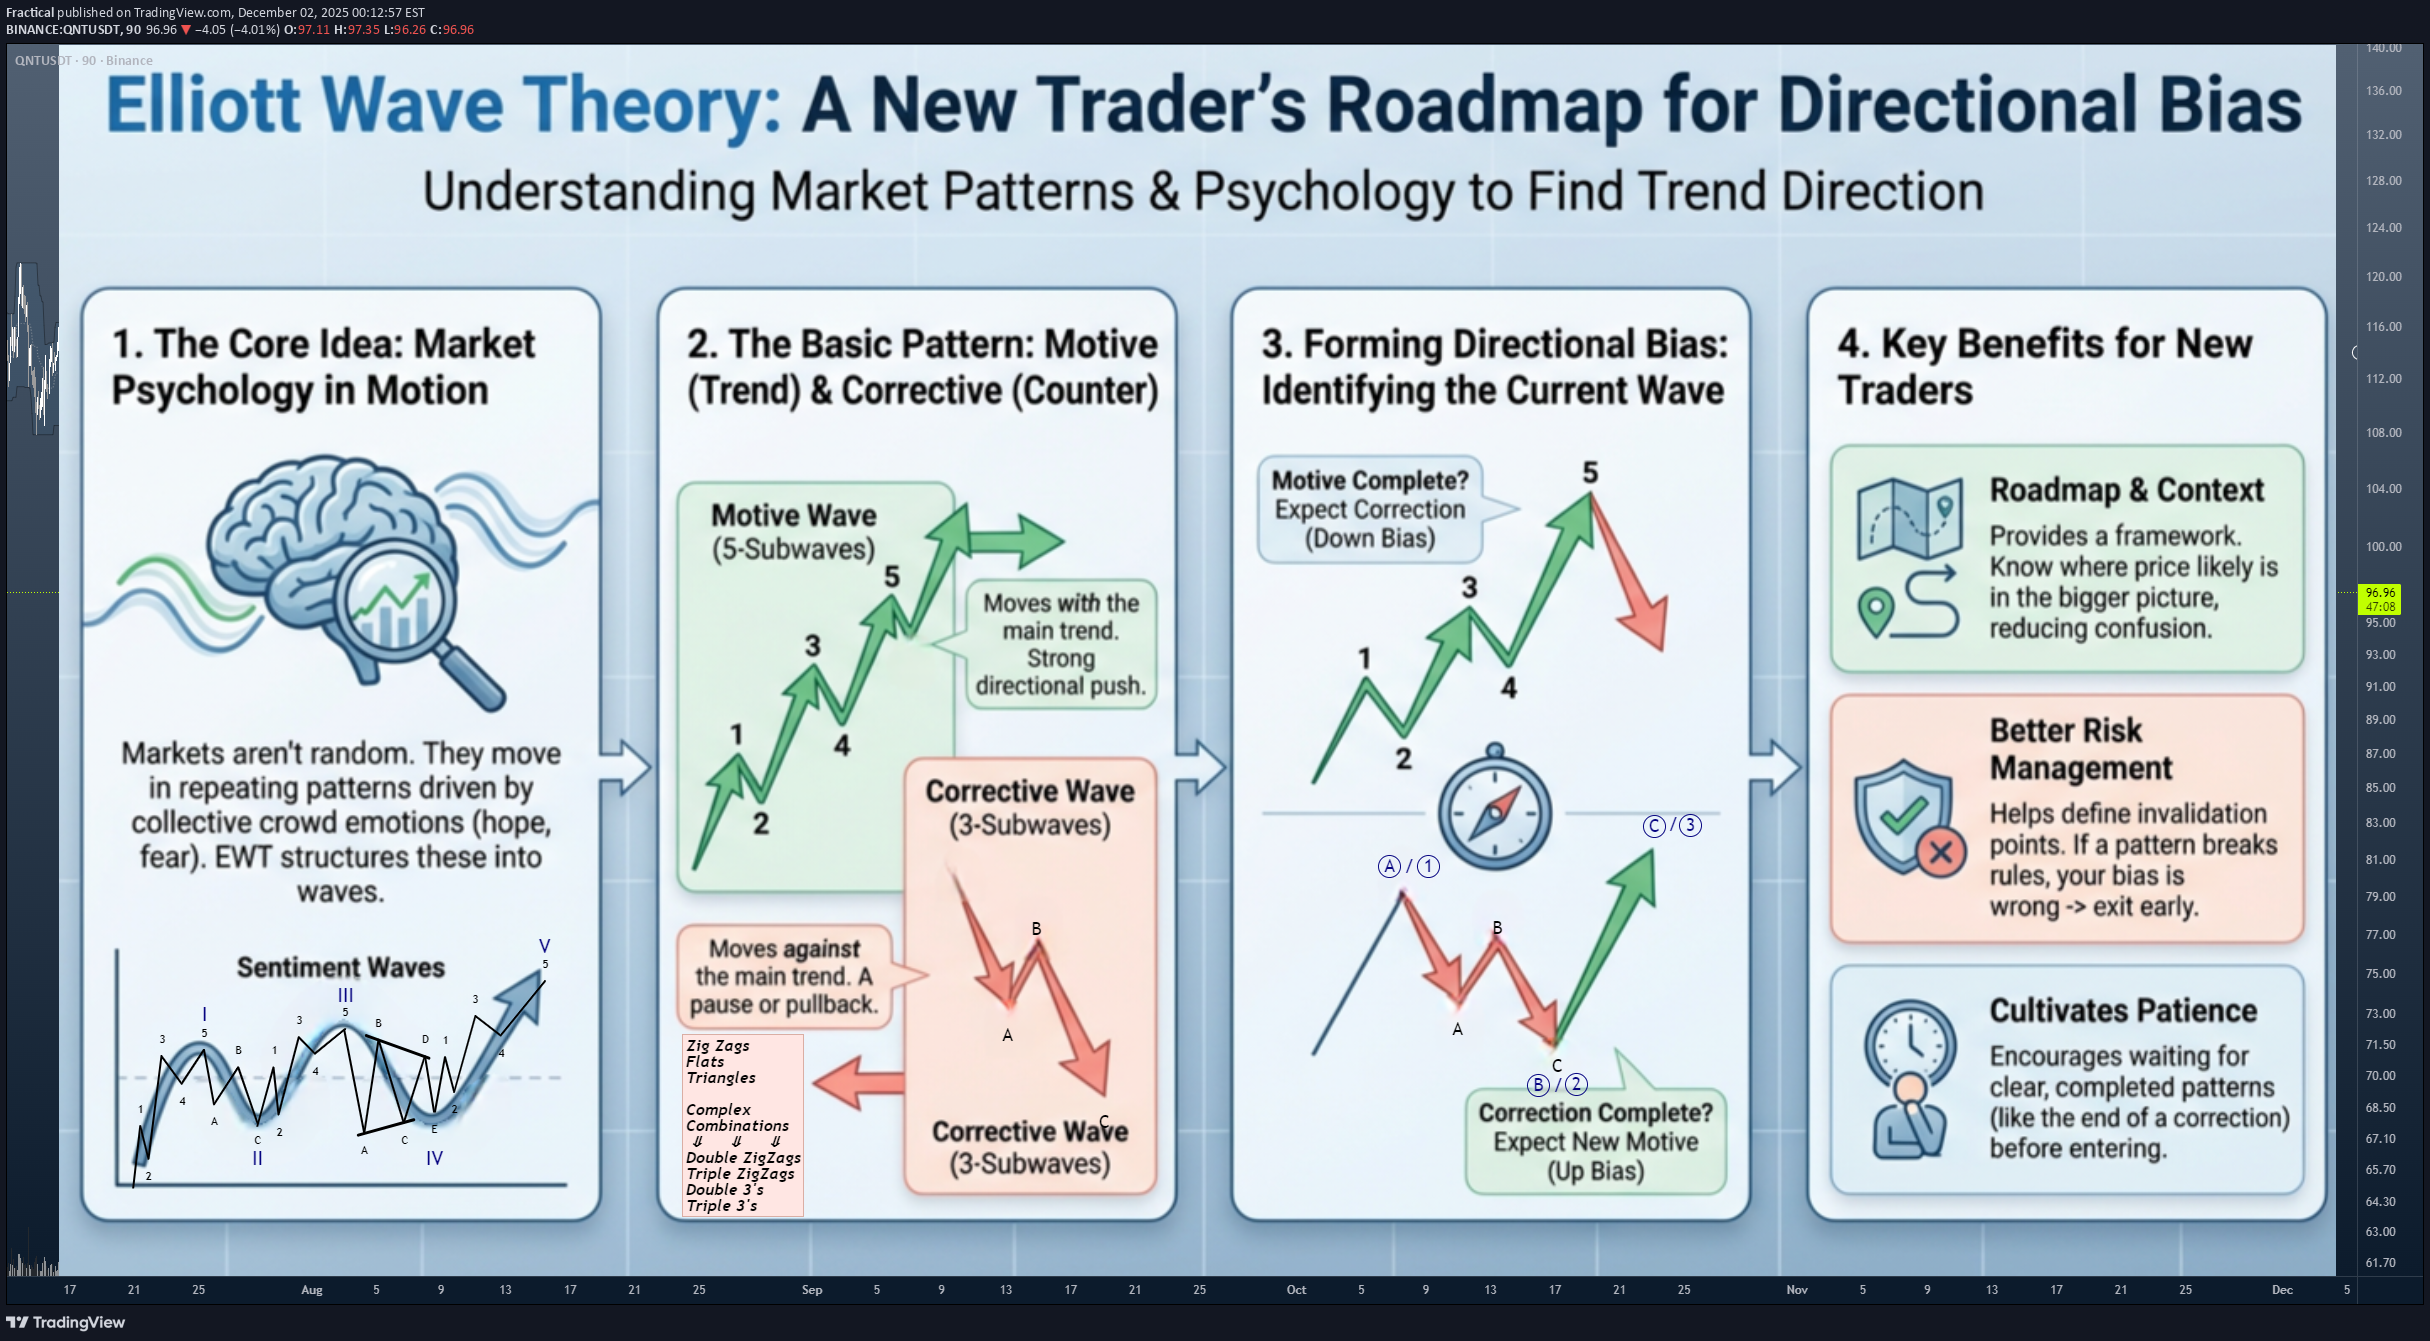
Here is a brief visual roadmap showing how a beginner to the wave theory can still access the main benefit of EW Theory... Directional Bias! That thing that keeps you in profit and with the trend, even if you misdiagnose a pattern or have an errant wave count. I've highlighted some of the key benefits to having the correct directional bias and some of the most important properties of using The Elliott Wave Theory as a beginner! I hope this is helpful to someone, if you are struggling with your current trading system or methodology or just someone who needs a different approach, dig into the Elliott Wave Principal as this "Theory" has no doubt changed my life for the better! For Educational Purposes Only.
الگوی صعودی مخفی کوانت (QNT): منتظر انفجار قیمتی 50 تا 60 درصدی باشید!
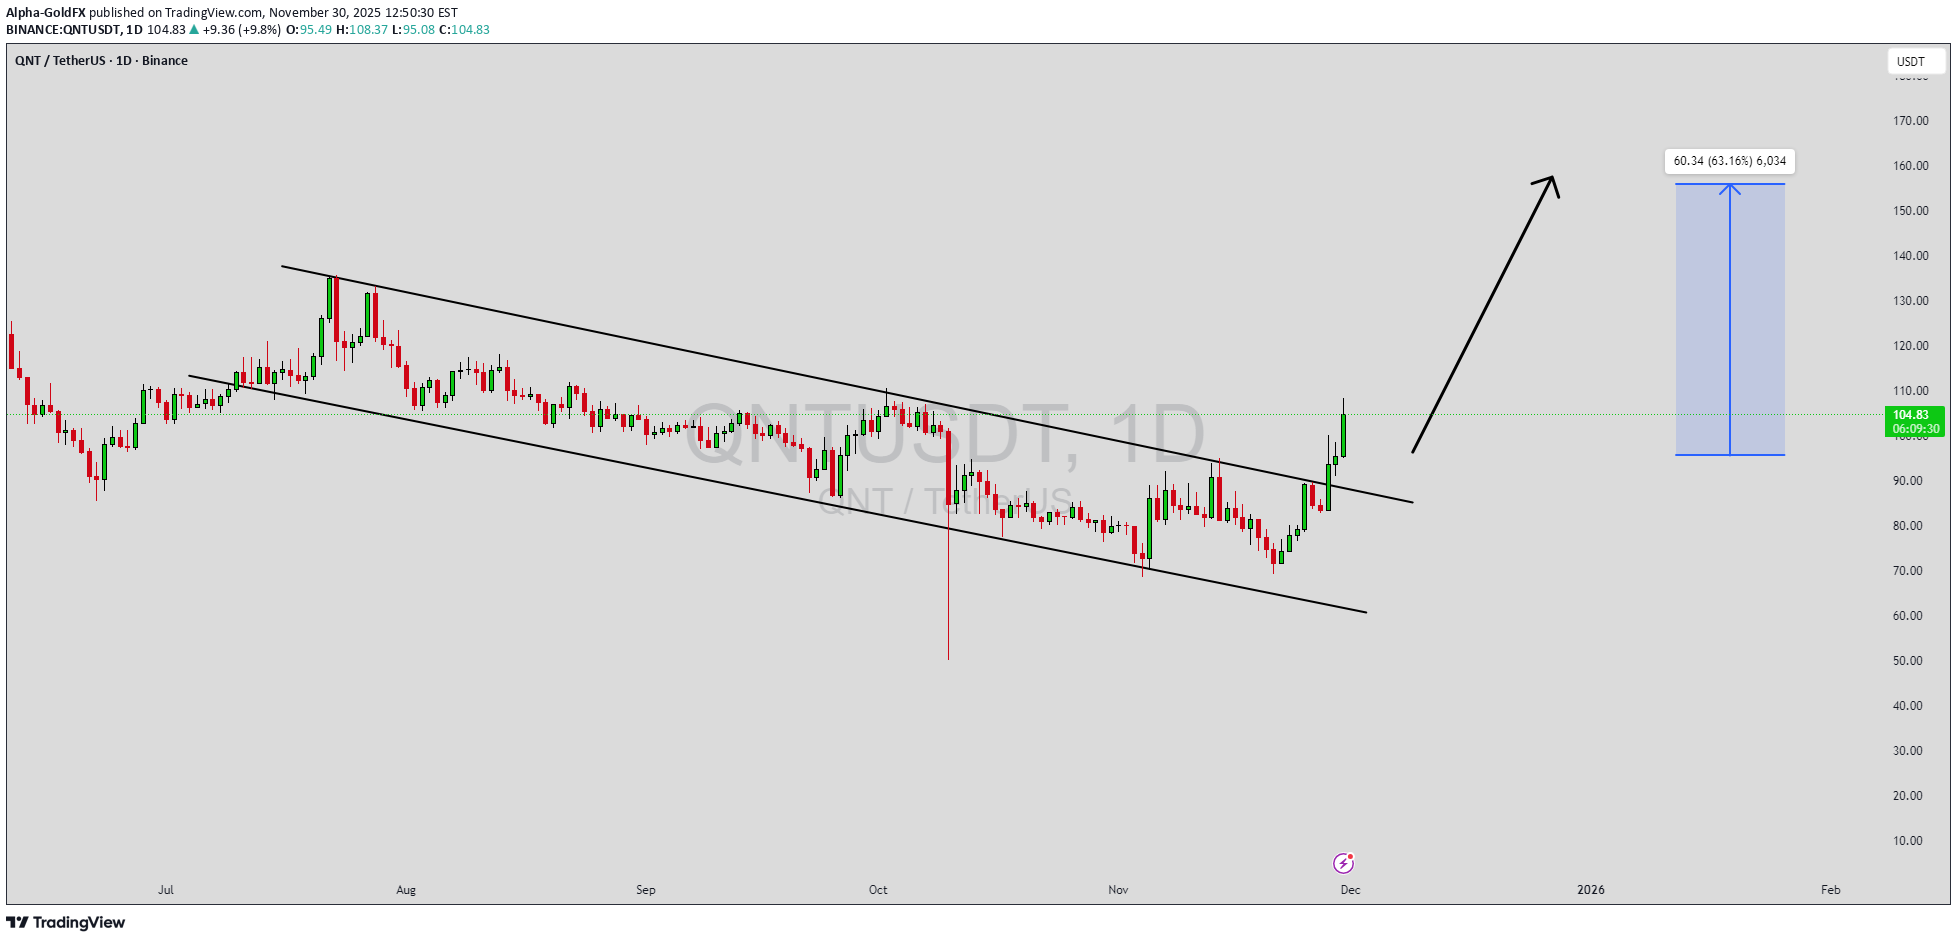
QNTUSDT is forming a clear falling wedge pattern, a classic bullish reversal signal that often indicates an upcoming breakout. The price has been consolidating within a narrowing range, suggesting that selling pressure is weakening while buyers are beginning to regain control. With consistent volume confirming accumulation at lower levels, the setup hints at a potential bullish breakout soon. The projected move could lead to an impressive gain of around 50% to 60% once the price breaks above the wedge resistance. This falling wedge pattern is typically seen at the end of downtrends or corrective phases, and it represents a potential shift in market sentiment from bearish to bullish. Traders closely watching QNTUSDT are noting the strengthening momentum as it nears a breakout zone. The good trading volume adds confidence to this pattern, showing that market participants are positioning early in anticipation of a reversal. Investors’ growing interest in QNTUSDT reflects rising confidence in the project’s long-term fundamentals and current technical strength. If the breakout confirms with sustained volume, this could mark the start of a fresh bullish leg. Traders might find this a valuable setup for medium-term gains, especially as the wedge pattern completes and buying momentum accelerates. ✅ Show your support by hitting the like button and ✅ Leaving a comment below! (What is your opinion about this Coin?) Your feedback and engagement keep me inspired to share more insightful market analysis with you!

پیشبینی صعودی کوانت (QNT): منتظر شکست حمایت و نقطه ورود ایدهآل!
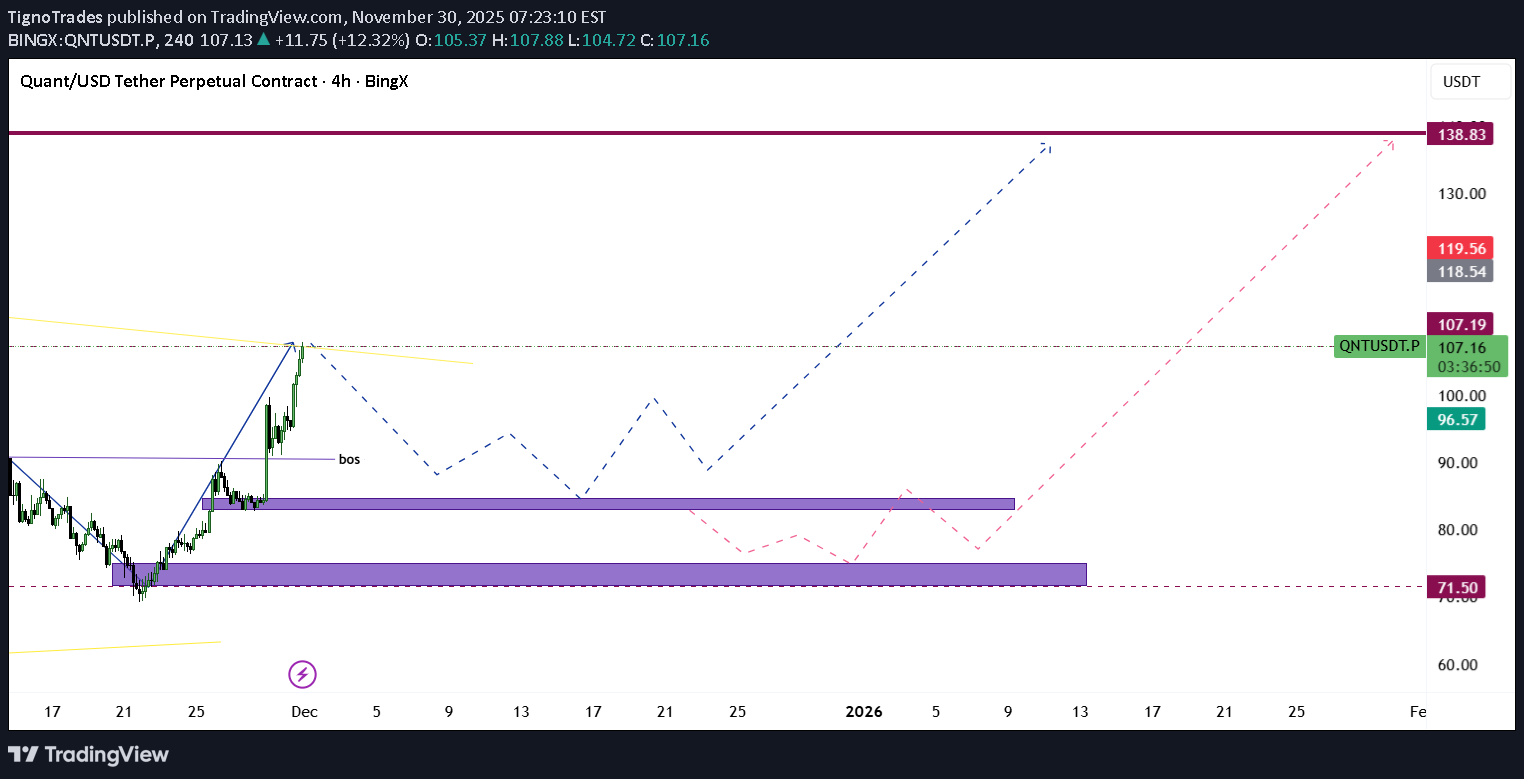
Possible long for QntUsdt if support is broken, I will wait for the price to create CHOCH and set the same TP for long


پیشبینی انفجاری کوانت (QNT): موج ۳ تا کجا پیش میرود؟ (تحلیل تکنیکال)
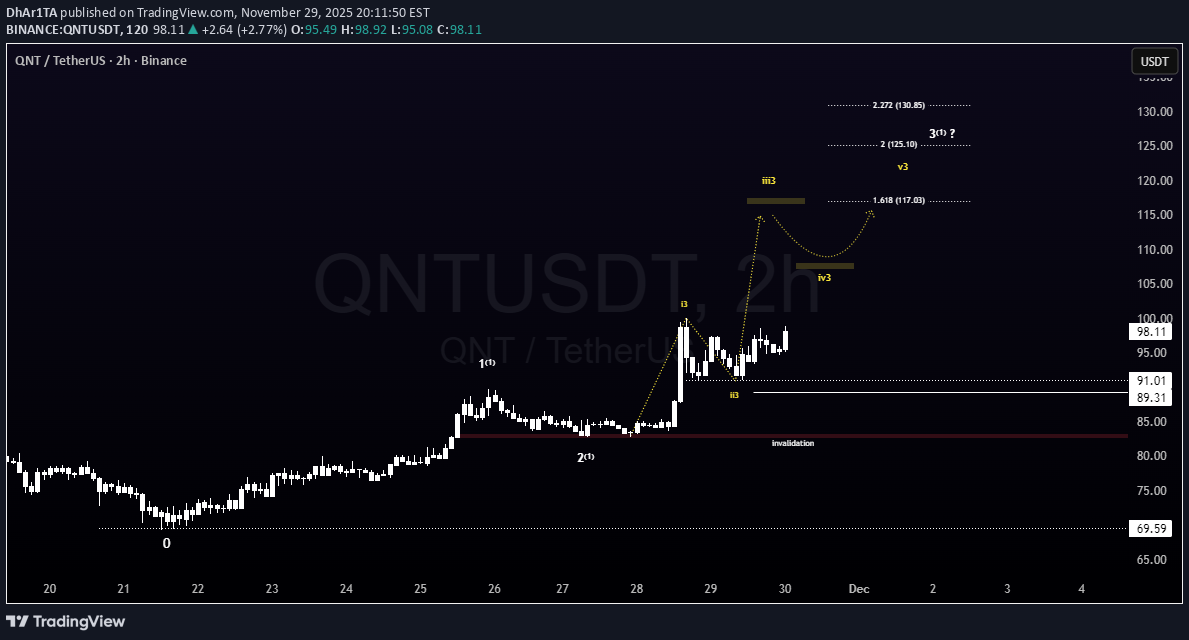
QNTUSDT QNT appears to be developing Wave 3 within a larger Wave 1. With sub-waves i and ii completed, price is now progressing inside sub-wave iii. The primary projection for sub-wave iii is the 1.618 Fibonacci extension near 117 USDT, with potential extended targets in the 125–130 USDT region. This wave count will remain the working scenario unless price structure clearly invalidates it.. -Not financial advice. UPDATE SOON ..
Disclaimer
Any content and materials included in Sahmeto's website and official communication channels are a compilation of personal opinions and analyses and are not binding. They do not constitute any recommendation for buying, selling, entering or exiting the stock market and cryptocurrency market. Also, all news and analyses included in the website and channels are merely republished information from official and unofficial domestic and foreign sources, and it is obvious that users of the said content are responsible for following up and ensuring the authenticity and accuracy of the materials. Therefore, while disclaiming responsibility, it is declared that the responsibility for any decision-making, action, and potential profit and loss in the capital market and cryptocurrency market lies with the trader.