
DhAr1TA
@t_DhAr1TA

What symbols does the trader recommend buying?
Purchase History
پیام های تریدر
Filter
Bitcoin - Transition From Impulse to Correction
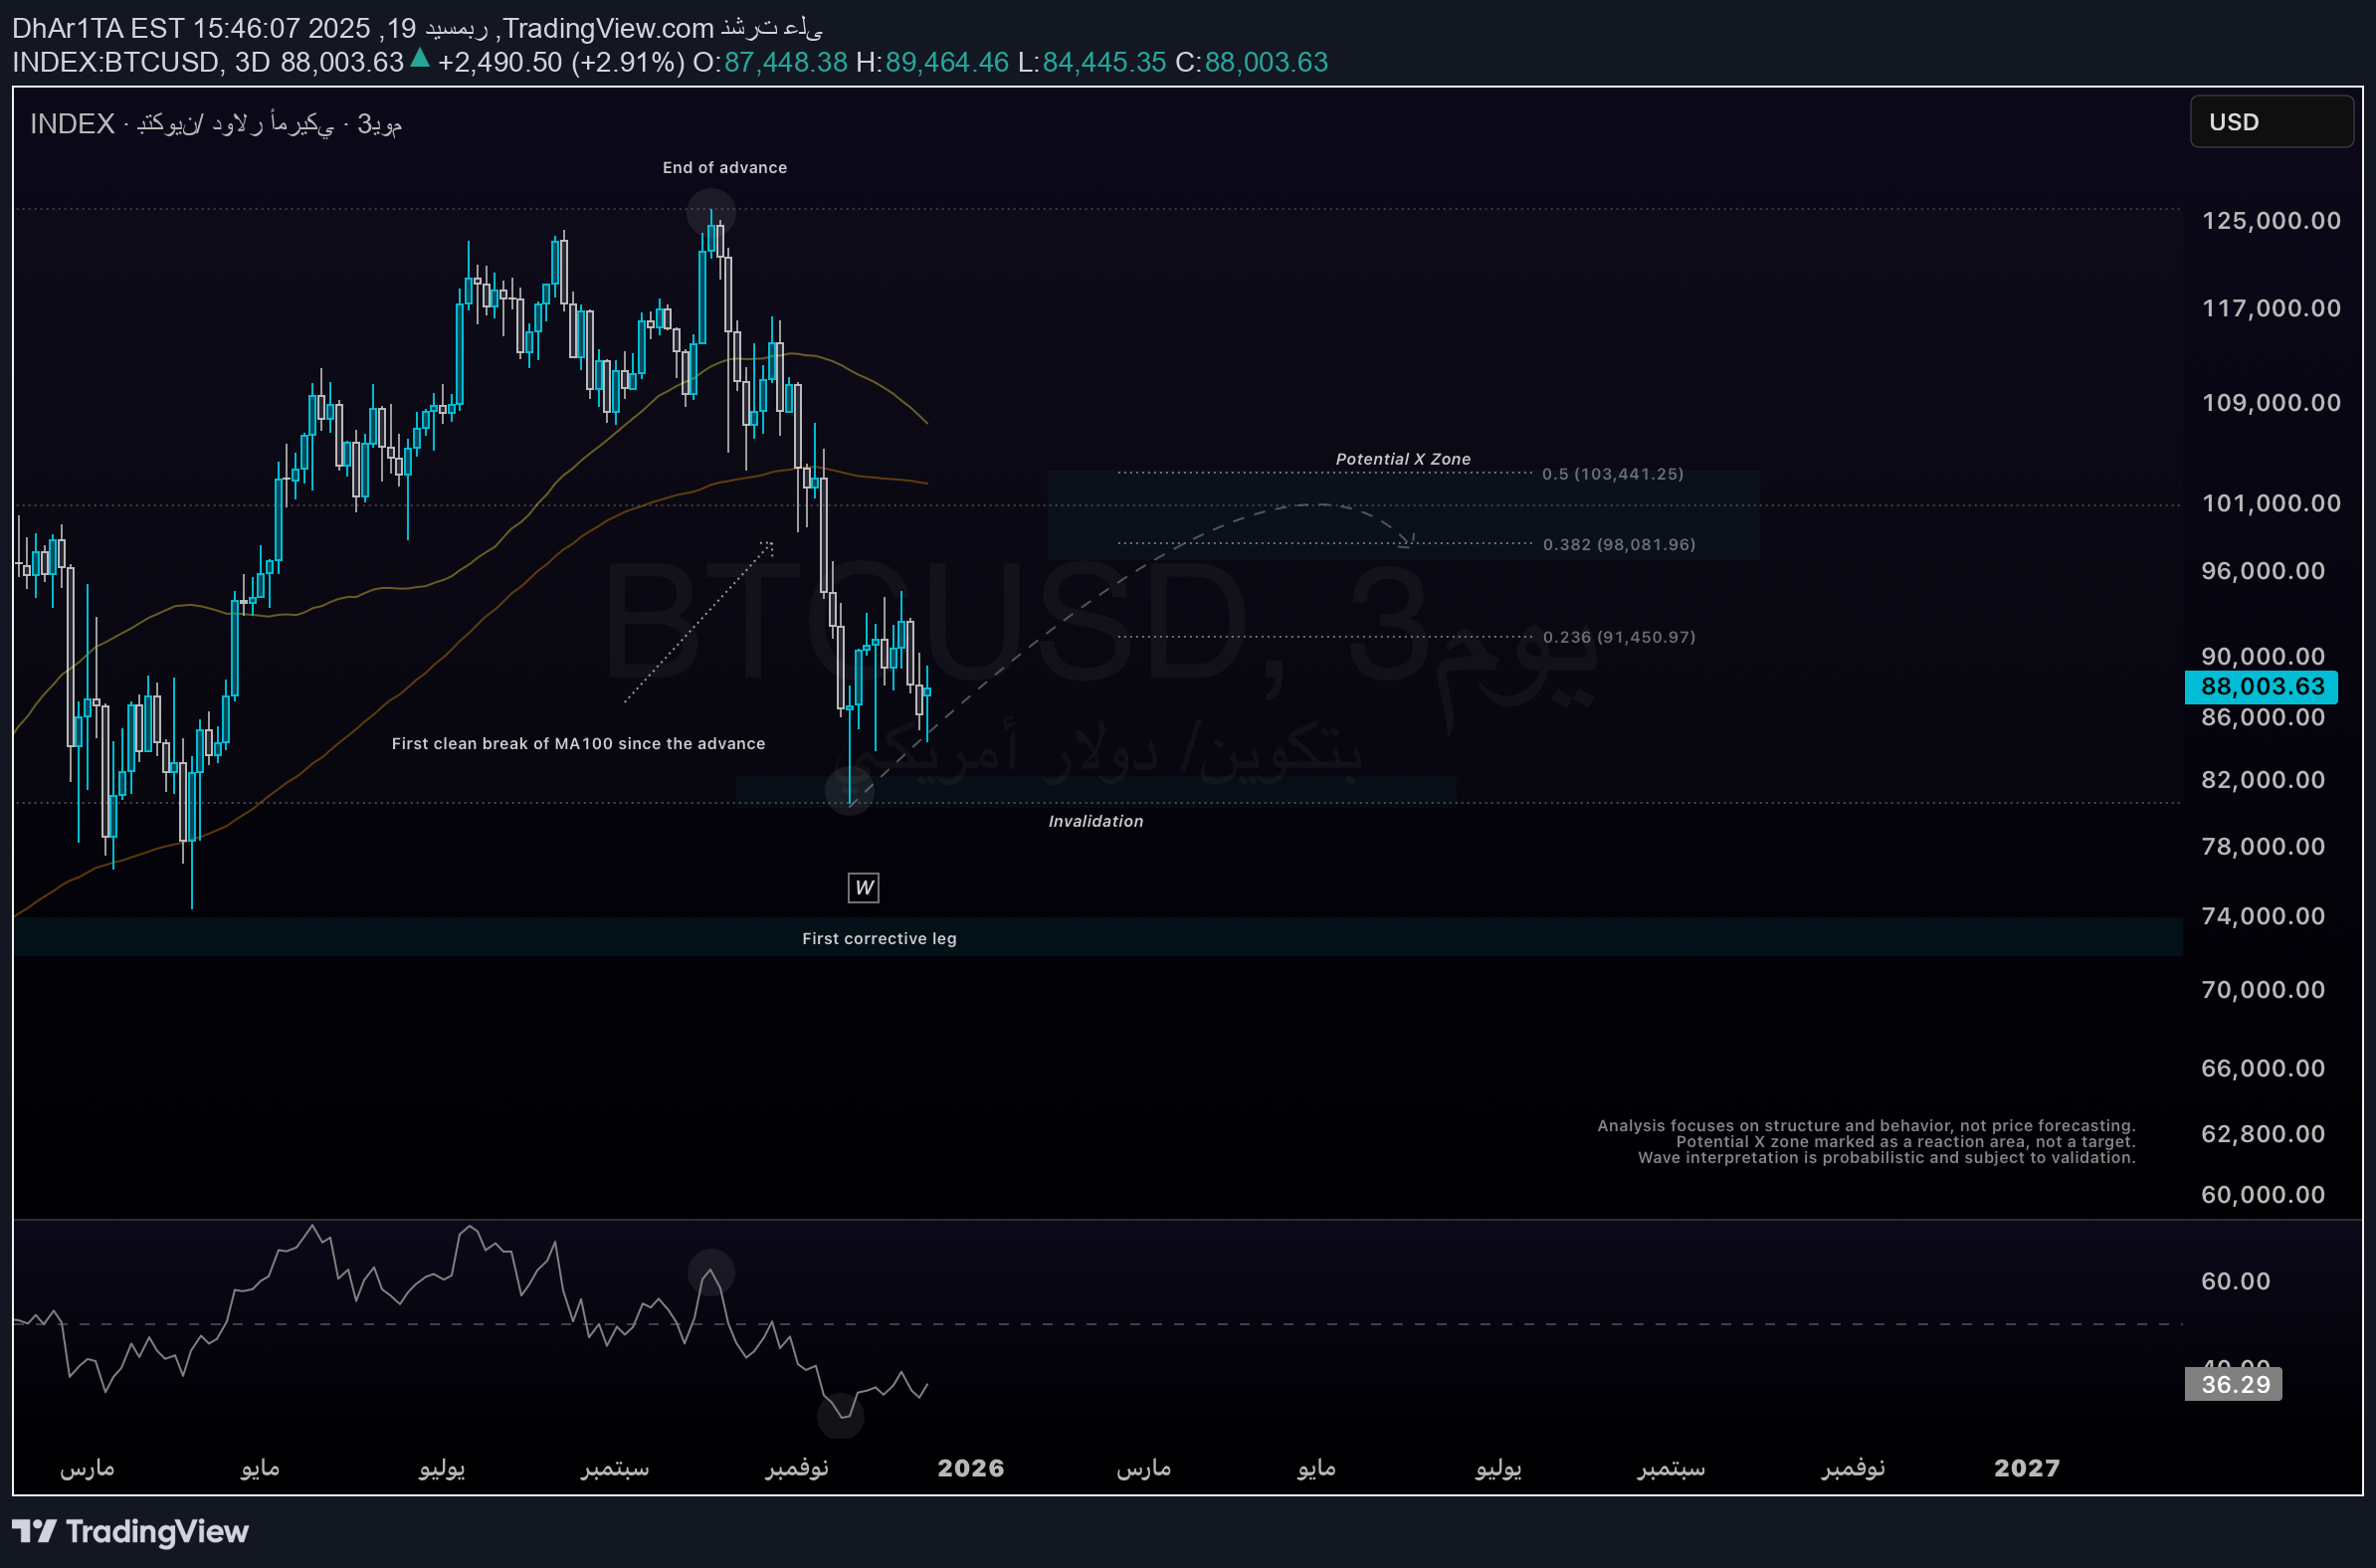
BTCUSDT Following the 126 high, Bitcoin shows a clear shift from impulsive to corrective price behavior. The subsequent decline is characterized by overlapping internal structure, momentum deceleration, and a clean break of the 50 and 100 moving averages for the first time since the advance - a behavior typically observed at the early stages of corrective phases, rather than impulsive downtrends. The move toward the 80K region is best interpreted as the first corrective leg (W), supported by non-impulsive price behavior, RSI exhaustion followed by stabilization, and volume/OBV dynamics consistent with selling pressure absorption. This interpretation remains valid unless invalidated by a clear impulsive reversal.
ZEN - Still in Correction

ZENUSDT ZEN is still trading within a corrective structure. Price continues to drift lower, and the decline remains slow and non-impulsive. The recent rejection from the Y high indicates that upside attempts have so far failed to change the broader corrective context. Downside momentum appears to be fading. Volume participation has contracted, and liquidity withdrawal looks gradual rather than aggressive. Overall, ZEN remains structurally weak but behaviorally exhausted, consistent with a late-stage corrective environment rather than an active sell-off.
BTC -- Weekly Trend Structure Update
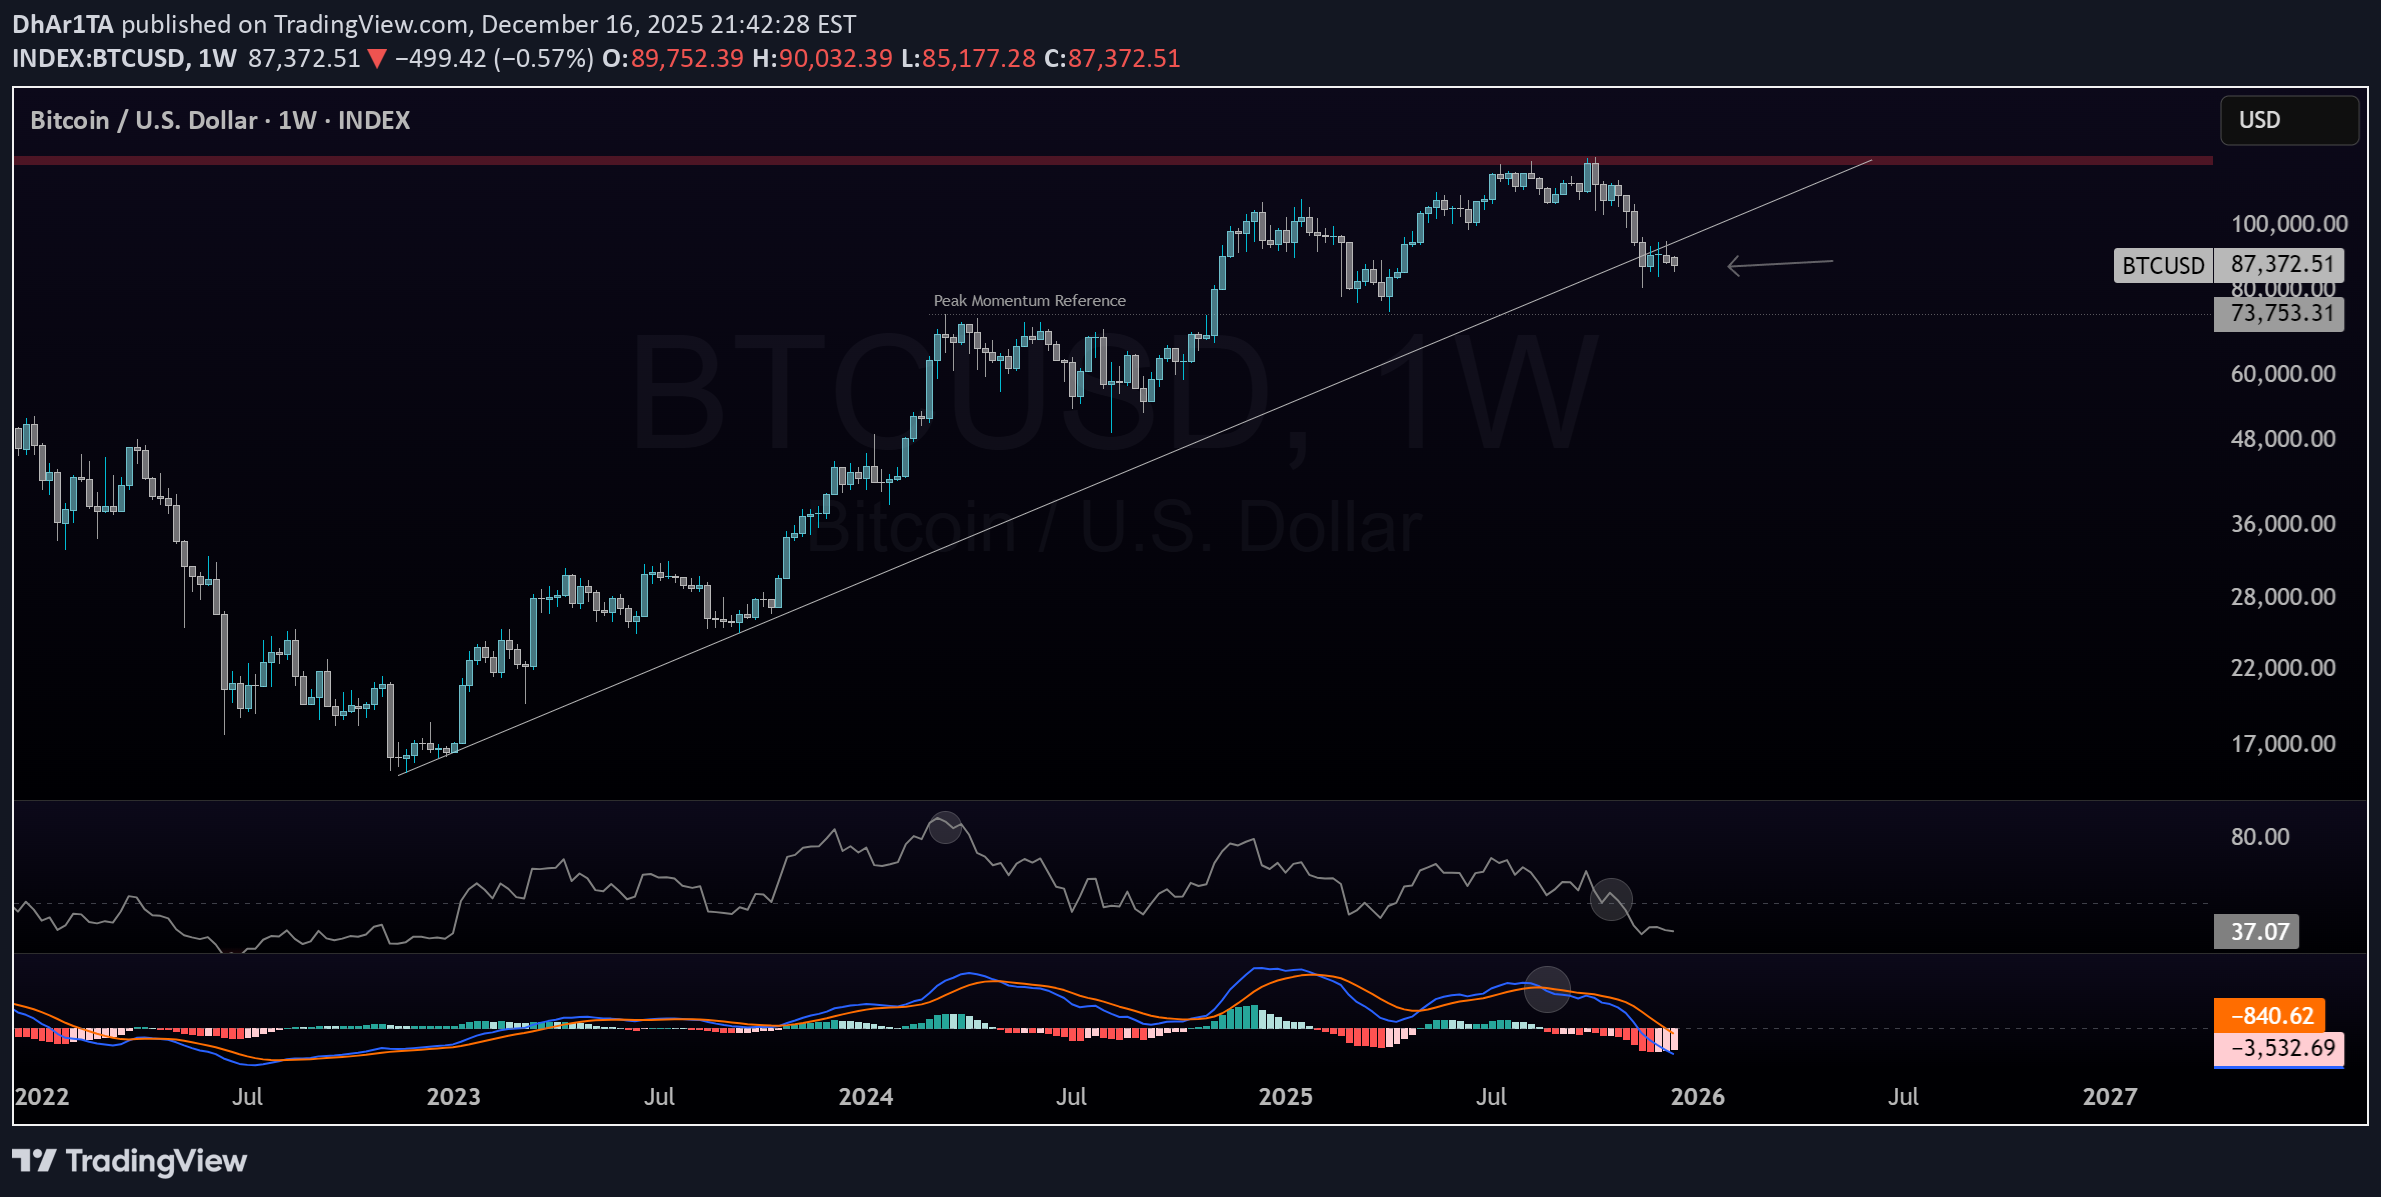
BTCUSD BTCUSDT Weekly structure confirms a break of the primary trend structure following a late-stage acceleration. Momentum has rolled over, keeping price within a corrective regime rather than trend continuation. A sustained break below 74 would confirm a broader bearish structure.
ساختار هفتگی بیت کوین: موج تصحیح پس از موج (I) در چه مرحلهای است؟
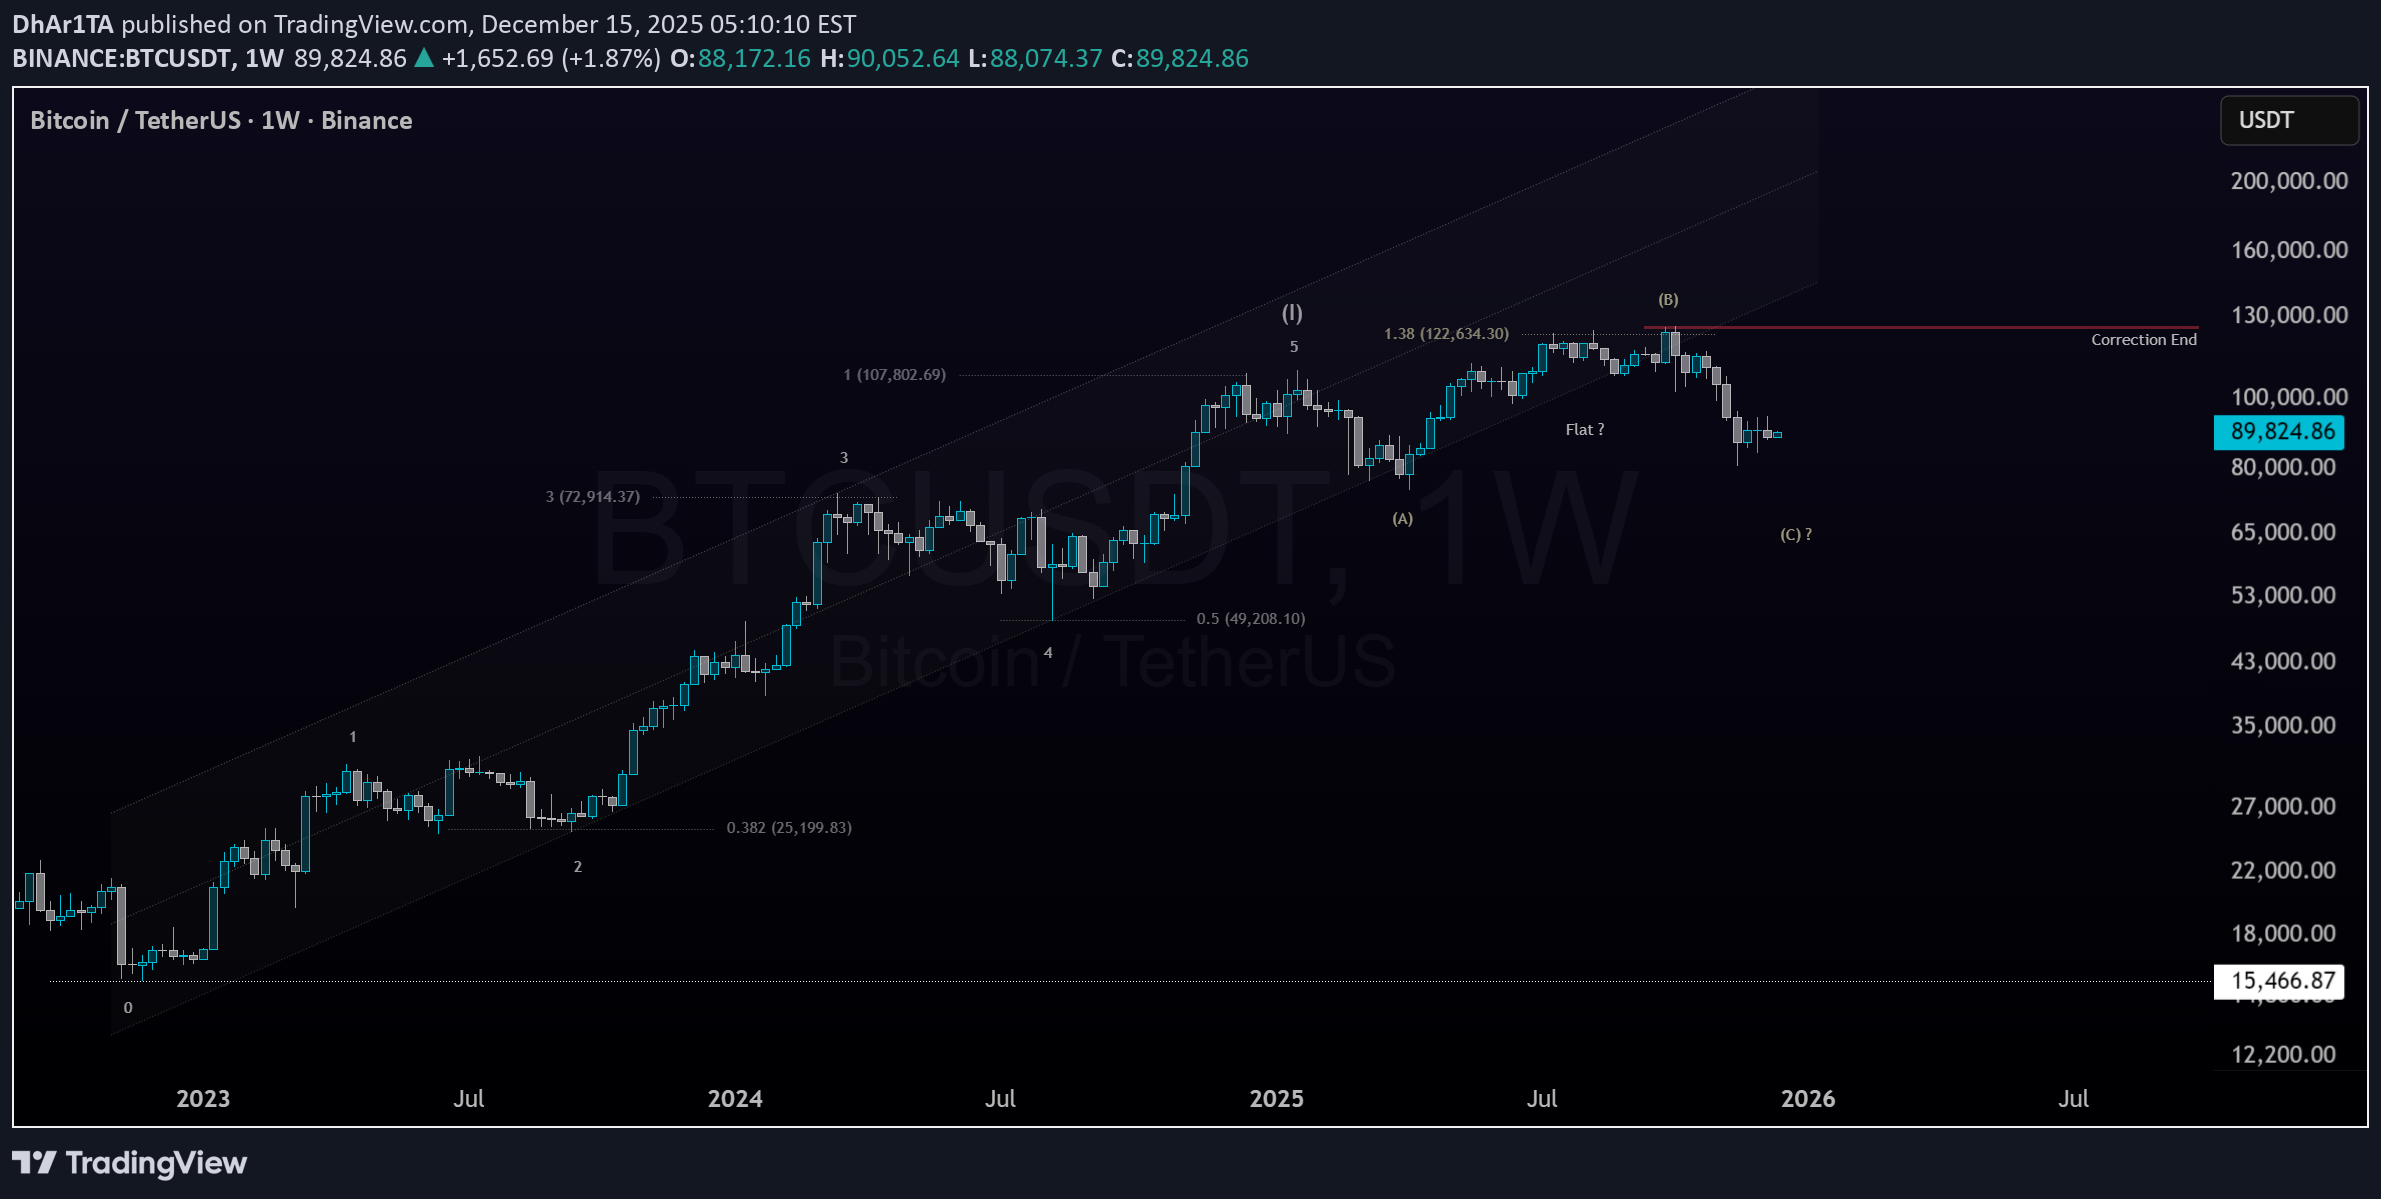
BTCUSD BTCUSDT Weekly wave structure. Post-(I) correction under evaluation .
3D - Corrective Structure
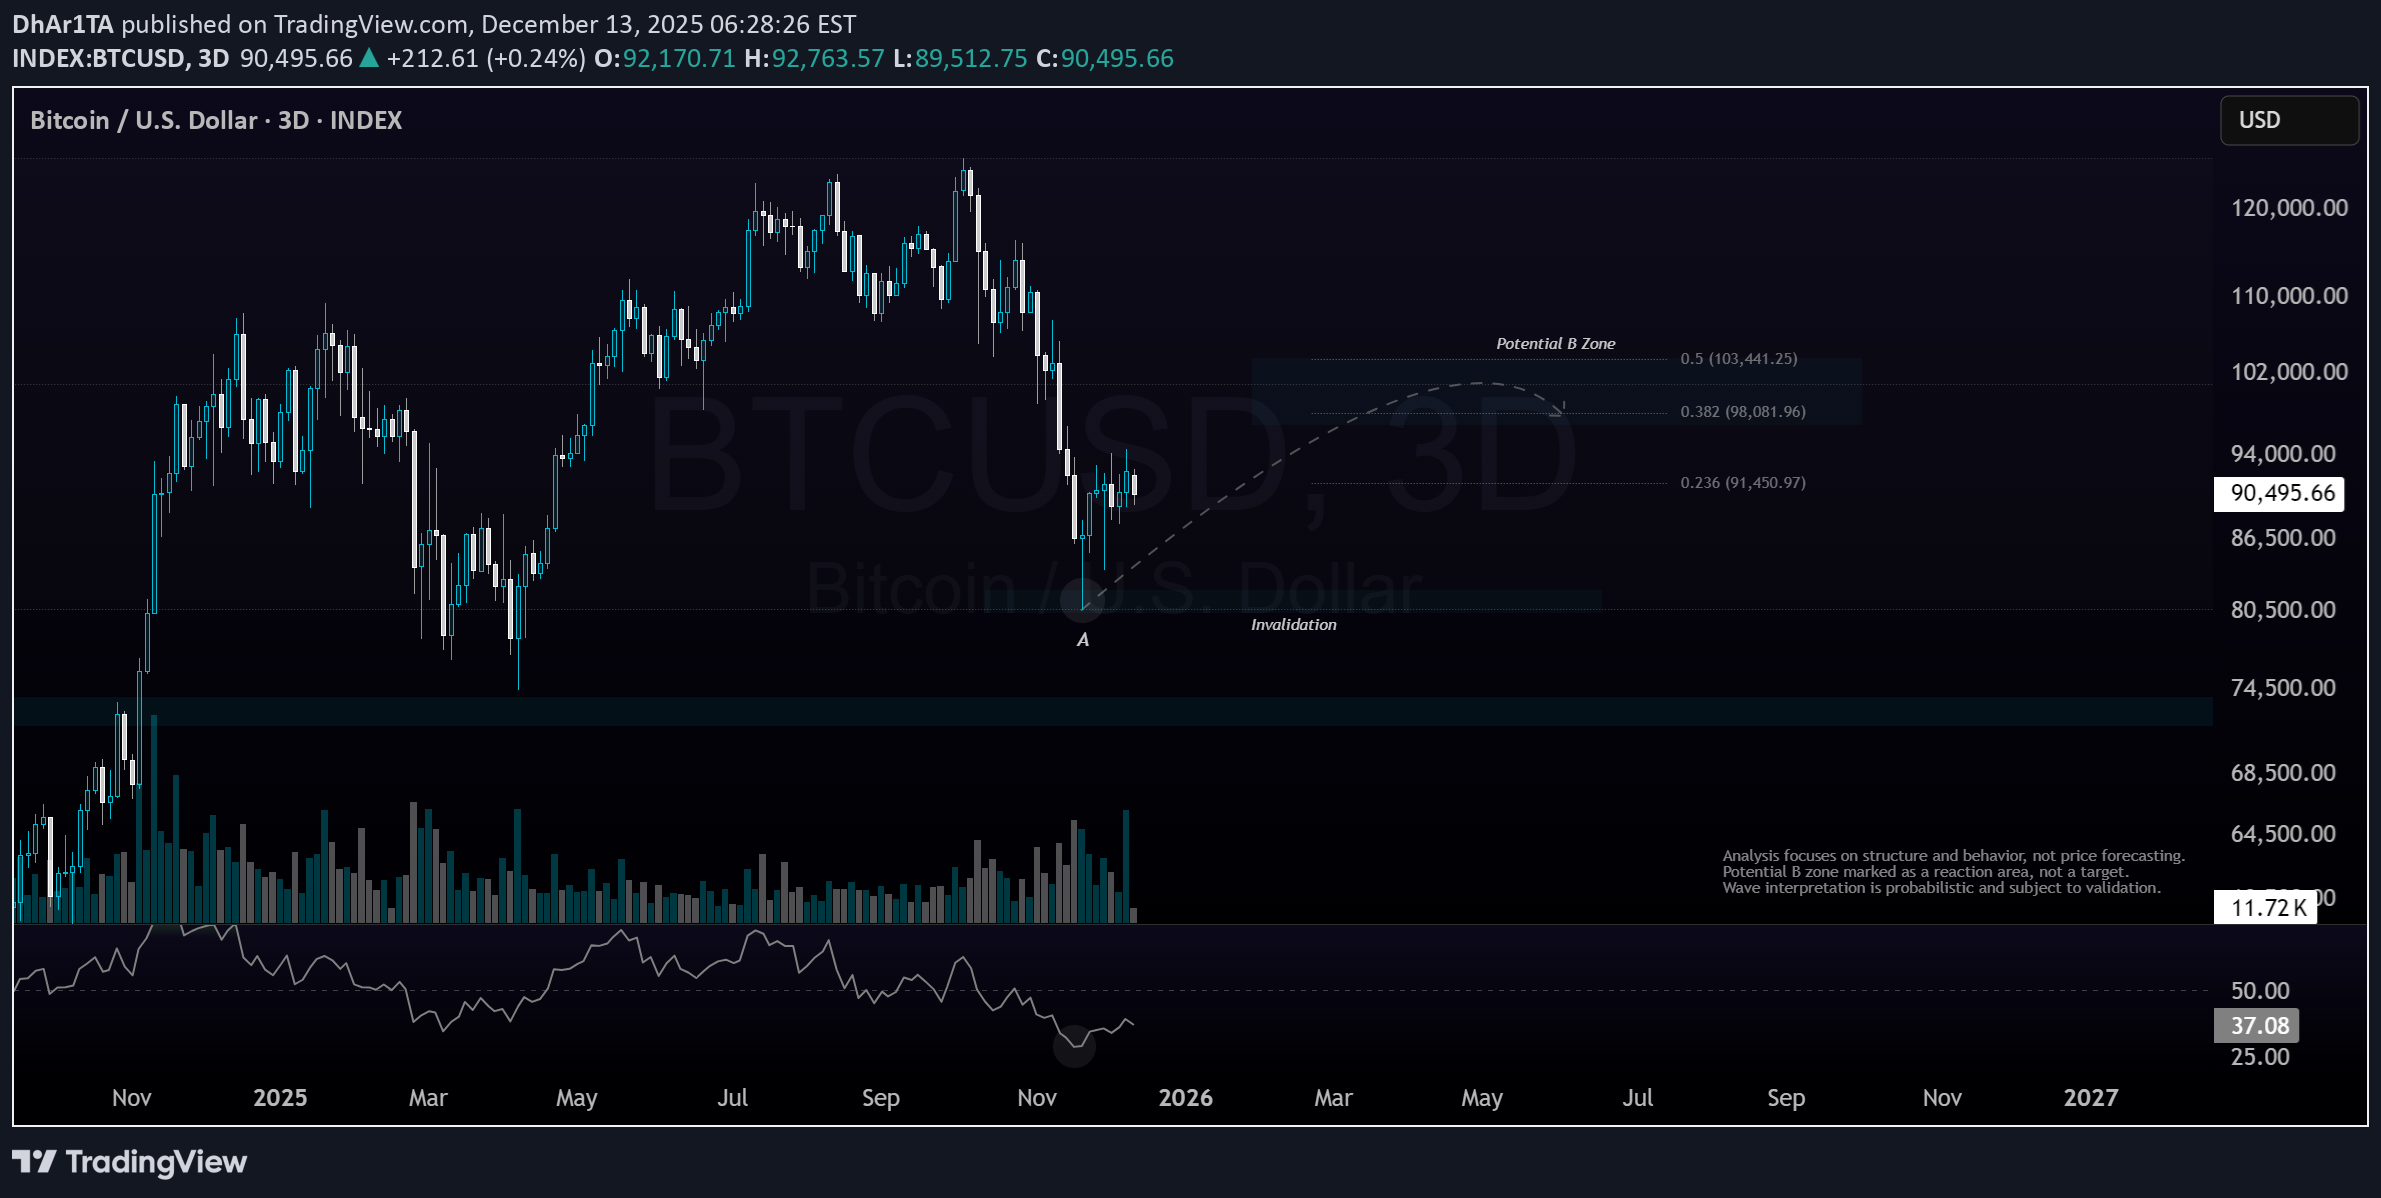
BTCUSD A structural corrective analysis on a 3 day frame. Wave A has been structurally identified, and the current price movement is being evaluated within a potential interaction range for wave B.
پایان اصلاح زن (ZEN)؟ نقطه عطف قریبالوقوع در نمودار ۱۲ ساعته!
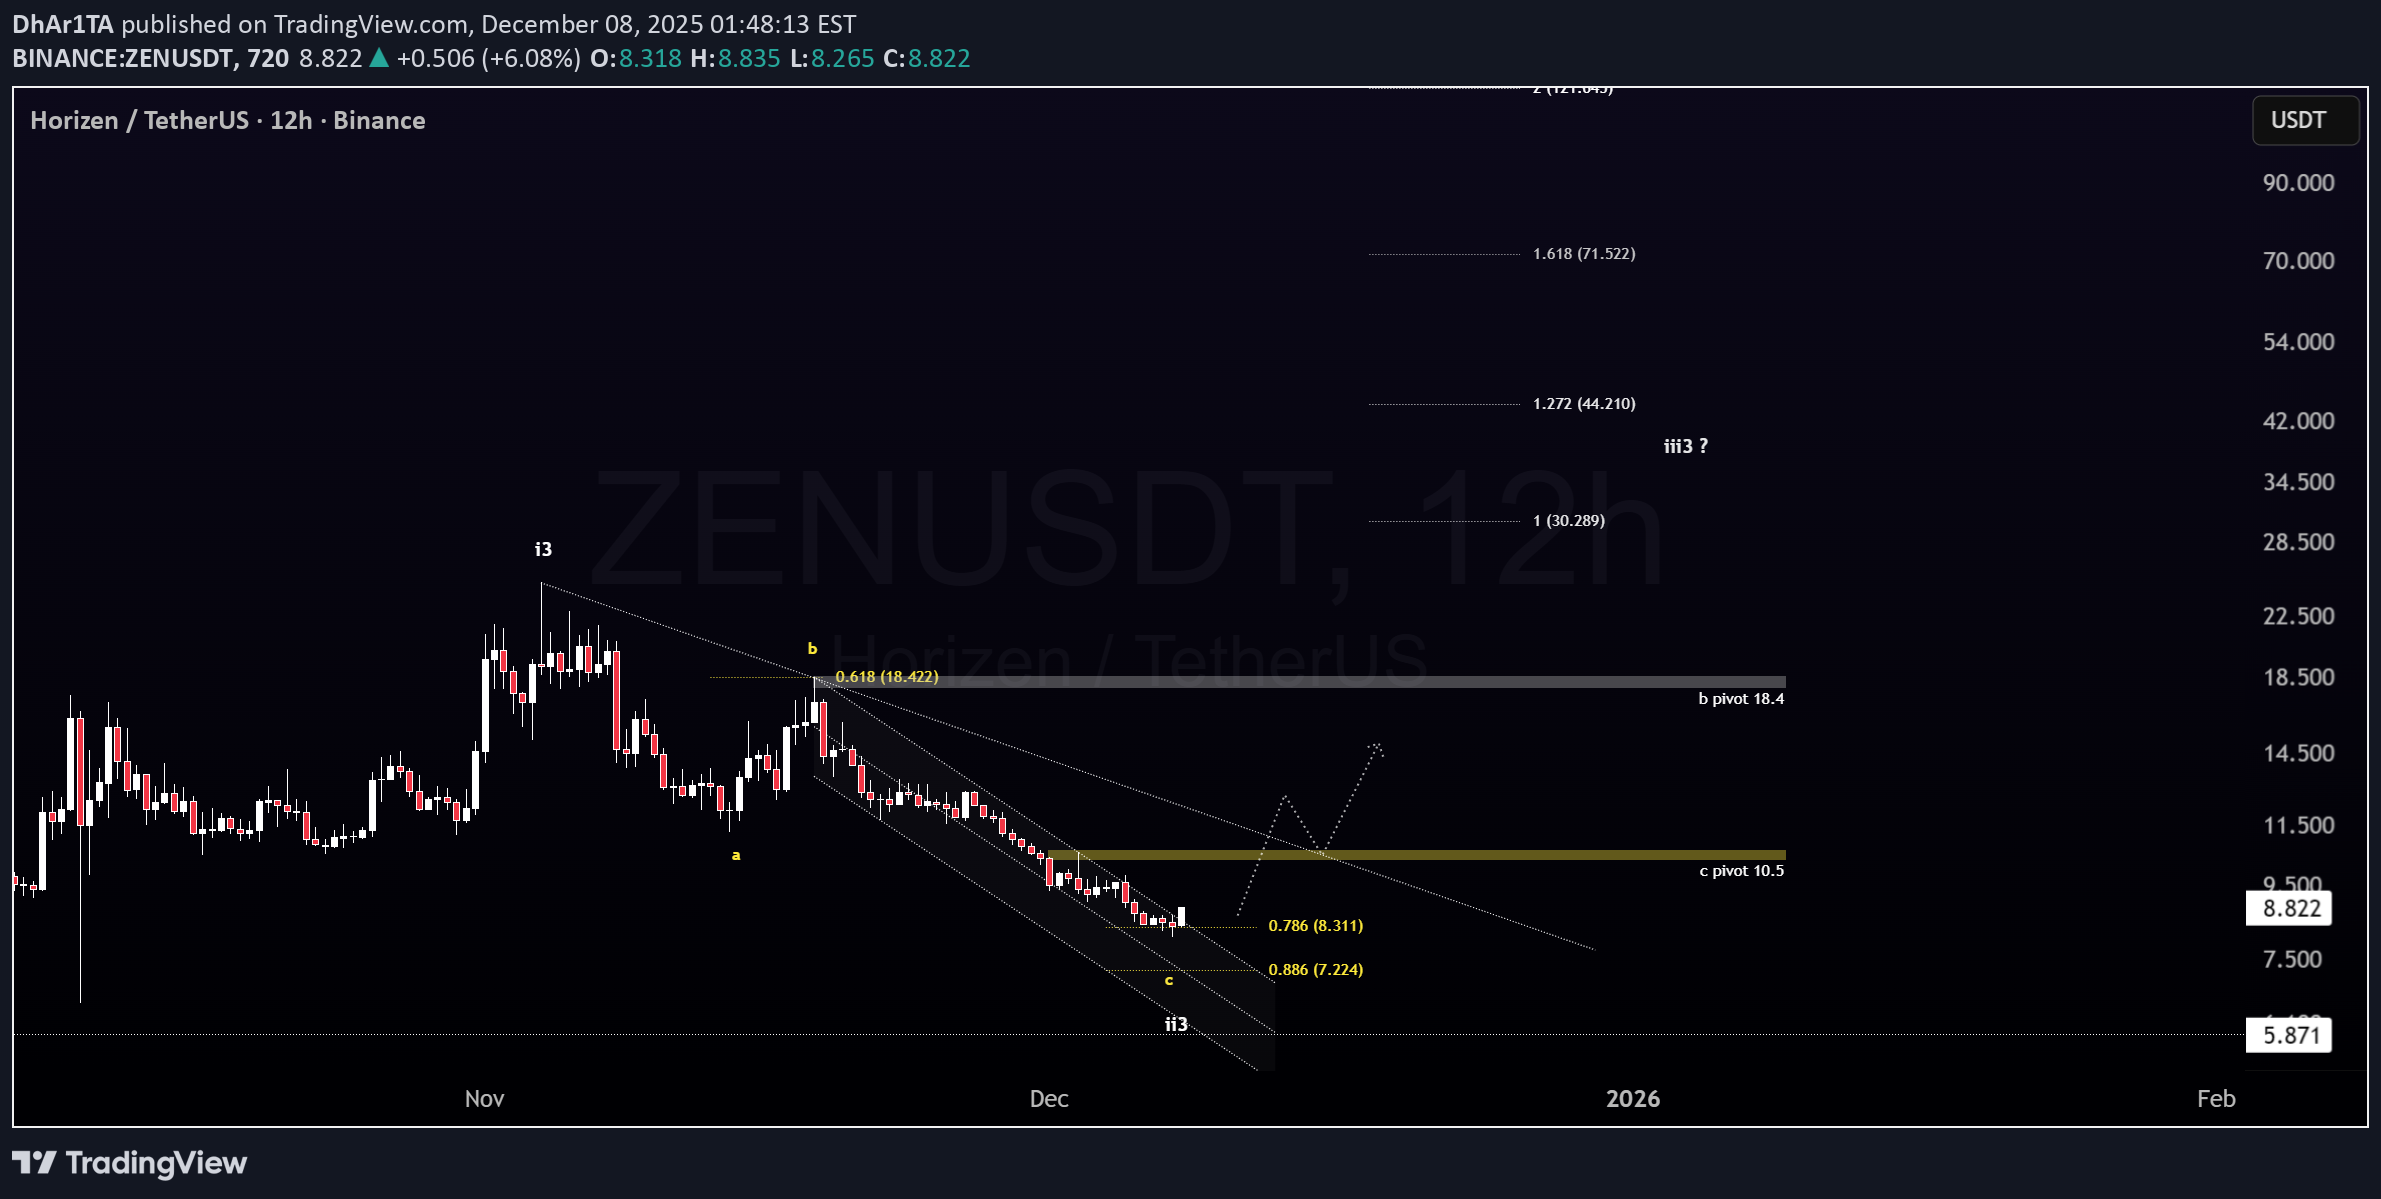
ZENUSDT Price appears to be completing what looks like a Wave ii structure within the larger Wave 3. The recent decline developed into a clean A-B-C corrective pattern and retraced into a deep correction zone - which aligns with typical Wave ii behavior. Momentum has been slowing, and price has been consolidating inside a descending channel, a common sign that the correction may be entering its final stage. There is still no confirmed reversal yet, but the recent price behavior suggests the market may be getting close to a potential turning point. A clean breakout above the channel would be the first meaningful indication that Wave iii may be forming. From an indicator standpoint, momentum is beginning to shift: selling pressure is fading, compression is forming, and early bullish signals are appearing - although confirmation has not triggered yet. - Not financial advice .... Update soon ..
پایان موج صعودی بیت کوین در ۱۲۶ هزار دلار: نشانههای هشداردهنده و آغاز اصلاح بزرگ (موج ۲)
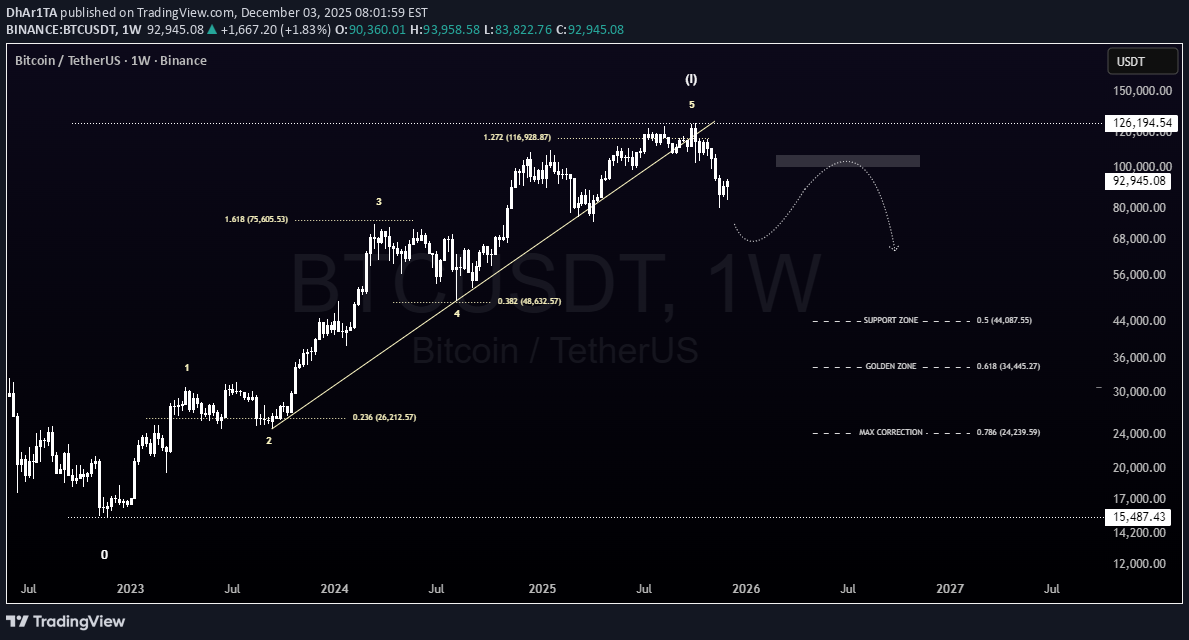
BTCUSDT On the weekly chart, the advance clearly topped at 126K. Momentum had already begun to fade before the peak, and several indicators confirmed it: -- RSI : formed a lower high compared to the Wave 3 peak, signaling weakening upside momentum. -- MACD : showed a noticeable loss of strength during the final push. -- ADX (+DI/–DI) : reflected declining trend strength as +DI weakened and –DI gained traction. Price also made a new high without matching momentum - a typical exhaustion pattern often seen near major market peaks. Together, these weekly signals confirm that 126K marked the completion of Wave (I), and that the current decline represents the early phase of a broader Wave (II) correction.
تحلیل فوری کوانتوم (QNT): موج 3 کجاست و سقف 130 دلار ممکن است؟
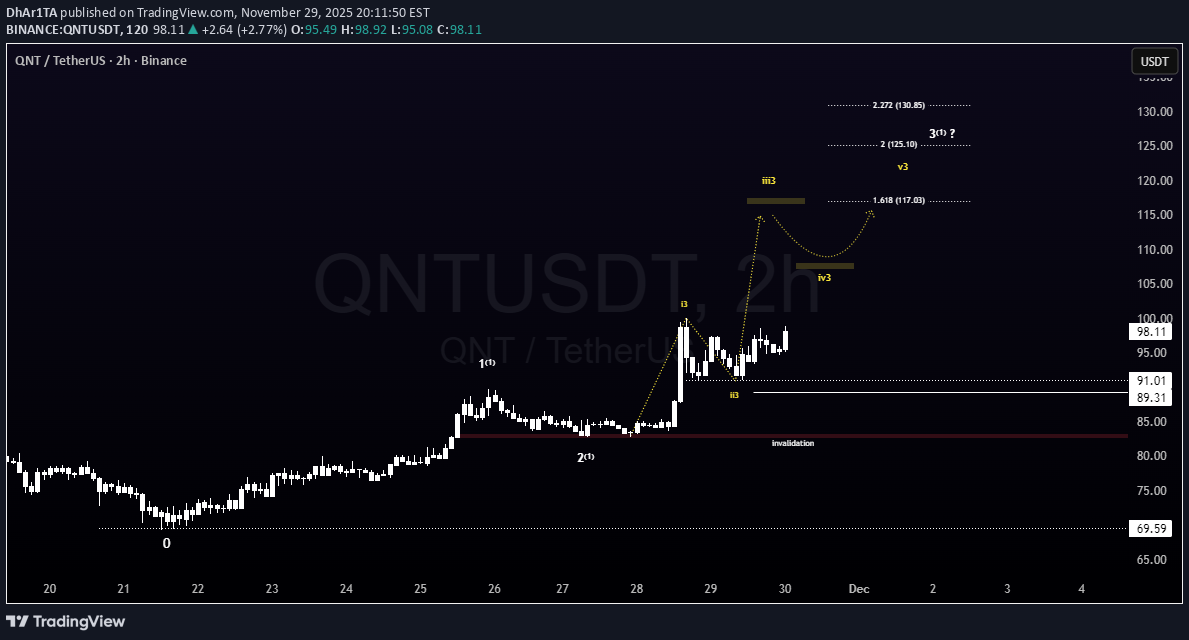
QNTUSDT QNT appears to be developing Wave 3 within a larger Wave 1. With sub-waves i and ii completed, price is now progressing inside sub-wave iii. The primary projection for sub-wave iii is the 1.618 Fibonacci extension near 117 USDT, with potential extended targets in the 125–130 USDT region. This wave count will remain the working scenario unless price structure clearly invalidates it.. -Not financial advice. UPDATE SOON ..
پایان موج دوم دش (DASH)؟ منتظر تایید نهایی برای صعود به موج سوم!
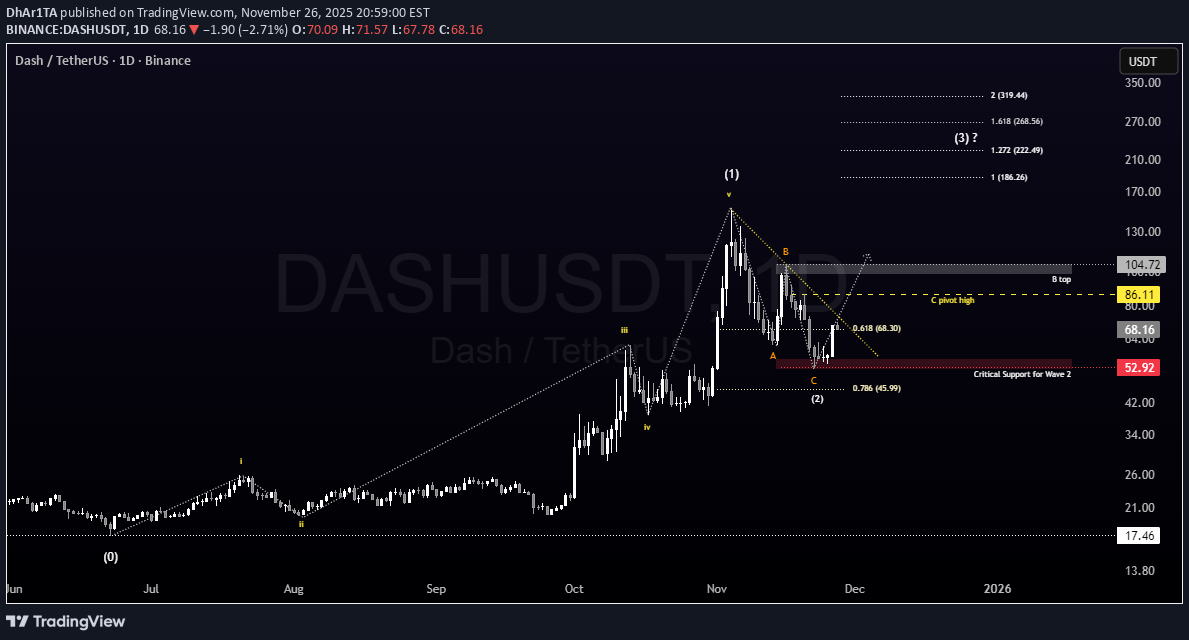
DASHUSDT Wave 2 seems to have completed after a clear A-B-C correction, and price held strongly above the C-low support. The recent bounce is encouraging, but the real confirmation will come once price breaks the downtrend line and moves above the C pivot. As long as price remains above the C low, the bullish view stays valid. A break below the C low would invalidate the move . update soon ... - This is not financial advice .
Disclaimer
Any content and materials included in Sahmeto's website and official communication channels are a compilation of personal opinions and analyses and are not binding. They do not constitute any recommendation for buying, selling, entering or exiting the stock market and cryptocurrency market. Also, all news and analyses included in the website and channels are merely republished information from official and unofficial domestic and foreign sources, and it is obvious that users of the said content are responsible for following up and ensuring the authenticity and accuracy of the materials. Therefore, while disclaiming responsibility, it is declared that the responsibility for any decision-making, action, and potential profit and loss in the capital market and cryptocurrency market lies with the trader.