
ew-forecast
@t_ew-forecast

What symbols does the trader recommend buying?
Purchase History
پیام های تریدر
Filter
ew-forecast
TSLA- Want to buy? Be aware of deeper correction, wait on 370/80

Tesla has made a very nice recovery from the April 2025 lows and even reached new highs near the 500 area, but we are now seeing an interesting retracement at the start of 2026. This pullback can still be corrective, but it should be deeper then, as we are still missing the three subwaves within wave four, before the market can complete this correction. A very interesting support zone for those looking to rejoin the trend comes in around the 380 -370 area. This zone aligns with the previous fourth wave area and the former swing high from May 2025. The Elliott Wave Oscillator also points room to more downside, as momentum could likely reach levels similar to those seen around the July and November 2025 as shown on the daily chart, withi hilighted arrows on the indicator. Highlights • Key support zone to watch is 380–370 • Current pullback likely part of wave four, still missing three subwaves • Elliott Wave Oscillator suggests deeper pullback is due • Broader bullish structure remains valid above the 275–277 invalidation zone
ew-forecast
Tesla Read For More Gains In 2026
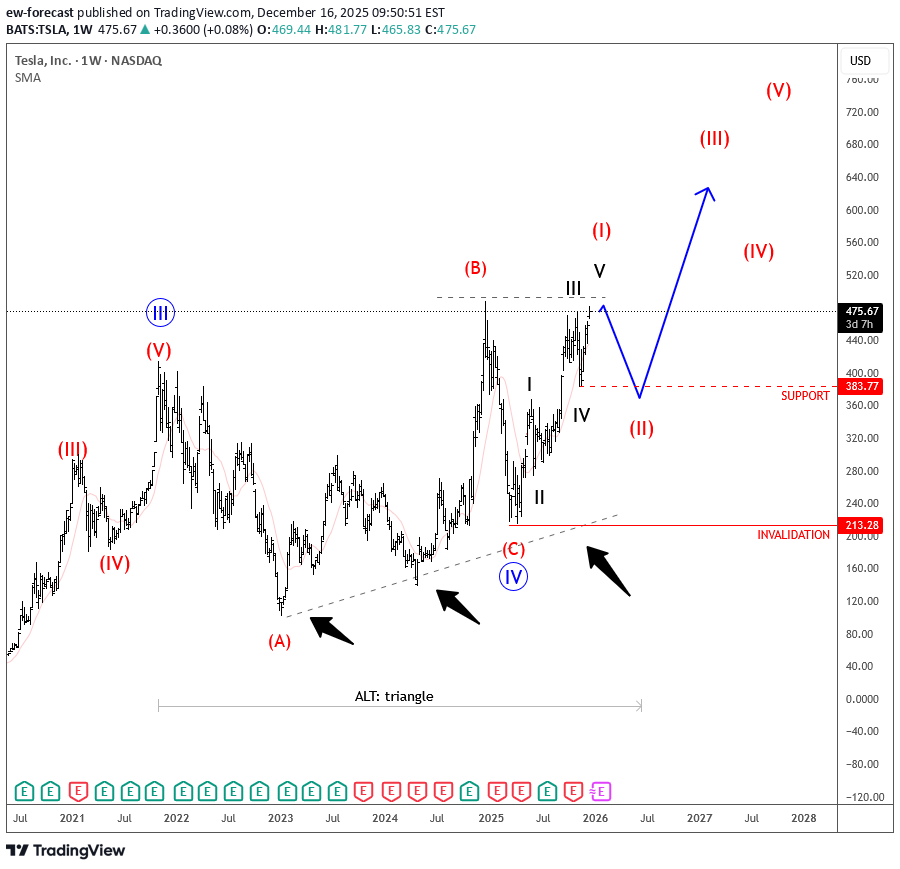
Tesla has been on the rise since March this year and is now approaching some very important levels around 480, which marks the high from about a year ago. What really matters at this stage is that we have five waves up from 217, which is a very strong bullish structure and suggests more upside ahead, as the market is showing a progressive trend. Because of that, there could be interesting opportunities to join the trend, especially if we see some kind of retracement in 2026. In that case it makes sense to keep an eye on the previous lower-degree wave four support around 483, which could be an attractive area for the next rebound. An alternate wave count also allows for a triangle to form here, which would again suggest that after a setback into wave E of four we would most likely see more upside. That scenario would remain valid as long as the December 2024 highs are not breached. In general, the best opportunities could show up if we get a retracement into a lower-degree wave two and then look to ride the next strong leg higher, while the market holds above 213. GH
ew-forecast
Dash Is Sitting At The Strong Support Within The Wedge Pattern
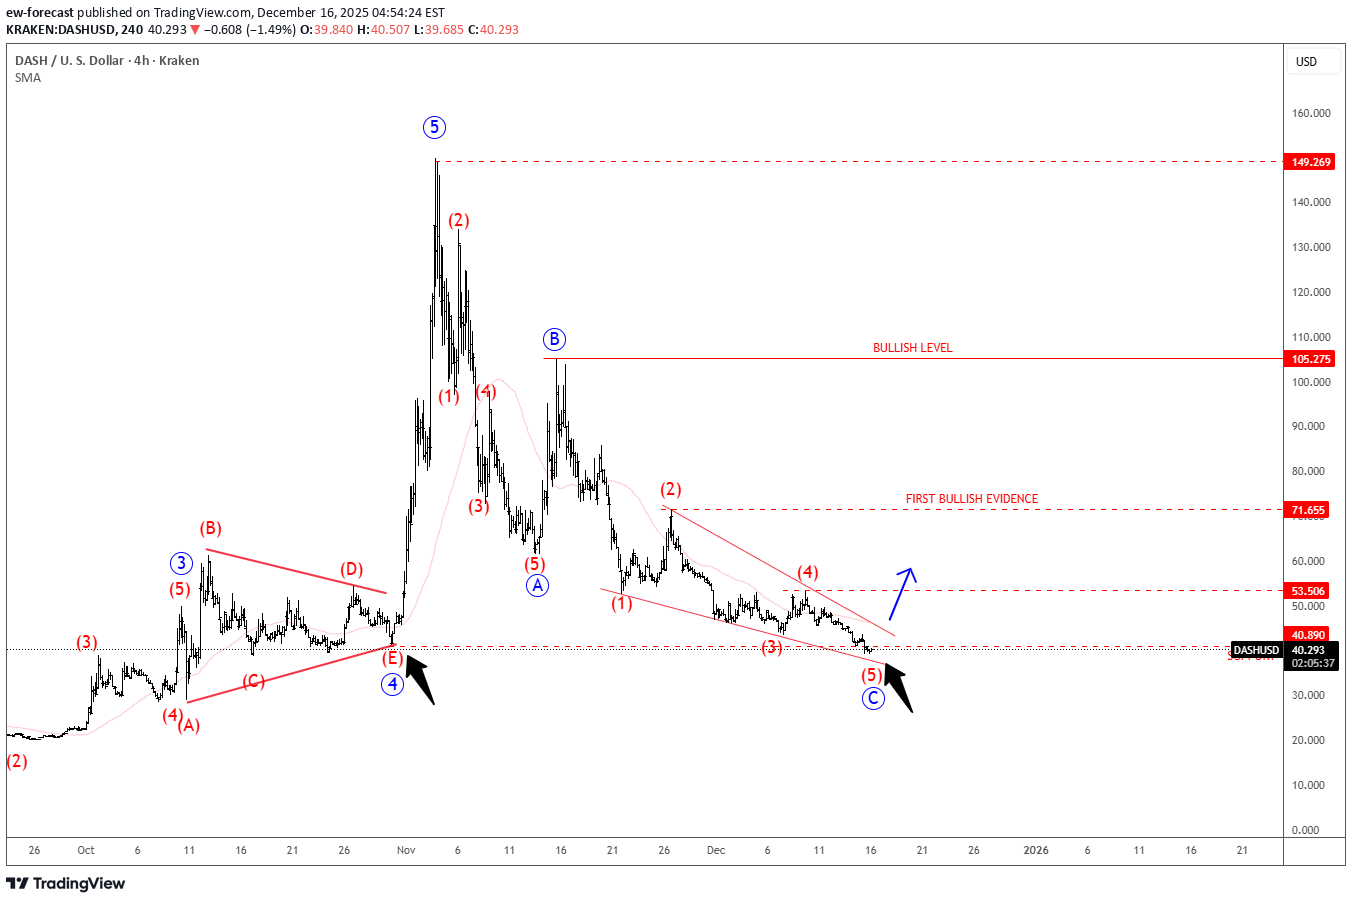
Dash made a strong rally, as anticipated earlier, but the recent sharp decline suggests that the five-wave bullish impulse has likely been completed. As a result, price action now appears to be in a higher-degree three-wave corrective phase. This pullback fits well with a broader ABC corrective structure following the impulsive advance. On the 4-hour chart, Dash seems to be trading within wave C of this higher-degree correction. Moreover, price action suggests that the market may be in the final stages of wave (5) within a wedge pattern. This setup often signals trend exhaustion, especially when combined with strong historical support. In this case, the 40 area stands out as a key support zone where buyers could step back in and stabilize the price. Given this technical structure, traders should be alert for a potential rebound and the early stages of a new rally, particularly if price manages to recover and hold above the 53.50 level. However, it’s important to remain cautious, as the first meaningful bullish evidence would only be seen on a breakout above the 71 area. A decisive move above 105 would then serve as full bullish confirmation, signaling that a larger upside continuation is back in play. Until those levels are reclaimed, price action should be monitored closely, as volatility may remain elevated near the current support zone.
ew-forecast
آیا کوآنت (QNT) در آستانه انفجار قیمتی است؟ پایان الگوی مثلث صعودی!
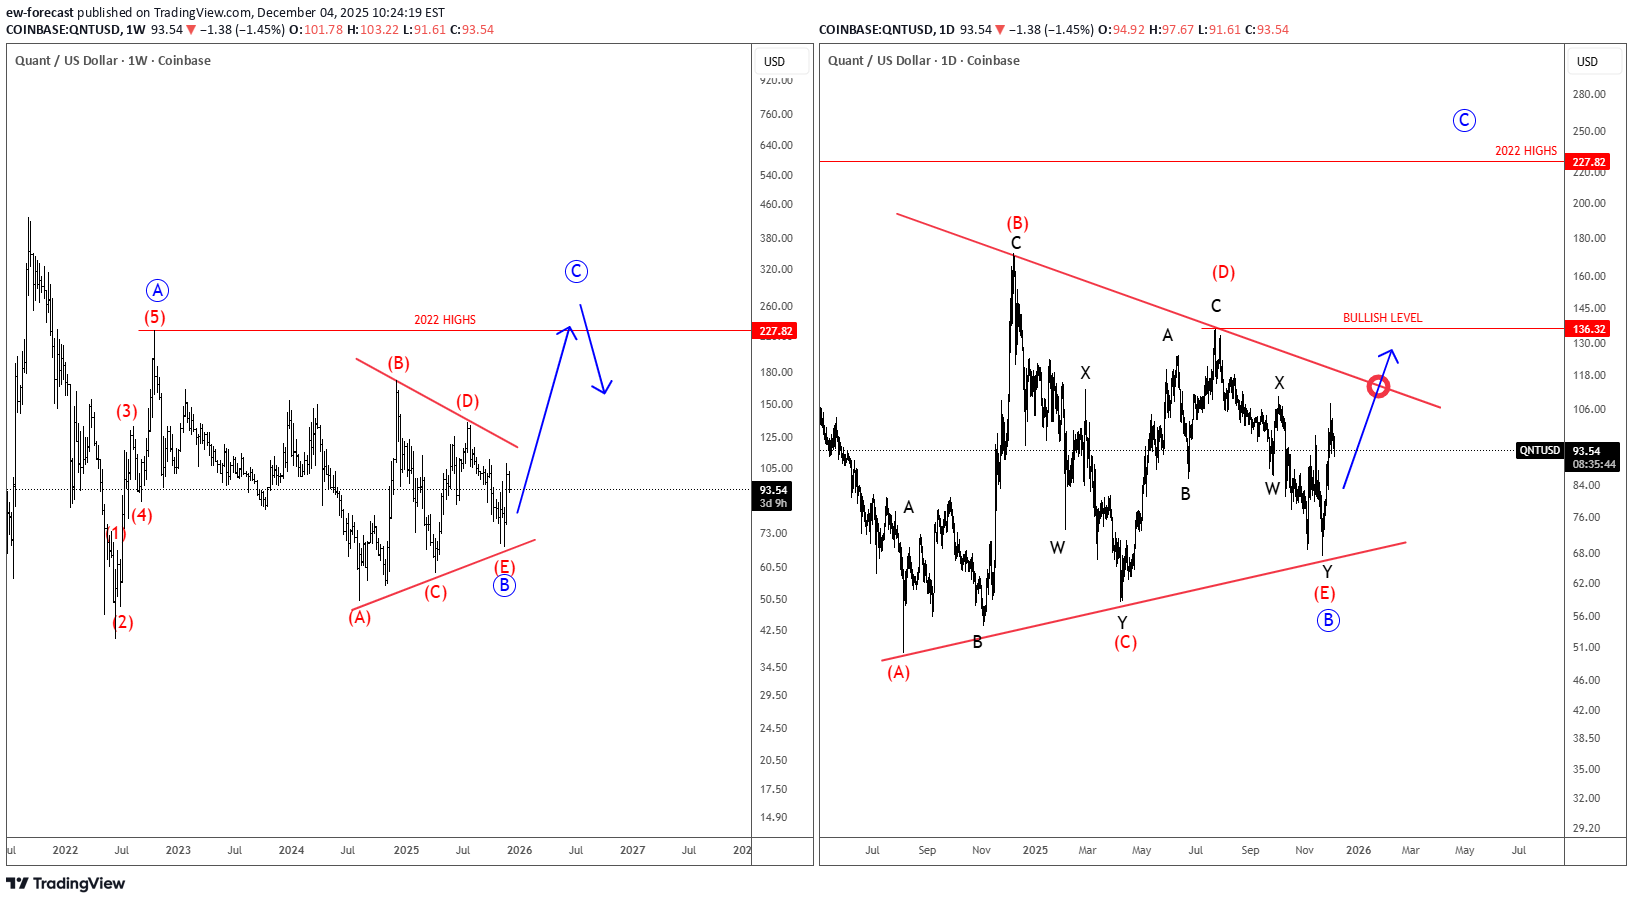
Quant Network is a blockchain interoperability project that lets different blockchains communicate with each other. Its operating system, Overledger, allows developers and businesses to build apps that can run across multiple blockchains at the same time. The token QNT is used to access and pay for Overledger services. Quant with ticker QNTUSD is still holding up well above the lower triangle line, so bulls are still here. On the weekly basis, we can now see it finishing a bullish triangle pattern in wave B before we may see another rally for wave C. On a daily chart, it may actually have a completed complex W-X-Y decline within final wave (E) of B, but bullish confirmation for wave C is only above the upper triangle line and 136 level.
ew-forecast
بیتکوین تا کجا سقوط میکند؟ راز موجهای الیوت و شرط کلیدی 100 هزار دلار
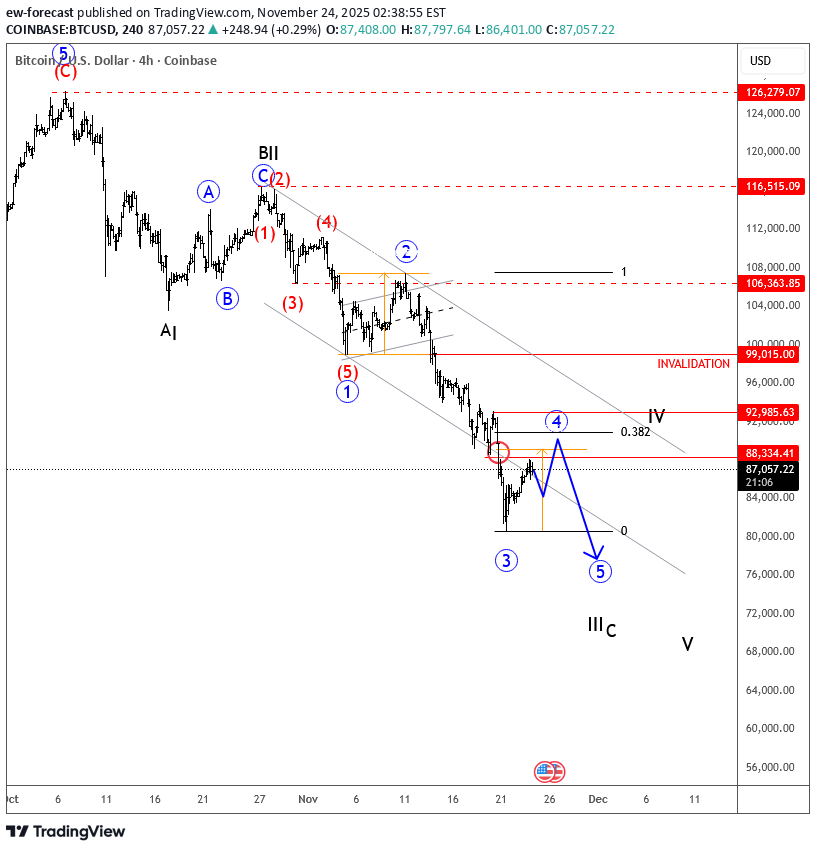
A lot of traders are wondering when Bitcoin will complete the pullback from the highs, but if we are really in a higher-degree retracement then keep in mind that the big pullbacks on Bitcoin usually lasted around 12 months, and right now we are only one and a half months away from the recent highs. That’s the first thing. The second thing, and the most important for me, is always the Elliott wave structure itself. I simply cannot ignore it, because it helps me identify the key levels that must be broken before we can confidently look for a turning point. If you look closely at the price drop from the 116515 level, you can clearly see that this is a strong decline without a completed five-wave sequence yet. So even if we assume this is wave C rather than wave four, it still has to be structured by five waves. That means the current rebound from the 80k zone could easily be just a fourth wave, maybe stopping around 90k, which is an important swing level for this week. Based on Elliott waves and price action, this weakness can still resume. The key level for a bullish turn is very clear: a push back above 99k, or better said 100k, which is a strong psychological pivot. Below it we stay in bearish mode with risk for one more drop.Bitcoin is extending impulsively lower, which looks like wave 3 of an ongoing five-wave bearish cycle within higher degree wave C or III, so more weakness can be seen while the price is below 99k area. After the recent corrective pullback in wave 4 into the projected resistance area, it seems like it's now on the way lower within wave 5 of C/III towards 80k-74k area. Any early rally back above channel resistance line and 99k area would be a signal that temporary support is in place.
ew-forecast
هشدار جدی برای بیت کوین: پایان چرخه صعودی و آغاز اصلاح عمیق؟
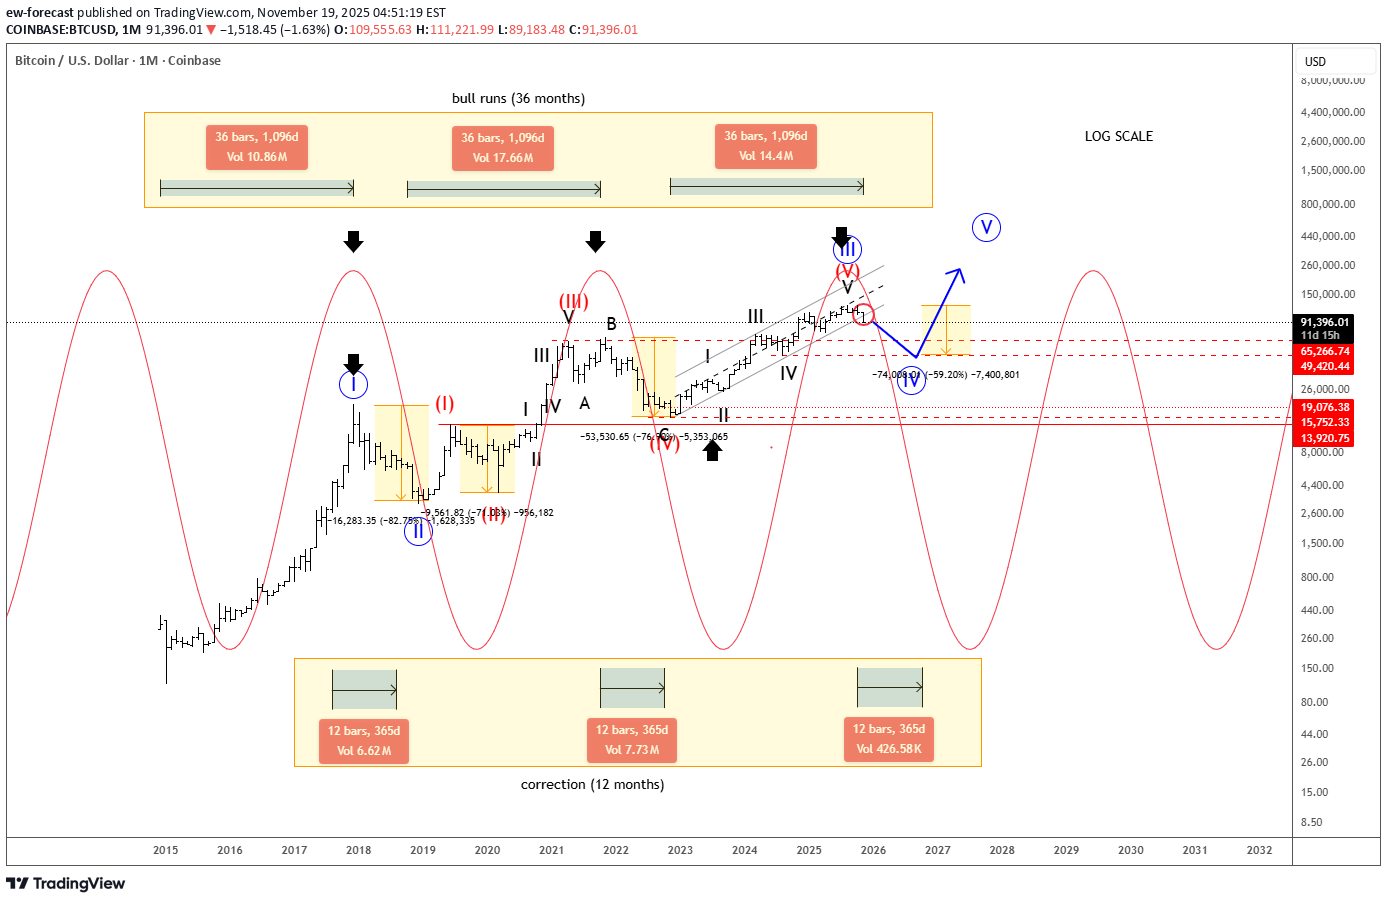
Bitcoin is breaking back below the $100k level and the channel support drawn from the 2022 lows. This price action suggests that we may be completing the bull cycle that began from those lows—one that lasted roughly three years, similar to previous bullish phases from January 2015 to December 2017 and December 2018 to November 2021. Given this context, there is now a meaningful risk of a deeper correction. Historically, each new cycle tends to produce shallower percentage pullbacks, but the correction phase is still an important part of the broader market structure. For those looking to position themselves for the next major bull run, it would be safer to wait for the market to undergo a sustained corrective period, potentially lasting around a year, before re-entering with the broader trend. From an Elliott Wave perspective, Bitcoin may have completed a five-wave impulse within a higher-degree wave (V) of III, aligning with the idea that a higher-degree wave IV correction could now be unfolding. Additionally, from a cyclical standpoint, the market appears to have topped in October 2025, which further supports the probability of entering a bear-market phase. In summary, Bitcoin may now be transitioning from a multi-year advance into a structurally significant corrective period—one that could provide a healthier foundation for the next major expansionary cycle.
ew-forecast
تحلیل تکنیکال MSTR: ریزش تا کجای حمایت؟ پیشبینی موج الیوت و چرخه زمانی
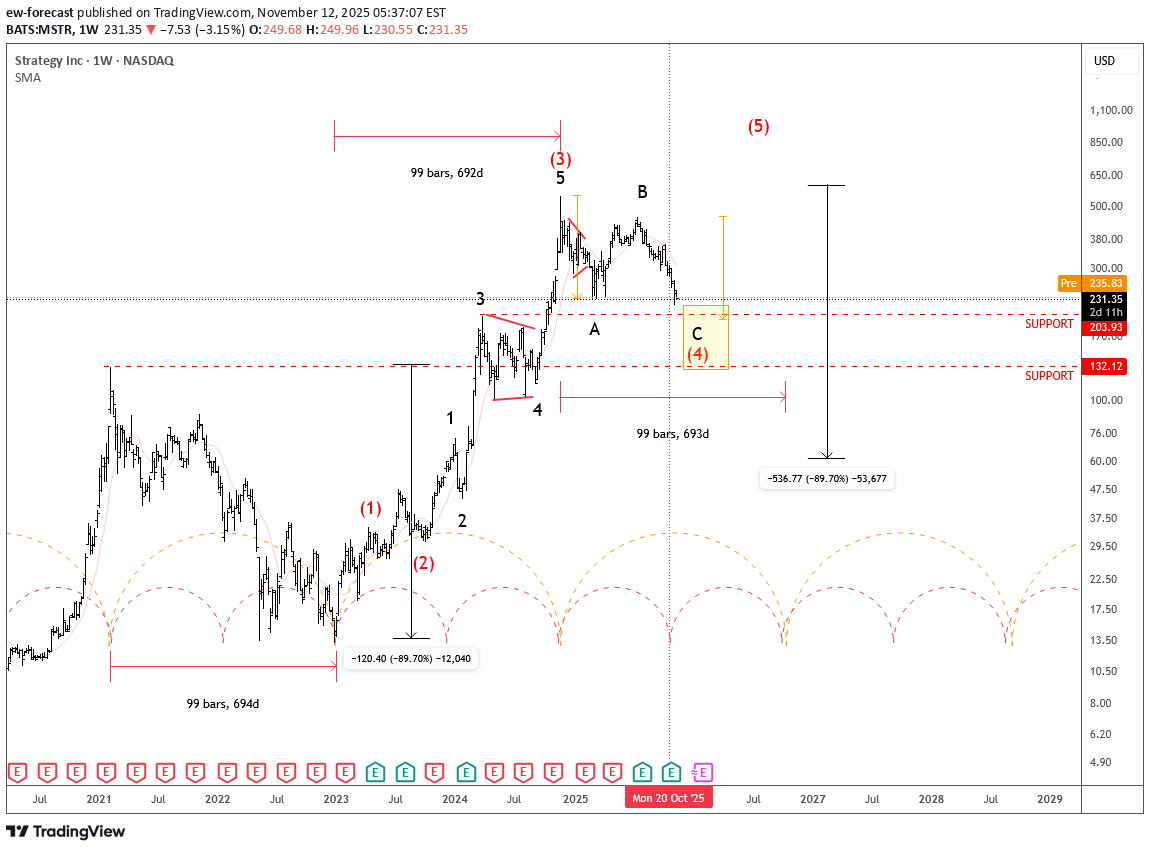
MicroStrategy has seen a strong uptrend since the December 2022 lows, but over the last year the market has been in a retracement phase. It appears that this could be another A-B-C setback within a higher-degree wave four, where subwave C could potentially retest the 200 area, or even extend toward the deeper 132 support. That level also aligns with the February 2021 high, making it an important zone to watch. Cycle-wise, it looks like we’re currently in the middle of a full cycle, suggesting that the correction could be moving into second half of this retracement, and may come to an end within the next few months. Ideally, we could then see a new turn higher in 2026, continuing the broader bullish trend. Highlights: Trend: Corrective pullback in wave four Support: 200 / 132 Cycle View: Mid-cylce; possible new rebound early 2026 Note: Structure fits within a broader five-wave bullish sequence, with strong long-term trend intact GH
ew-forecast
اگر فدرال رزرو متوقف شود، طلا هم متوقف میشود: چه زمانی برای خرید طلا صبر کنیم؟
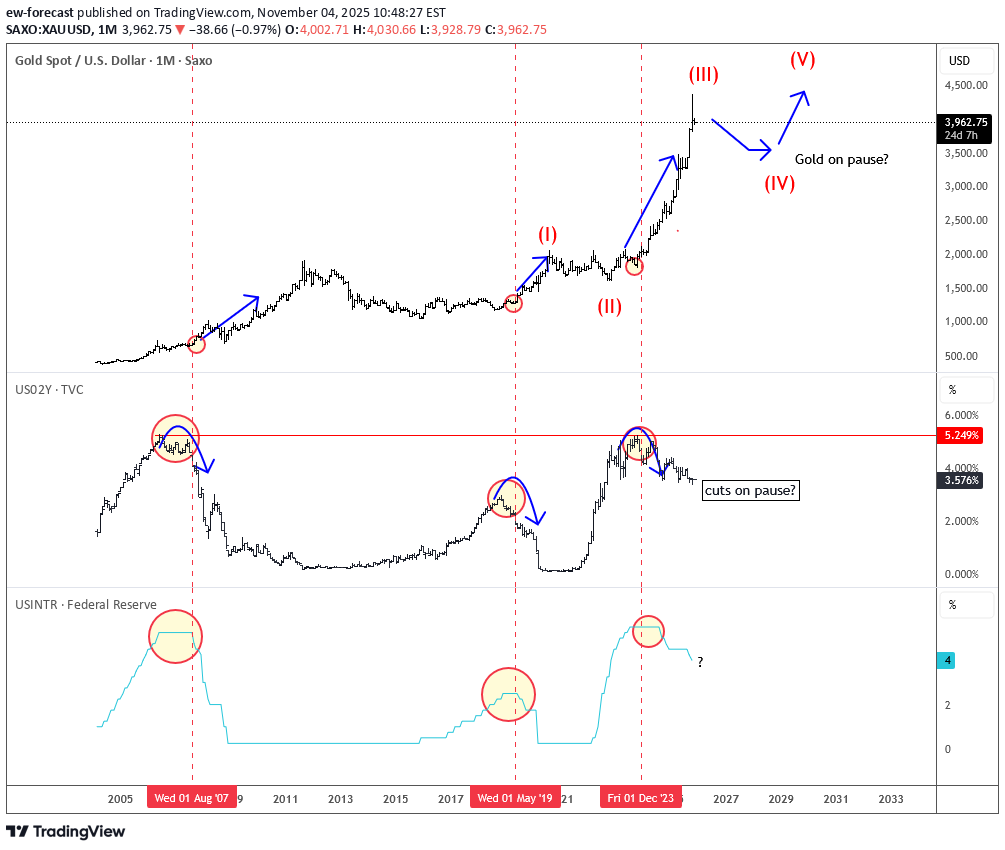
As you may have noticed, gold has seen a sharp reversal in recent weeks, and many traders and investors are now wondering whether this correction will be quick and shallow or last longer. From an Elliott Wave perspective gold seems like it may try to complete an extended wave three, and put wave four pause in play. But what can trigger a retracement? Well we need to consider US monetary policy. Powell didn’t convince markets last week about further cuts in December, so if rates stay on hold for the next few months or even longer, gold may continue to pause. The metal usually rallies more easily when expectations for rate cuts rise, not fall. So, both from a macro and wave perspective, this likely fits as a higher-degree fourth-wave correction. Overall, this correction could last longer, and once deeper prices flush out late buyers and weaker positions — possibly in the coming months — that’s when we’ll likely be more confident calling for the next major leg higher, ideally early in 2026. So looking to buy? Patience! Grega
ew-forecast
صعود انفجاری انویدیا: آیا قله ۲۳۰ در دسترس است؟ تحلیل موجی و نقاط ورود طلایی!
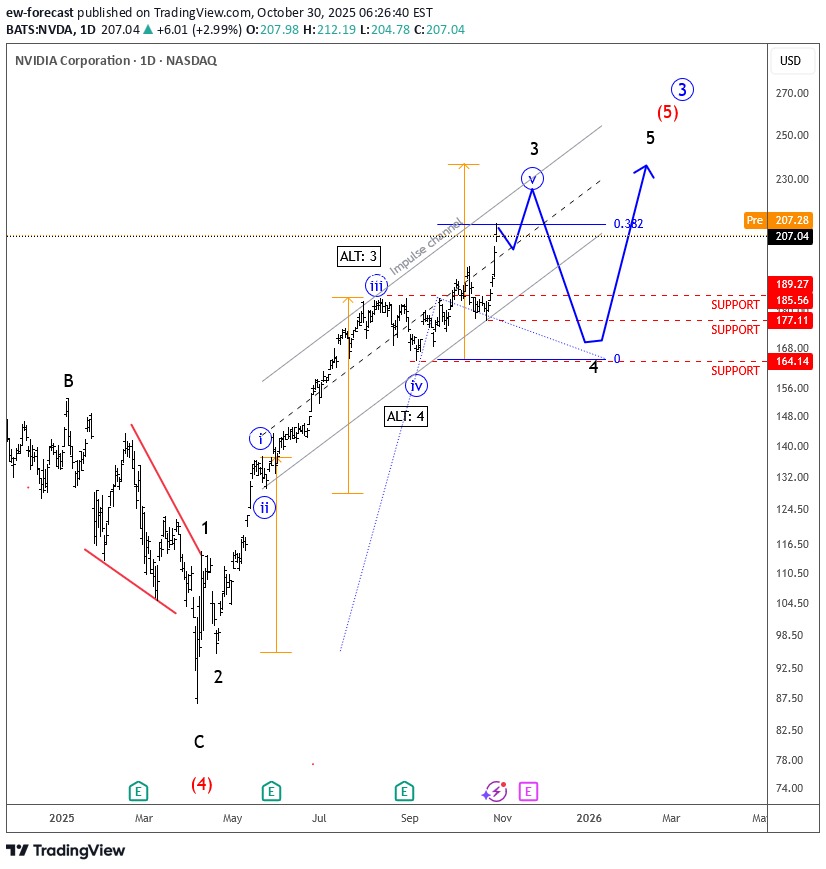
Nvidia is making more upside this week, now trading above the 200 level on optimism that the US and China could reach a tariff deal. From an Elliott Wave perspective, the stock still appears to be in wave five, with an extended higher-degree black wave three now approaching its first resistance around the 38.2% projection. If risk-on sentiment continues, the price may even retest the upper side of the Elliott Wave channel near the 230 area. This suggests that Nvidia could be entering an important zone where the higher-degree black wave three might complete, followed later by a deeper fourth-wave retracement before more upside resumes. So, I would stay patient and watch for a possible dip toward the 164–185 area once wave four begins. Highlights: Trend: Ongoing uptrend; wave five still in progress Potential: Reaching 230 resistance before wave four pullback Support: 164–185 zone Invalidation: Below 164 Note: Watch for signs of exhaustion near 230; next deep could offer new opportunity
ew-forecast
اصلاح قیمت کاسپا پس از جهش بزرگ: آیا فرصت خرید جدیدی در راه است؟
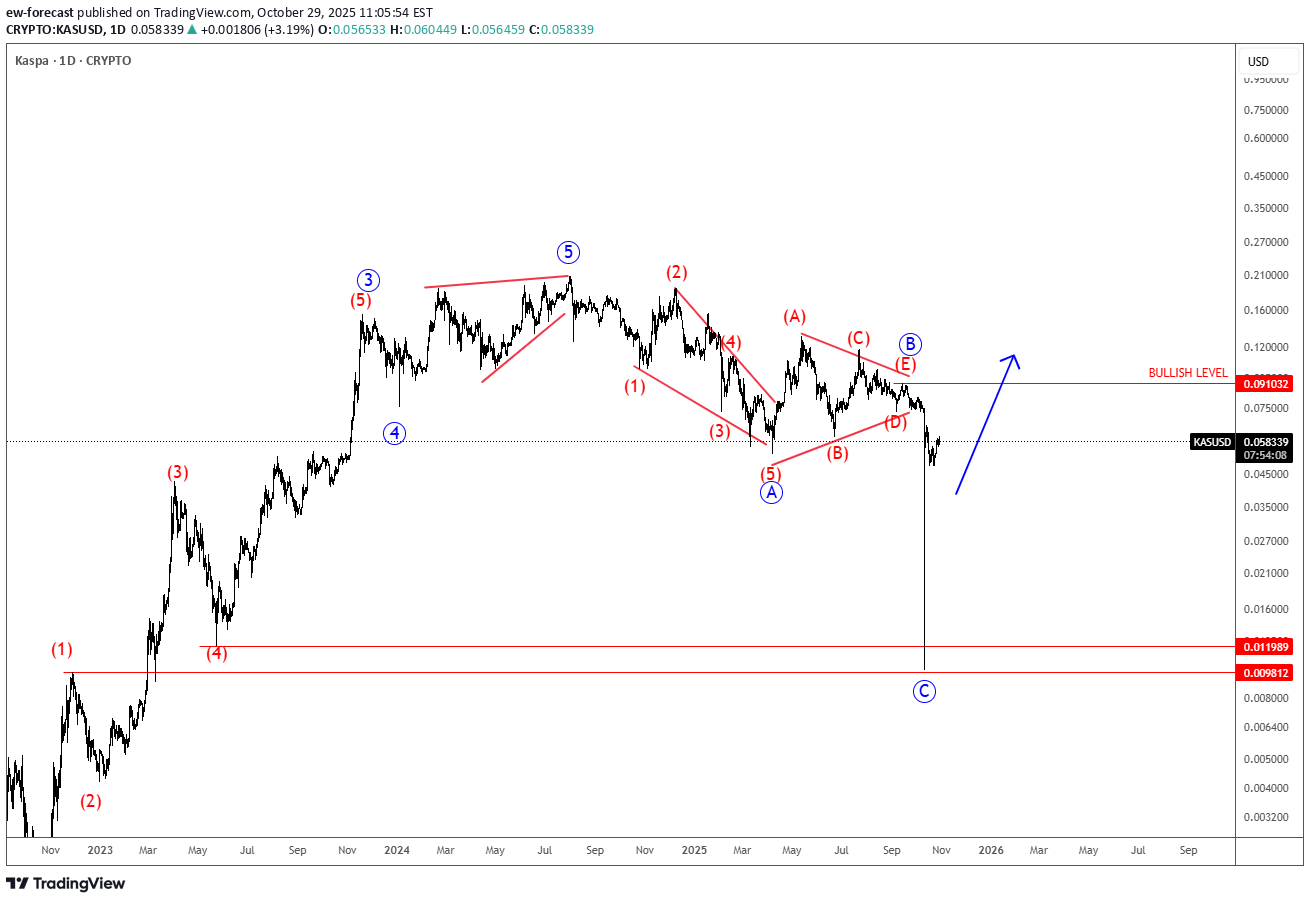
Kaspa Completes A Correction After A Huge Spike that can be supportive, as we see a corrective structure within the uptrend by Elliott wave theory. Kaspa is a proof-of-work (PoW) cryptocurrency that uses the novel GHOSTDAG protocol (a block-DAG consensus rather than a single linear chain) to allow many blocks to be produced more rapidly and co-exist. It was launched without an ICO / pre-mine (fair launch) and positions itself as more scalable than many PoW chains. Because of this, it has attracted interest as a “next-gen PoW” or “fast chain” alternative. Kaspa’s sell-off appears of a combination of leveraged long liquidations intensifying a move down, weak macro/altcoin sentiment and structural risks (adoption/supply concentration). Despite a massive price drop, sparking fear and pessimism across the market, such deep pullbacks often create opportunity rather than signal failure. Despite the volatility, Kaspa’s fundamentals remain solid. Its innovative GHOSTDAG technology, fair launch, and strong network activity continue to set it apart. When fear dominates and sentiment turns overly negative, it can actually be a supportive setup for long-term investors looking to accumulate quality projects at discounted levels. From Elliott wave perspective, KASUSD(Kaspa) spiked down out of a wave B triangle pattern into wave C, so it’s a higher degree ABC correction. It still looks promising for the future, and we may still see some rally in the current bullish cycle. Bullish confirmation is above 0.091 area.
Disclaimer
Any content and materials included in Sahmeto's website and official communication channels are a compilation of personal opinions and analyses and are not binding. They do not constitute any recommendation for buying, selling, entering or exiting the stock market and cryptocurrency market. Also, all news and analyses included in the website and channels are merely republished information from official and unofficial domestic and foreign sources, and it is obvious that users of the said content are responsible for following up and ensuring the authenticity and accuracy of the materials. Therefore, while disclaiming responsibility, it is declared that the responsibility for any decision-making, action, and potential profit and loss in the capital market and cryptocurrency market lies with the trader.