
Fractical
@t_Fractical

What symbols does the trader recommend buying?
Purchase History
پیام های تریدر
Filter
تئوری امواج الیوت برای مبتدیان: چطور با جهتگیری بازار سود کنید؟
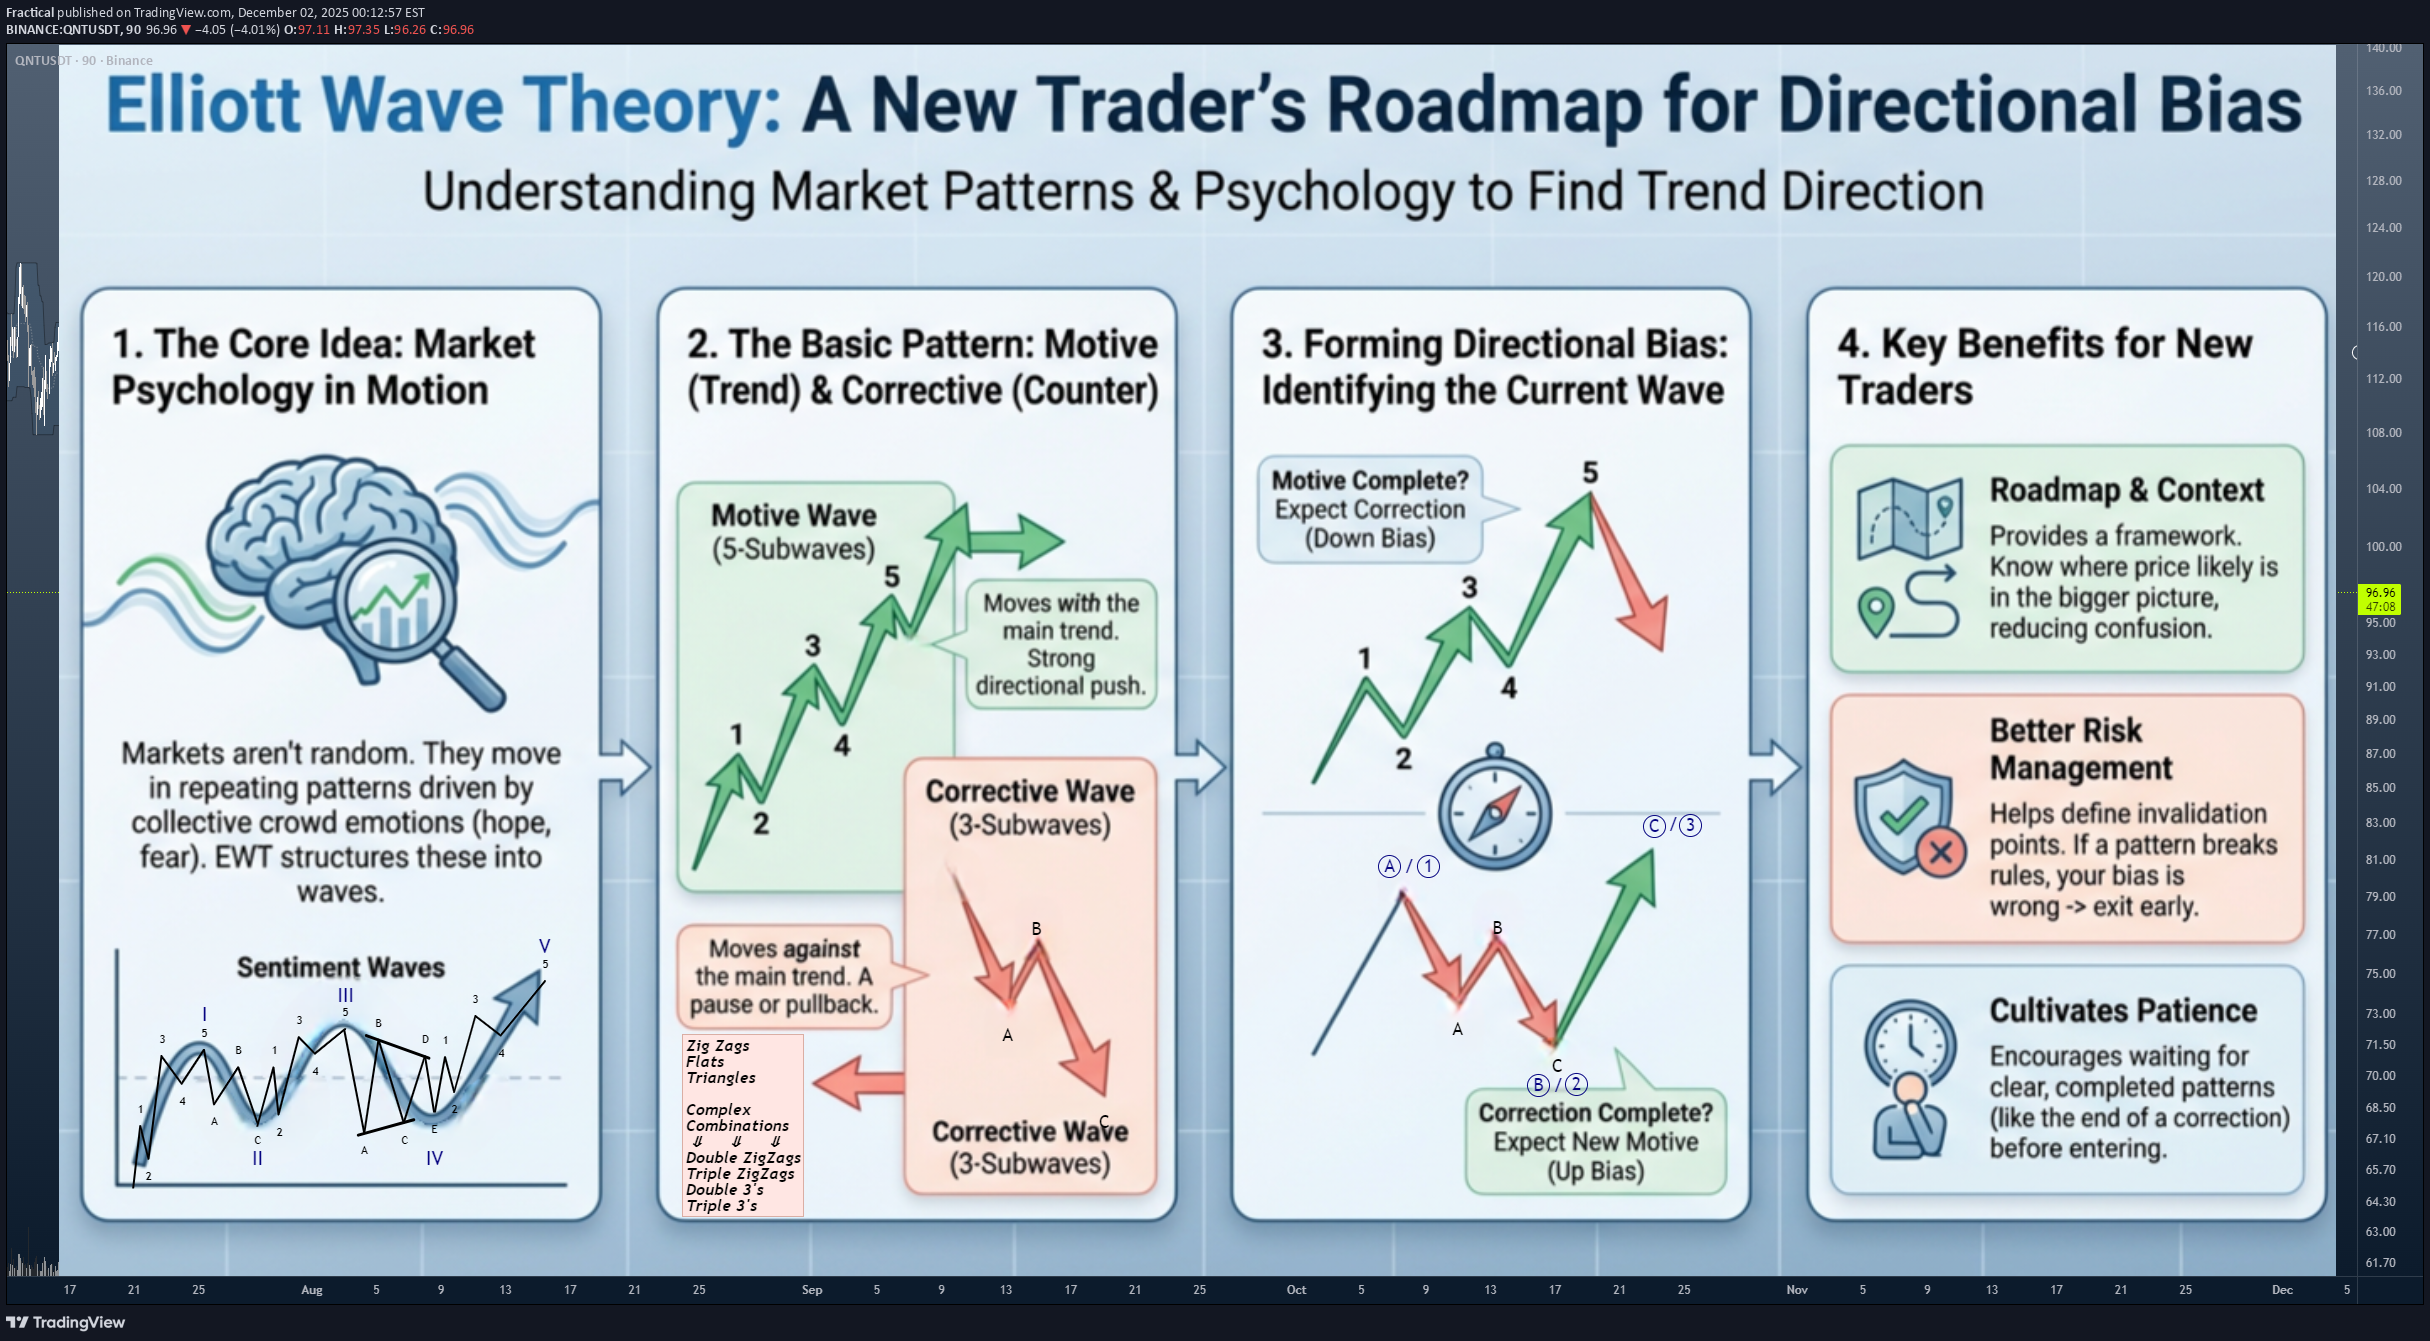
Here is a brief visual roadmap showing how a beginner to the wave theory can still access the main benefit of EW Theory... Directional Bias! That thing that keeps you in profit and with the trend, even if you misdiagnose a pattern or have an errant wave count. I've highlighted some of the key benefits to having the correct directional bias and some of the most important properties of using The Elliott Wave Theory as a beginner! I hope this is helpful to someone, if you are struggling with your current trading system or methodology or just someone who needs a different approach, dig into the Elliott Wave Principal as this "Theory" has no doubt changed my life for the better! For Educational Purposes Only.
تحلیل موج الیوت بیت کوین: راز موج ۲ و پیشبینی قیمت بالای ۱ میلیون دلار!

Shown on the chart is BTCUSD:BITSTAMP on the Weekly Timeframe. This is a breakdown of the Multi 1,2 Elliott Wave Scenario plotted on the chart. This is by far my most bullish scenario for Bitcoin, as we haven't even reached the main wave 3 thrust up, i know its hard to fathom BTC over 1 million dollars, but this is one way to get us beyond that. Historically the 1,2 pattern has mimicked past 1,2 fractals, usually returning smaller gains and retracements compared to its past 1,2 structure. This is only a guideline for the 1,2 pattern and not a hard rule, although BTC has maintained the right look for this Multi 1,2 Structure throughout its cycle. We are already on the 4th 1,2 pattern continuing the bullish movement to the upside. I have this degree of trend as the final 1,2 before the wave 3 thrust up. Probabilities get lower the more 1,2s we build leading to the 3rd of 3rd of 3rd of 3rd wave thrust, this is already a dream scenario on the Weekly Timeframe, not often do we see these "Rare Unicorn" patterns play out on a HTF, but more often on <15 min TF the rare pokemon are spotted more frequently. I have highlighted my preferred buy area for the coming wave 2 pullback. The 2nd waves have reached higher fib ratios while still remaining smaller than the previous 1,2 ratios, showing the right look between impulsive and corrective structures thus far. Considering this, wave 2 could surprise us all (MMs known for this) and retrace to the .618 - .66 Golden Pocket area, while still remaining smaller than its past 1,2 fractal. I hope someone finds this useful or at least interesting! Happy Trading
QNT AWAKENED! Elliott Wave Analysis! Zoom into LTFs. Bullish!!

4 hour TF shows QNT making good progress towards the 1st wave in teal. As shown in the image included with this post, we have recently finished a wave 4 running triangle correction to the downside. Next, wave 5 should press onwards, if my wave 5 extends beyond $106.82 / the red 1:1 fib ratio of wave 3, it will invalidate this leg of the impulse and i will have to rework the wave count on this 3rd wave in aqua green color.
When will QNT break its ATH? Lets count the Elliott Waves!

I have provided my Macro Double 1,2 Impulse Elliott Wave count for Quant cryptocurrency. I have plotted the forecast as i see it using Fibonacci targets as confluence, as well as "The Right Look" as this is more important than any one Fib Target in Elliott Waves. I expect wave 3 in Teal (Subdegree impulse of Red Impulse) to be our biggest wave 3 to the upside, this will be followed by the 4,5s in Red, and Lime impulses building to the upside, this should create a diagonal looking structure after the obvious wave 3 thrust has finished. This is a longterm analysis and the pattern could go on beyond the mid 2029 area as i have marked out, or it could be a bit shorter in time, im no Gann trader yet so we will have to stick with the structure provided by Elliott Waves. Also plotted are the Base Channels for both main impulses. Using the Kennedy Channeling Technique you expect the wave 4 pullback to find support at the top or midline of base channel. This is just scratching the surface using the Kennedy Channels, as any more channels would make this chart less aesthetically pleasing and too busy. Happy Trading! See ya in 2029!
Using simple volume for added confluence in Elliott Wave Theory!
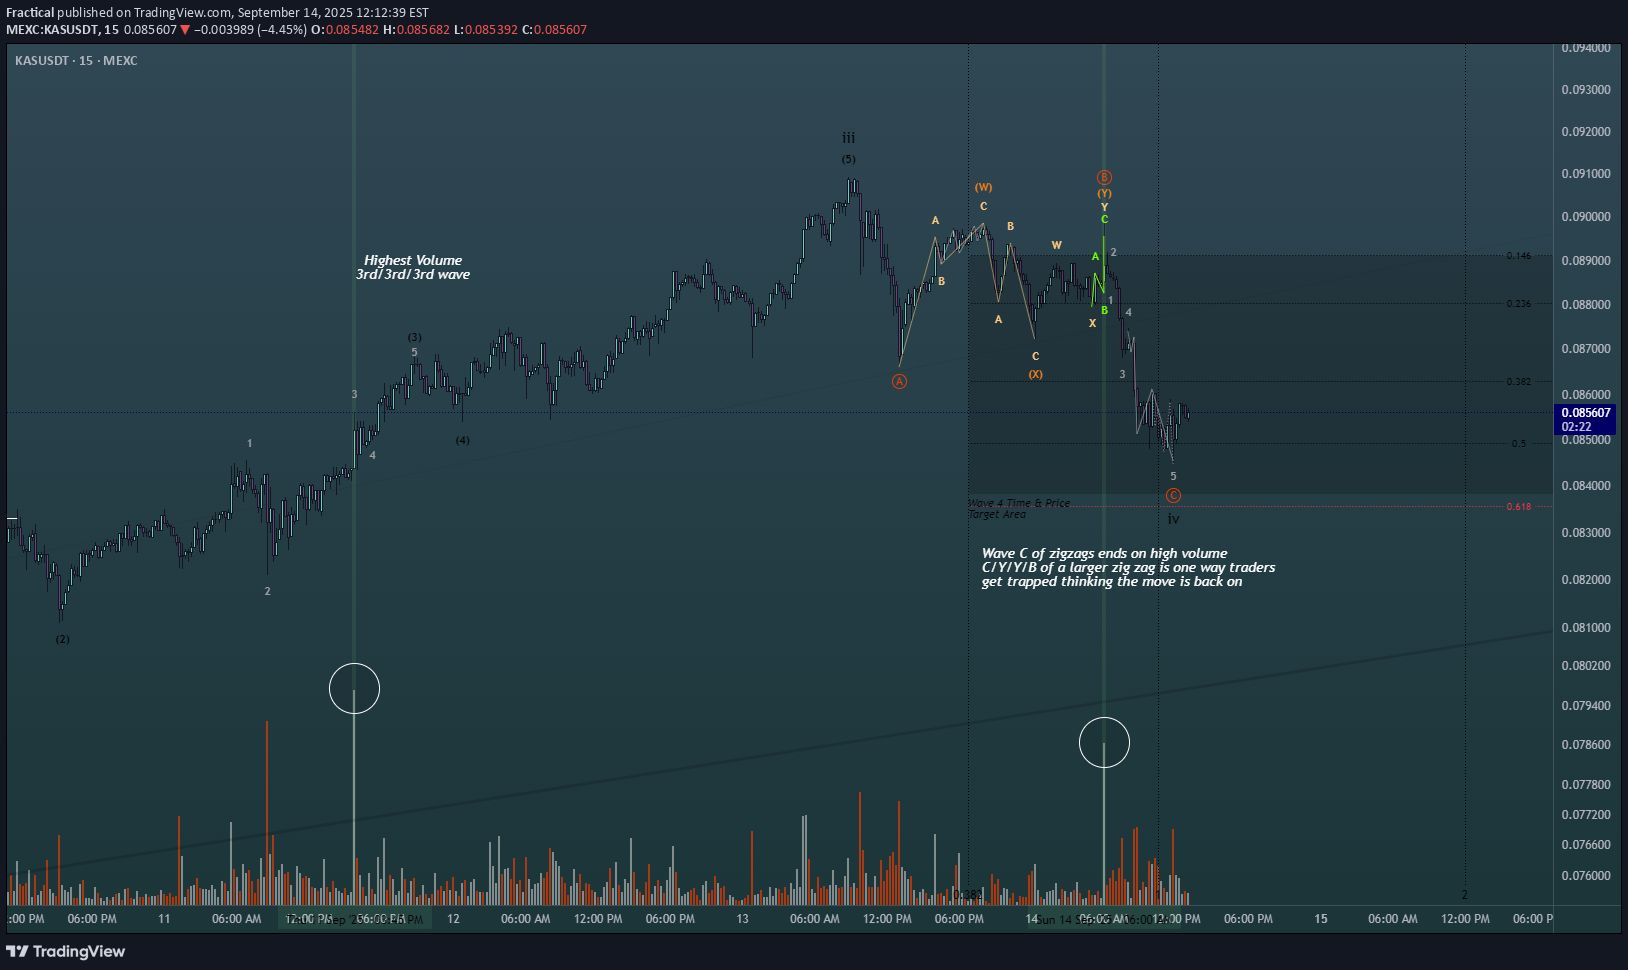
Shown on the chart is 2 of the ways you can use the highest volume spikes on the chart to find out where you are in the wave count. Easiest way is to find the highest volume with the steepest slope of trend to label as your third wave. Same concept whether its bearish bars printing or bullish bars. The highest volume shown is actually part of the retracement, albeit in one of the actionary waves (moving with trend), alot of buying happened at the termination of the wave C of the zig zag shown in green. Perfect scenario to rake in buy orders from retail then dump on them to finish out the WXY pattern. This is just 2 of the many scenarios in which you can find help from the volume oscillator to give you a directional bias in Elliott Waves. Happy Trading
HTF Elliott Wave Count on HBAR! Super Bullish!!

Here is the macro bullish outlook on HBAR using the Elliott Wave Theory. Currently we are making progress to the upside to complete the grey wave 5 to finish the leading diagonal in white. Next expect a retracement between .21 (extreme of wave 4) - .18 (.618 of diagonal), it could retrace deeper as is common with a wave 2, although the extreme bullish nature of this impulsive structure makes me think it could be a shallow retracement (38.2% - 50%) before blasting off on everyone looking for their entry to be hit. Exciting times ahead for HBAR i believe. Happy Trading
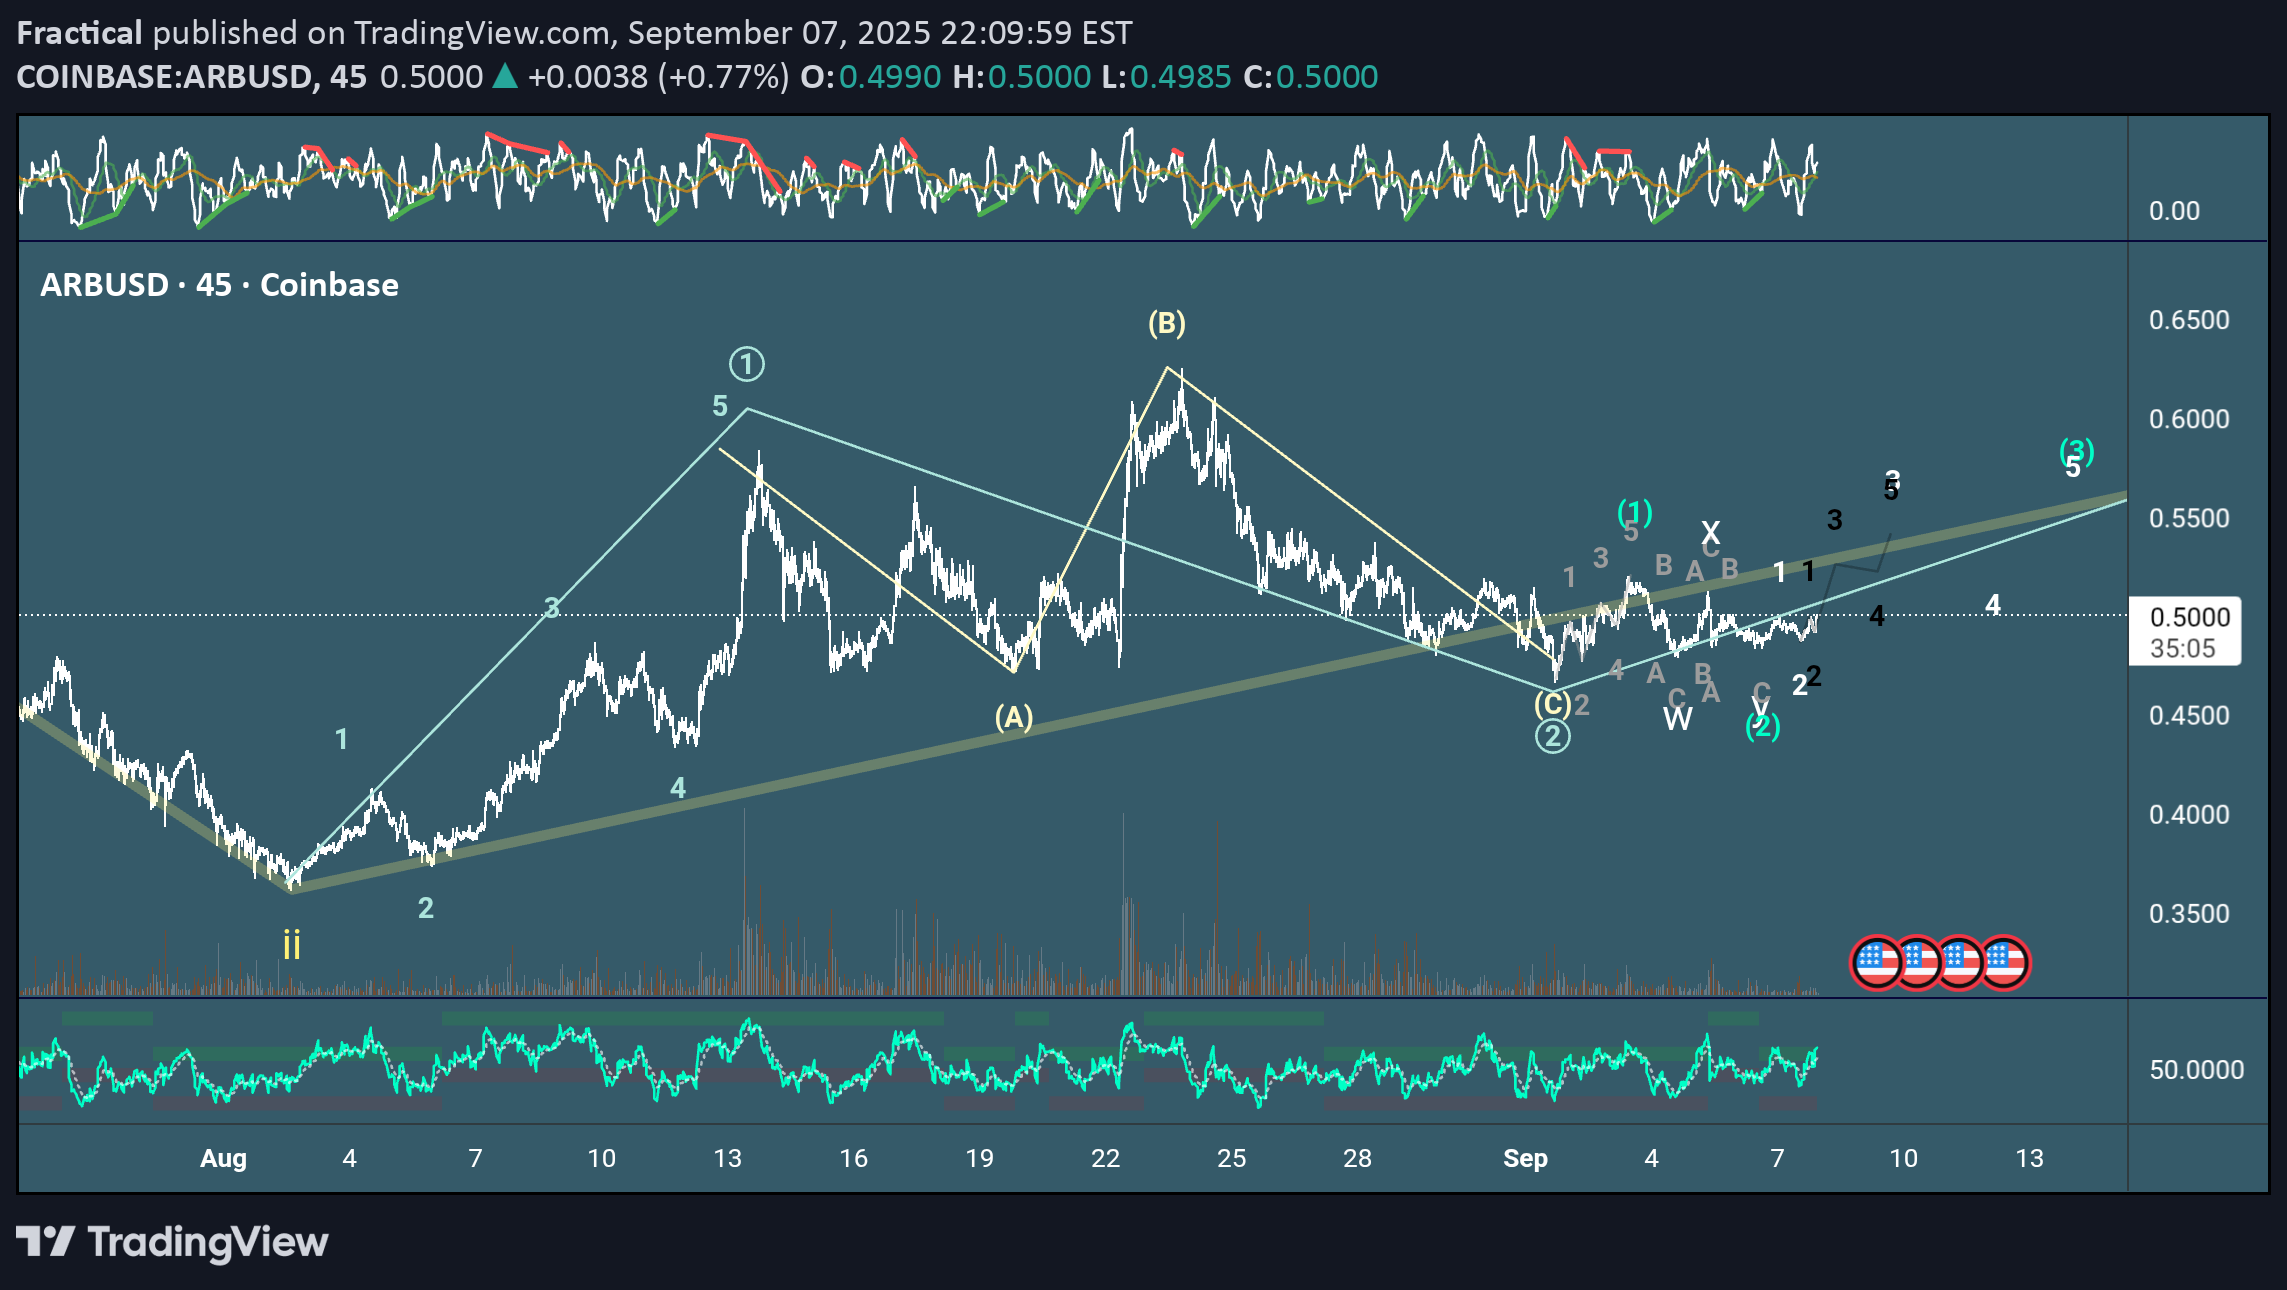
Arbitrum wave 3 Extension could play out like this past fractal.
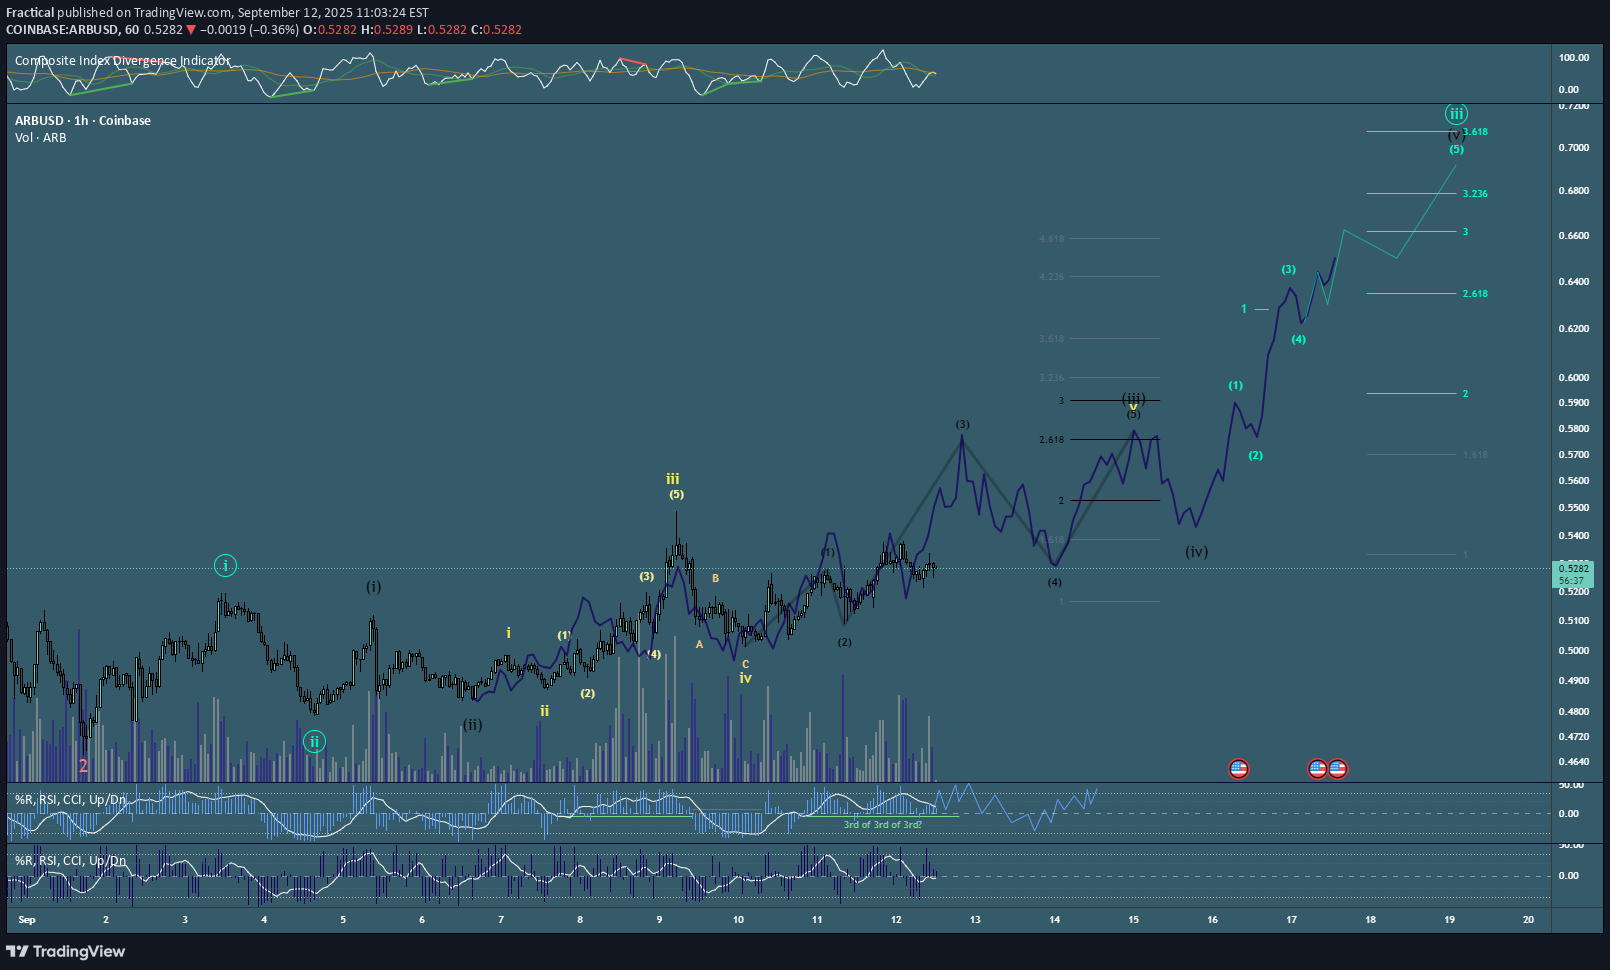
ARBUSD looks ready to charge ahead with this wave 3 extension. I have plotted a bar pattern of a fractal that played out similar to this structure. Yellow wave 5 must show a significant extension in one of its waves (3 or 5) in order to reach beyond the price extreme of its wave 3 (wave 1 already finished). Several alts seem to be following a similar fractal from their historical price action. This is a continuation of a past idea, just with more information. In reality this extension i have plotted is the 3rd of the 3rd wave for the macro impulse in red. oof my head hurts xD. Happy Trading
Focused on this fractal playing out for Arbitrum

The impulse wave highlighted in green showcases an impulse with a similar structure of its extended waves, compared to the idea i have plotted inside of the black impulses wave 3. So I stretched it to fit into my higher timeframe view. Let's see what happens!
TAO triple 1,2 impulse to the upside!
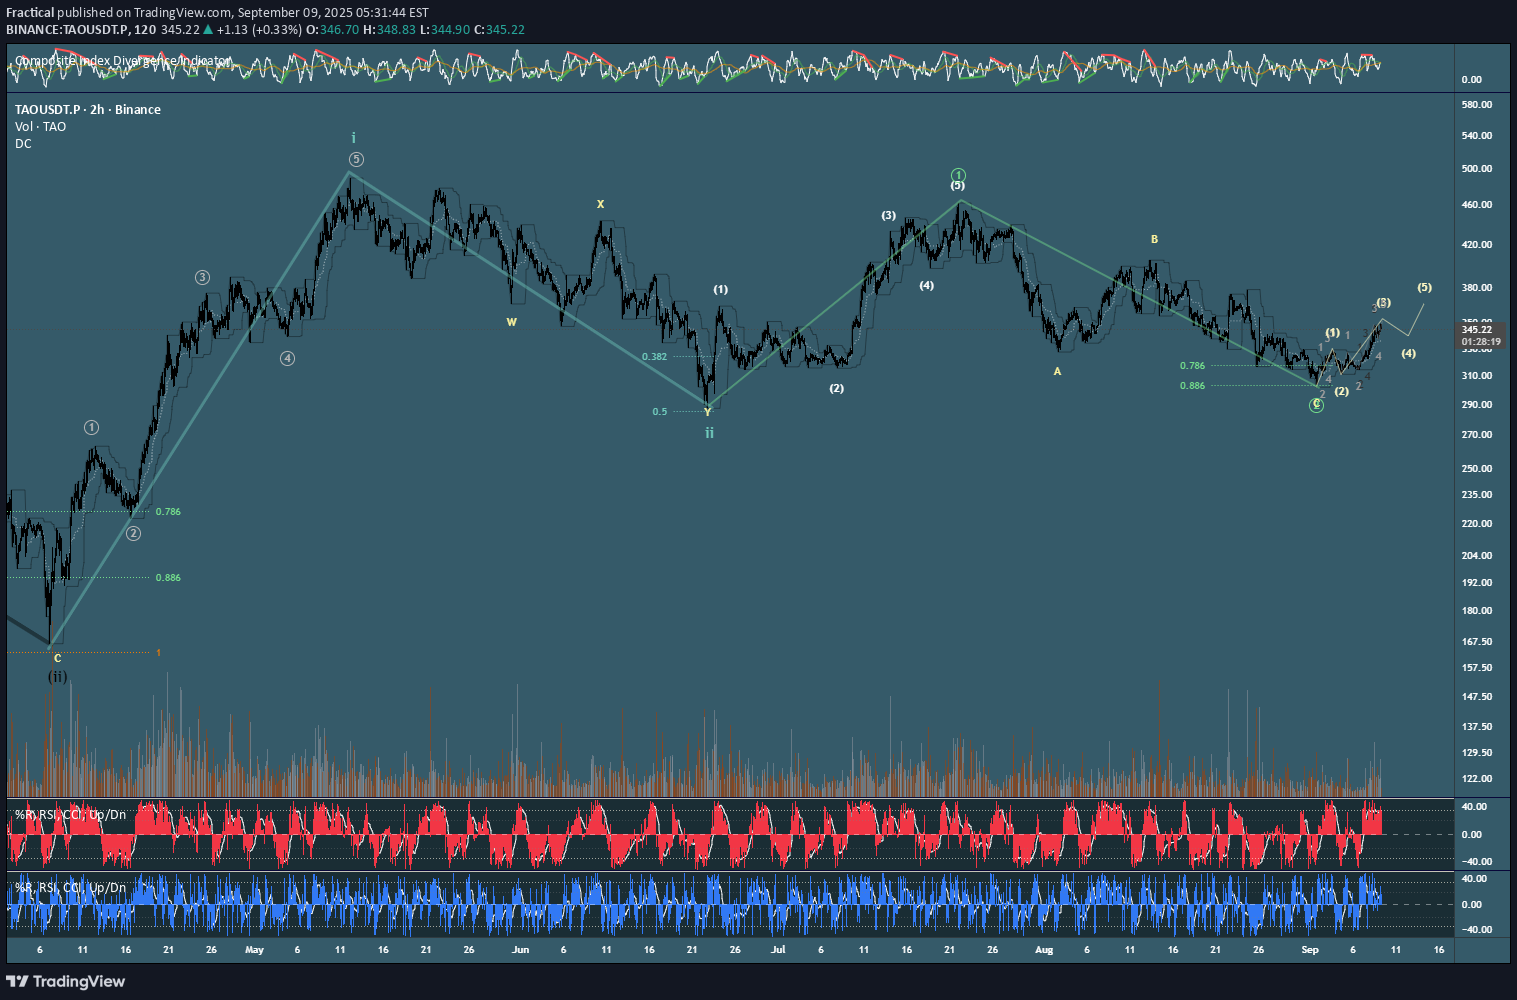
Super bullish pattern forming in this bullish scenario on TAO. HTF 1,2 in black finished with a deep retracement. Second 1,2 in light blue finished with a retracement to the 0.5. The third micro 1,2 in green finished with a deep retracement to .886 Fib. Since then we chopped around the bottom with our LTF lower degree 1,2 structures to form the base of the extended wave 3 thats coming (or here now!). It could be counted as such that this wave 3 has already formed its own double 1,2 structure which gives more confluence to a massive rally. Several alts are showing similar patterns. Is alt season yet? xD Happy Trading
ARB Bullish Multi 1-2 impulse! Many Alts show a similar pattern
As shown we finished out wave 2 with an expanding flat correction. We then chopped around in several lower degree Multi 1-2 structures in the latest 1,2 1,2 price action. Wave 3, once started should show clear signs of increasing volume as well as an increase in the degree of slope compared to past impulse waves. Should be a nice move if wave 3 is underway! Happy Trading
Disclaimer
Any content and materials included in Sahmeto's website and official communication channels are a compilation of personal opinions and analyses and are not binding. They do not constitute any recommendation for buying, selling, entering or exiting the stock market and cryptocurrency market. Also, all news and analyses included in the website and channels are merely republished information from official and unofficial domestic and foreign sources, and it is obvious that users of the said content are responsible for following up and ensuring the authenticity and accuracy of the materials. Therefore, while disclaiming responsibility, it is declared that the responsibility for any decision-making, action, and potential profit and loss in the capital market and cryptocurrency market lies with the trader.