
CRYPTOMOJO_TA
@t_CRYPTOMOJO_TA

What symbols does the trader recommend buying?
Purchase History
پیام های تریدر
Filter
CRYPTOMOJO_TA
CRV شکست خط روند نزولی: آیا زمان پرواز فرا رسیده است؟

CRV just broke the downtrend. This is how big moves usually start. 👀 If the breakout holds, we fly. 🚀
CRYPTOMOJO_TA
شکست خط روند FET: آیا قیمت به ۰.۴۰ دلار میرسد؟

FET finally broke the trendline. 🚀 We flipped support, EMAs turned upward, and buyers are stepping back in. As long as price holds above this breakout, upside toward $0.35–$0.40 is on the table. Momentum is building. 👀
CRYPTOMOJO_TA
دوج کوین ترکید! آیا این روند صعودی جدید است؟ (هدف بعدی ۰.۱۵ دلار)

#DOGE just broke out. 🚀 The downtrend is finally over and momentum is flipping bullish. As long as price holds above the breakout, $0.15 is the next target. Looks strong. 👀
CRYPTOMOJO_TA
نقطه عطف حیاتی SUI: آیا اوج میگیرد یا سقوط میکند؟
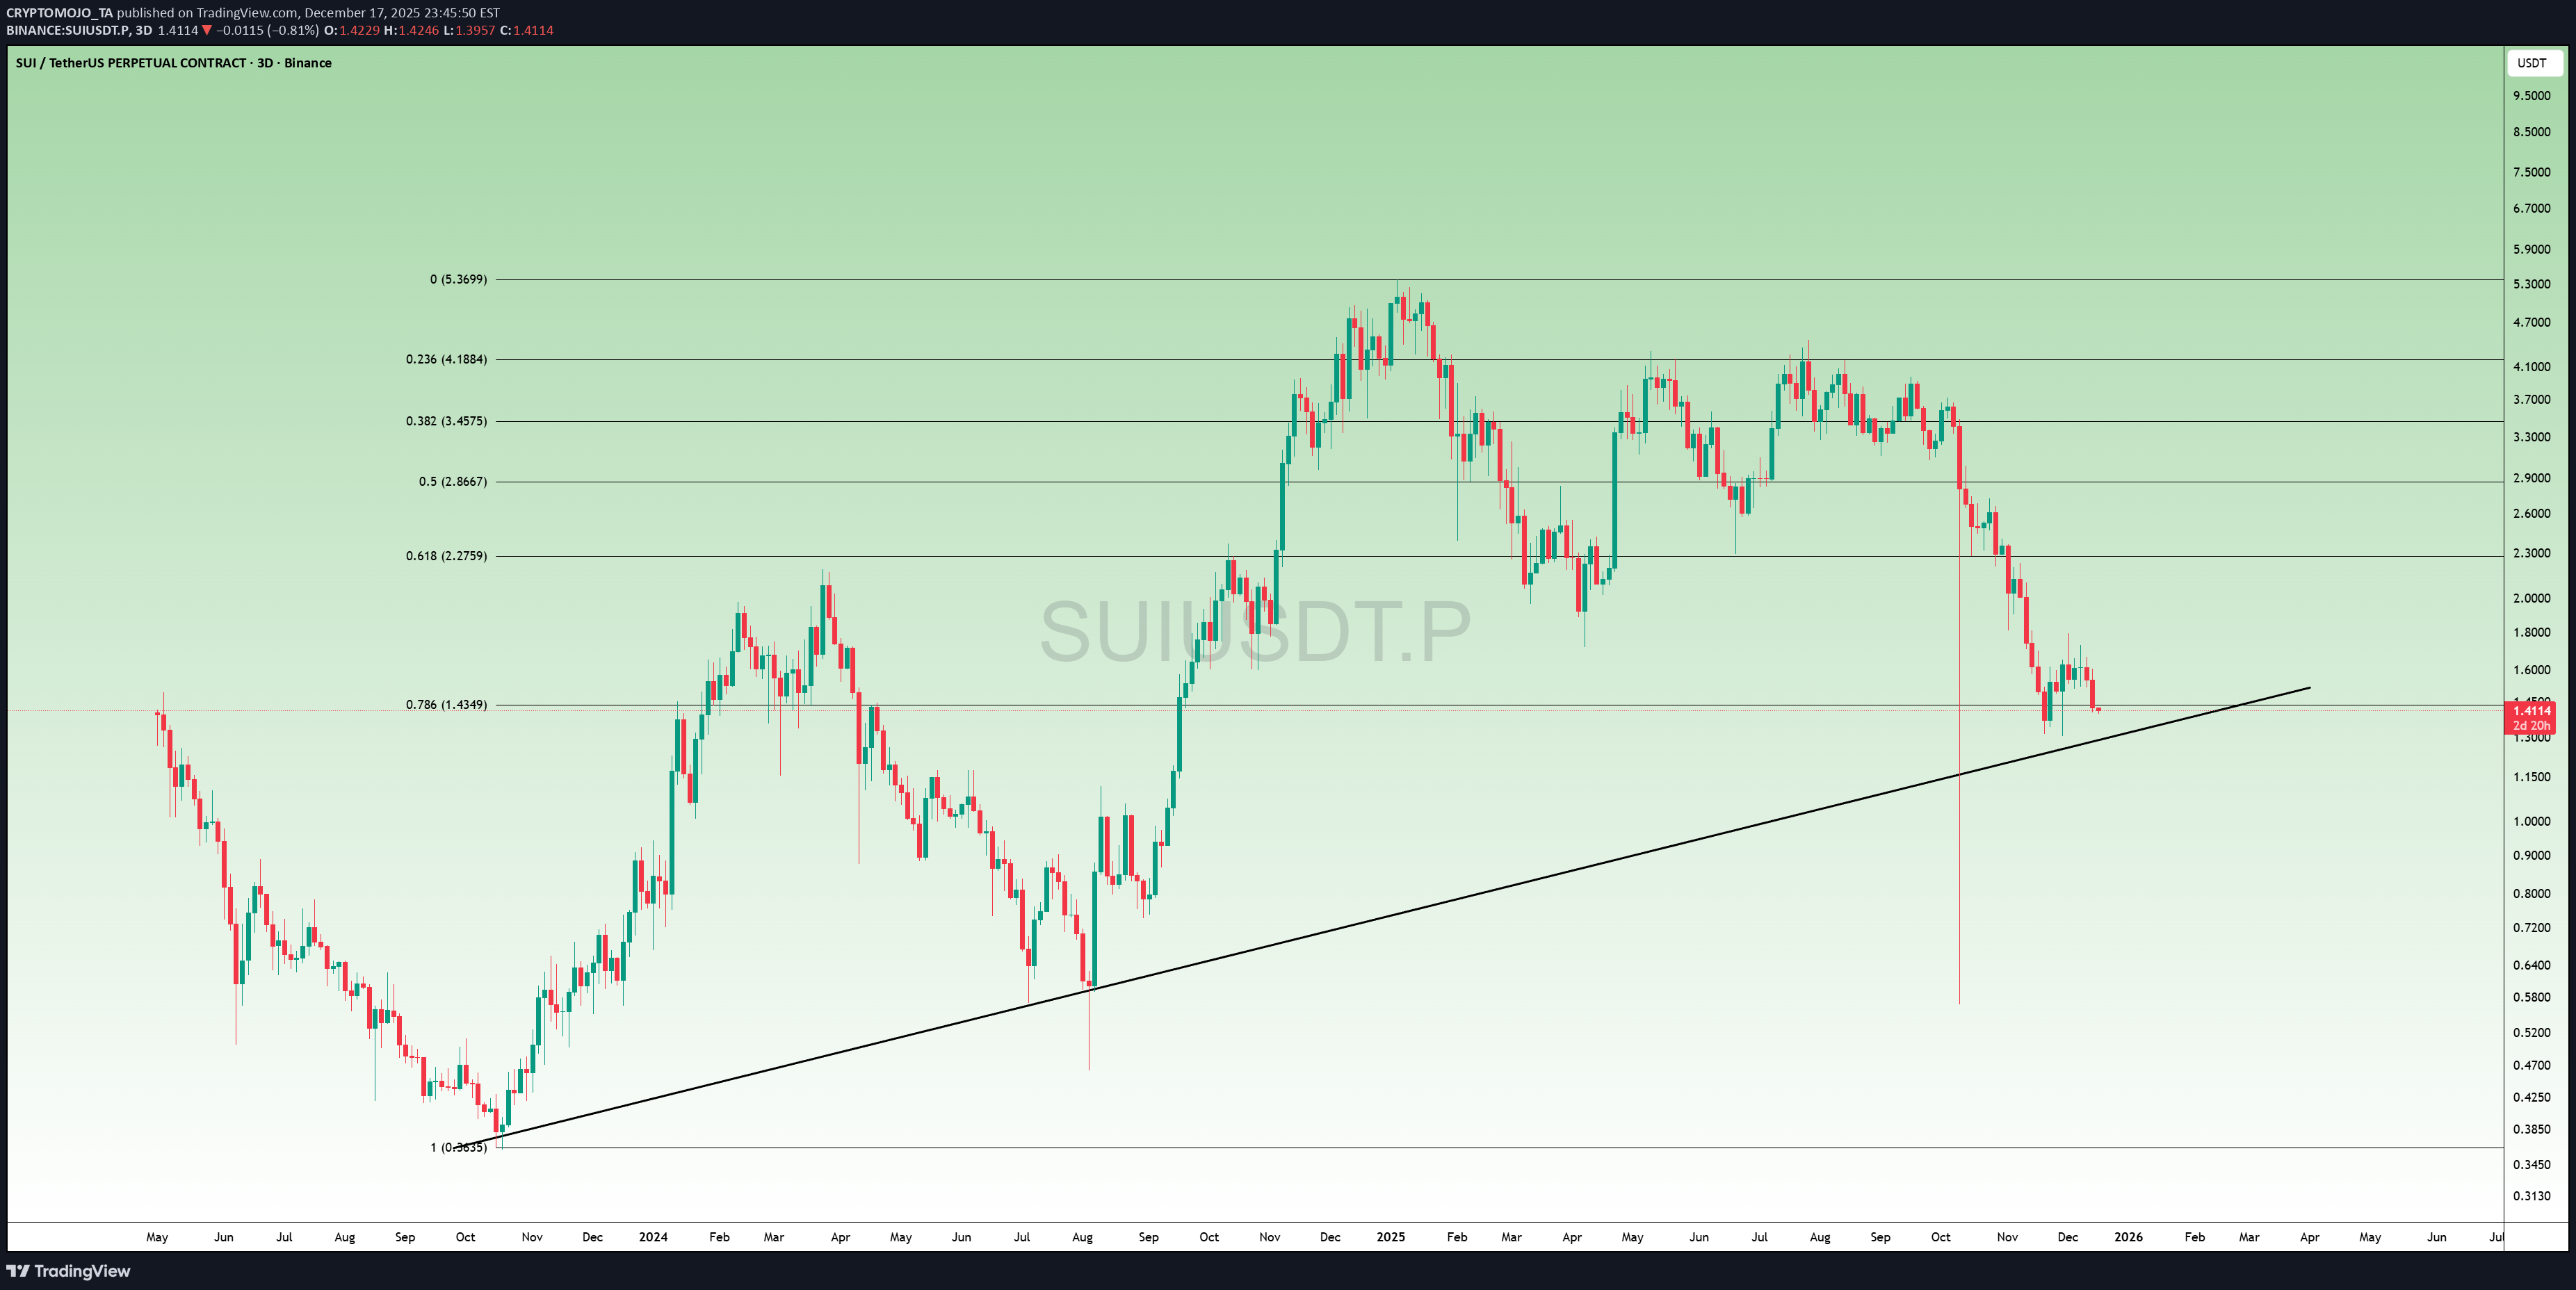
#SUI is now sitting on a major long-term trendline a level that has held since launch. 👀 Every time the price touched this trendline, SUI started a strong move up. We’re back here again… right at support + near the 0.786 Fib zone. If buyers step in, a bounce toward $2.2 → $2.8 is the next key target. If this level breaks, only then do we look lower. Big moment for SUI. Stay alert. #Crypto
CRYPTOMOJO_TA
CRYPTOMOJO_TA
QNT's Big Move Is Coming!
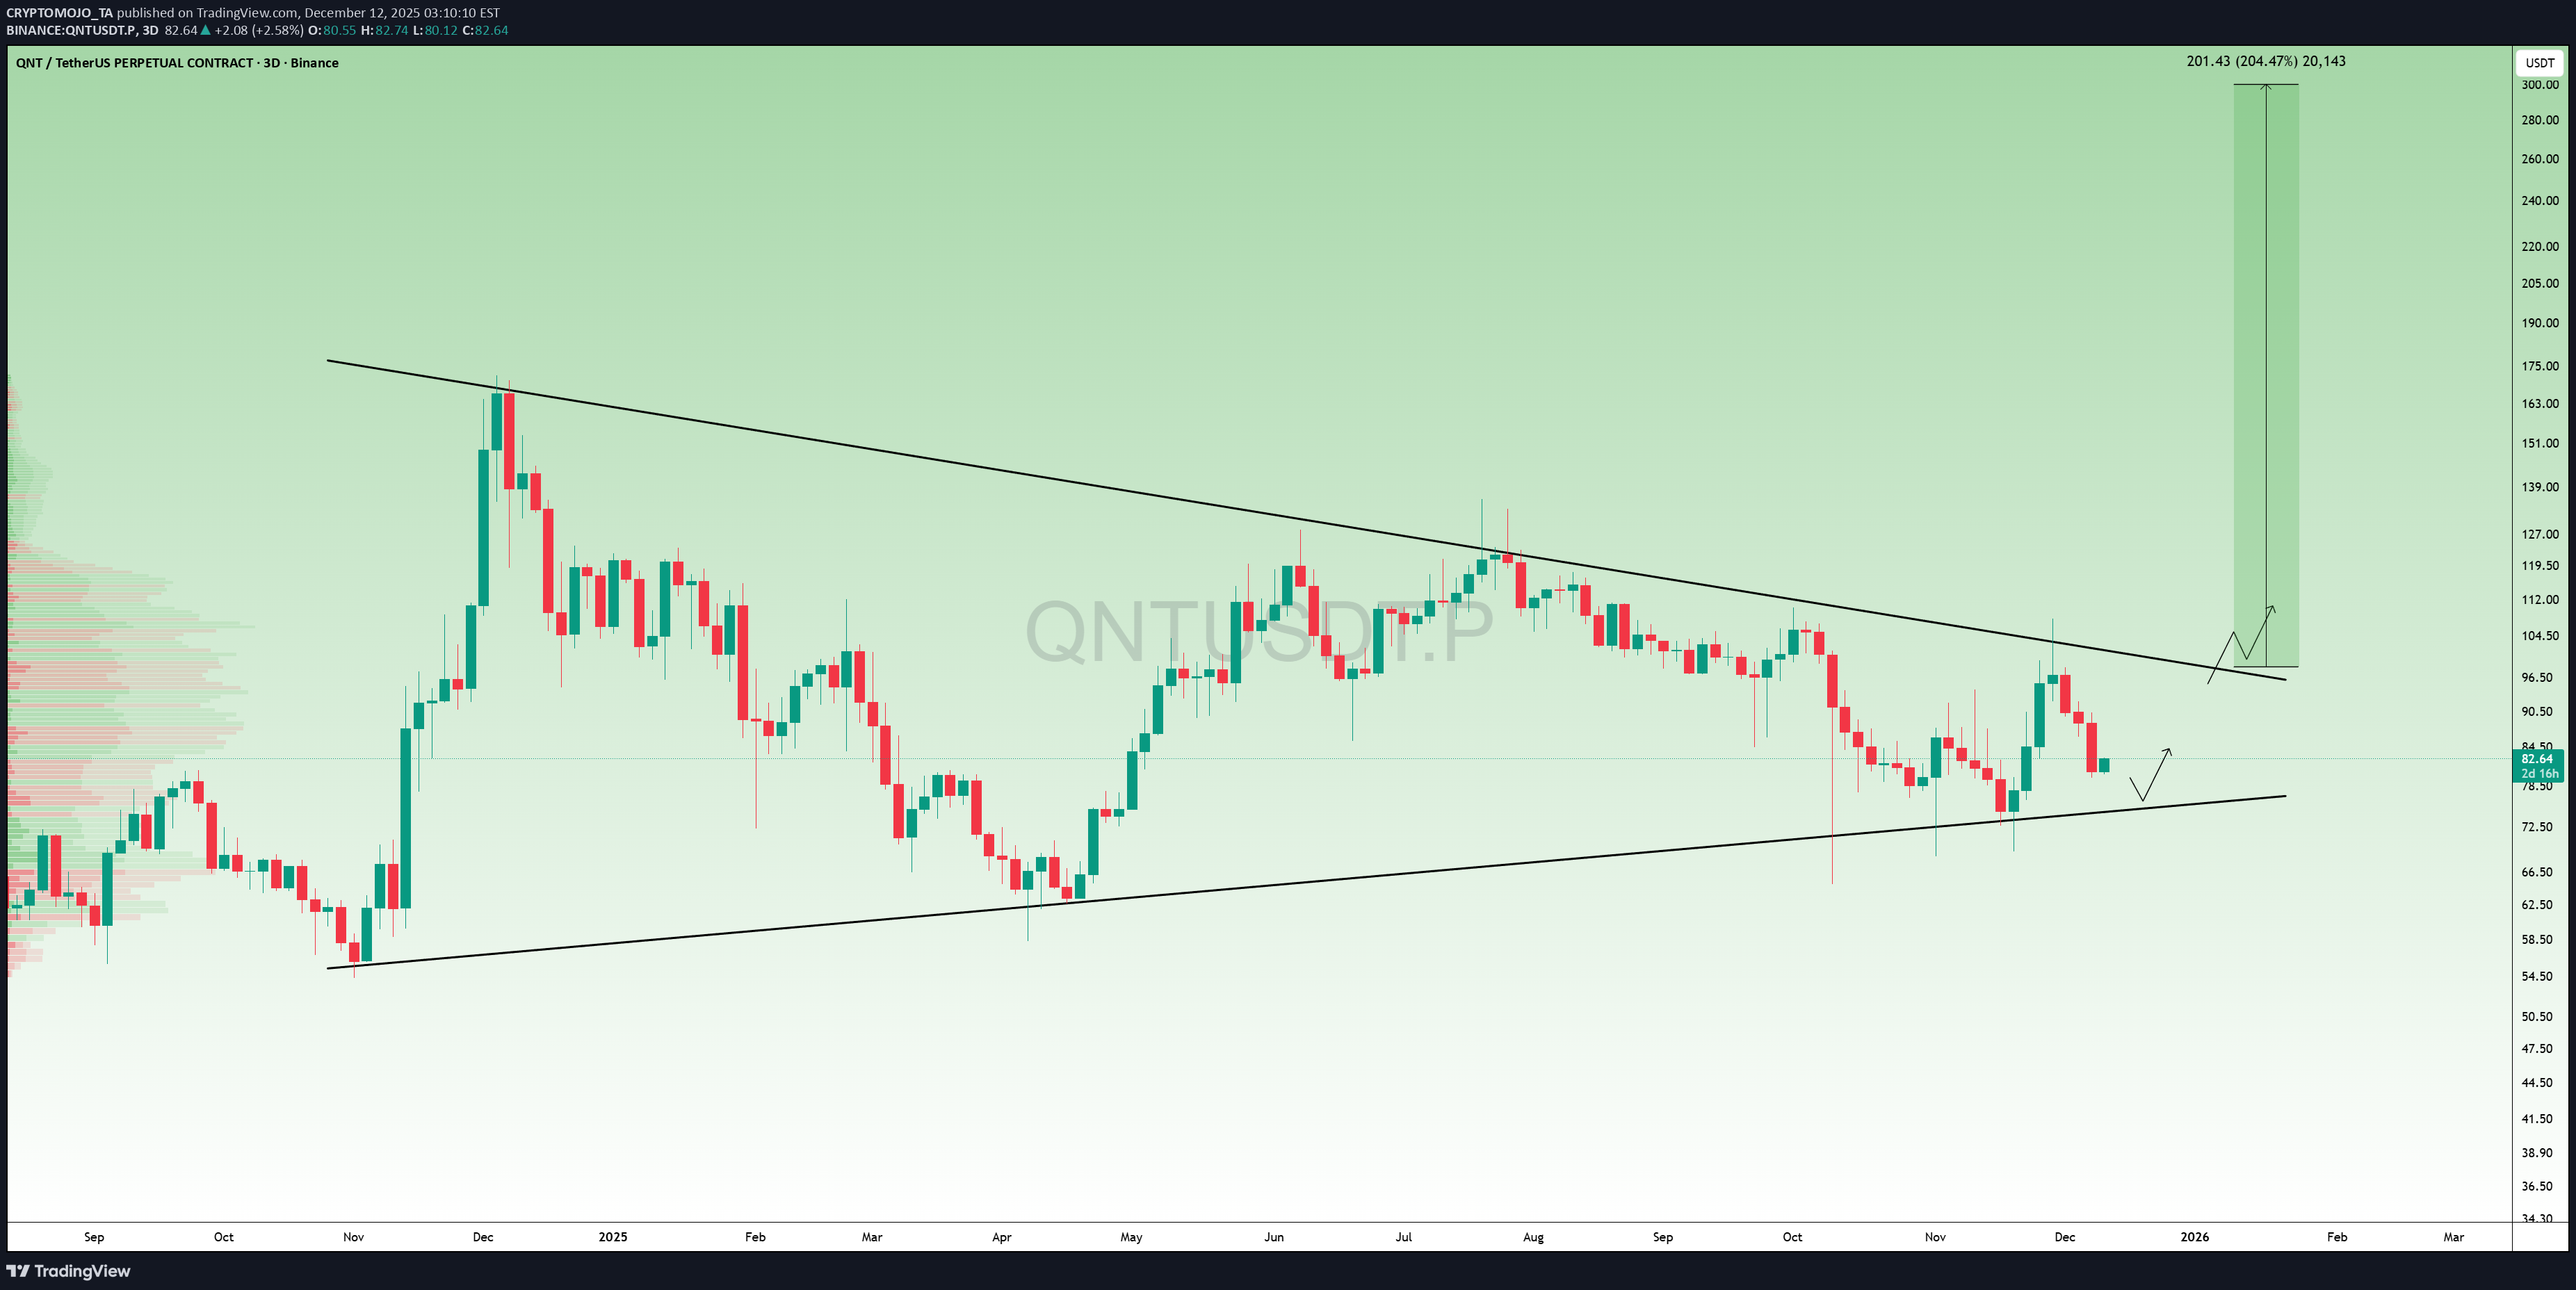
QNT is quietly forming one of the cleanest macro patterns in the market. Price has been squeezing inside this huge falling wedge for over a YEAR… And every time QNT touched the bottom trendline, it bounced hard. Now we’re getting close to the breakout zone. A breakout from here points to a 200% move toward the $250–$300 range. Not financial advice just respecting the chart. This one might surprise a LOT of people.
CRYPTOMOJO_TA
LINK at Critical Bounce Point, Historically Where Rallies Begin
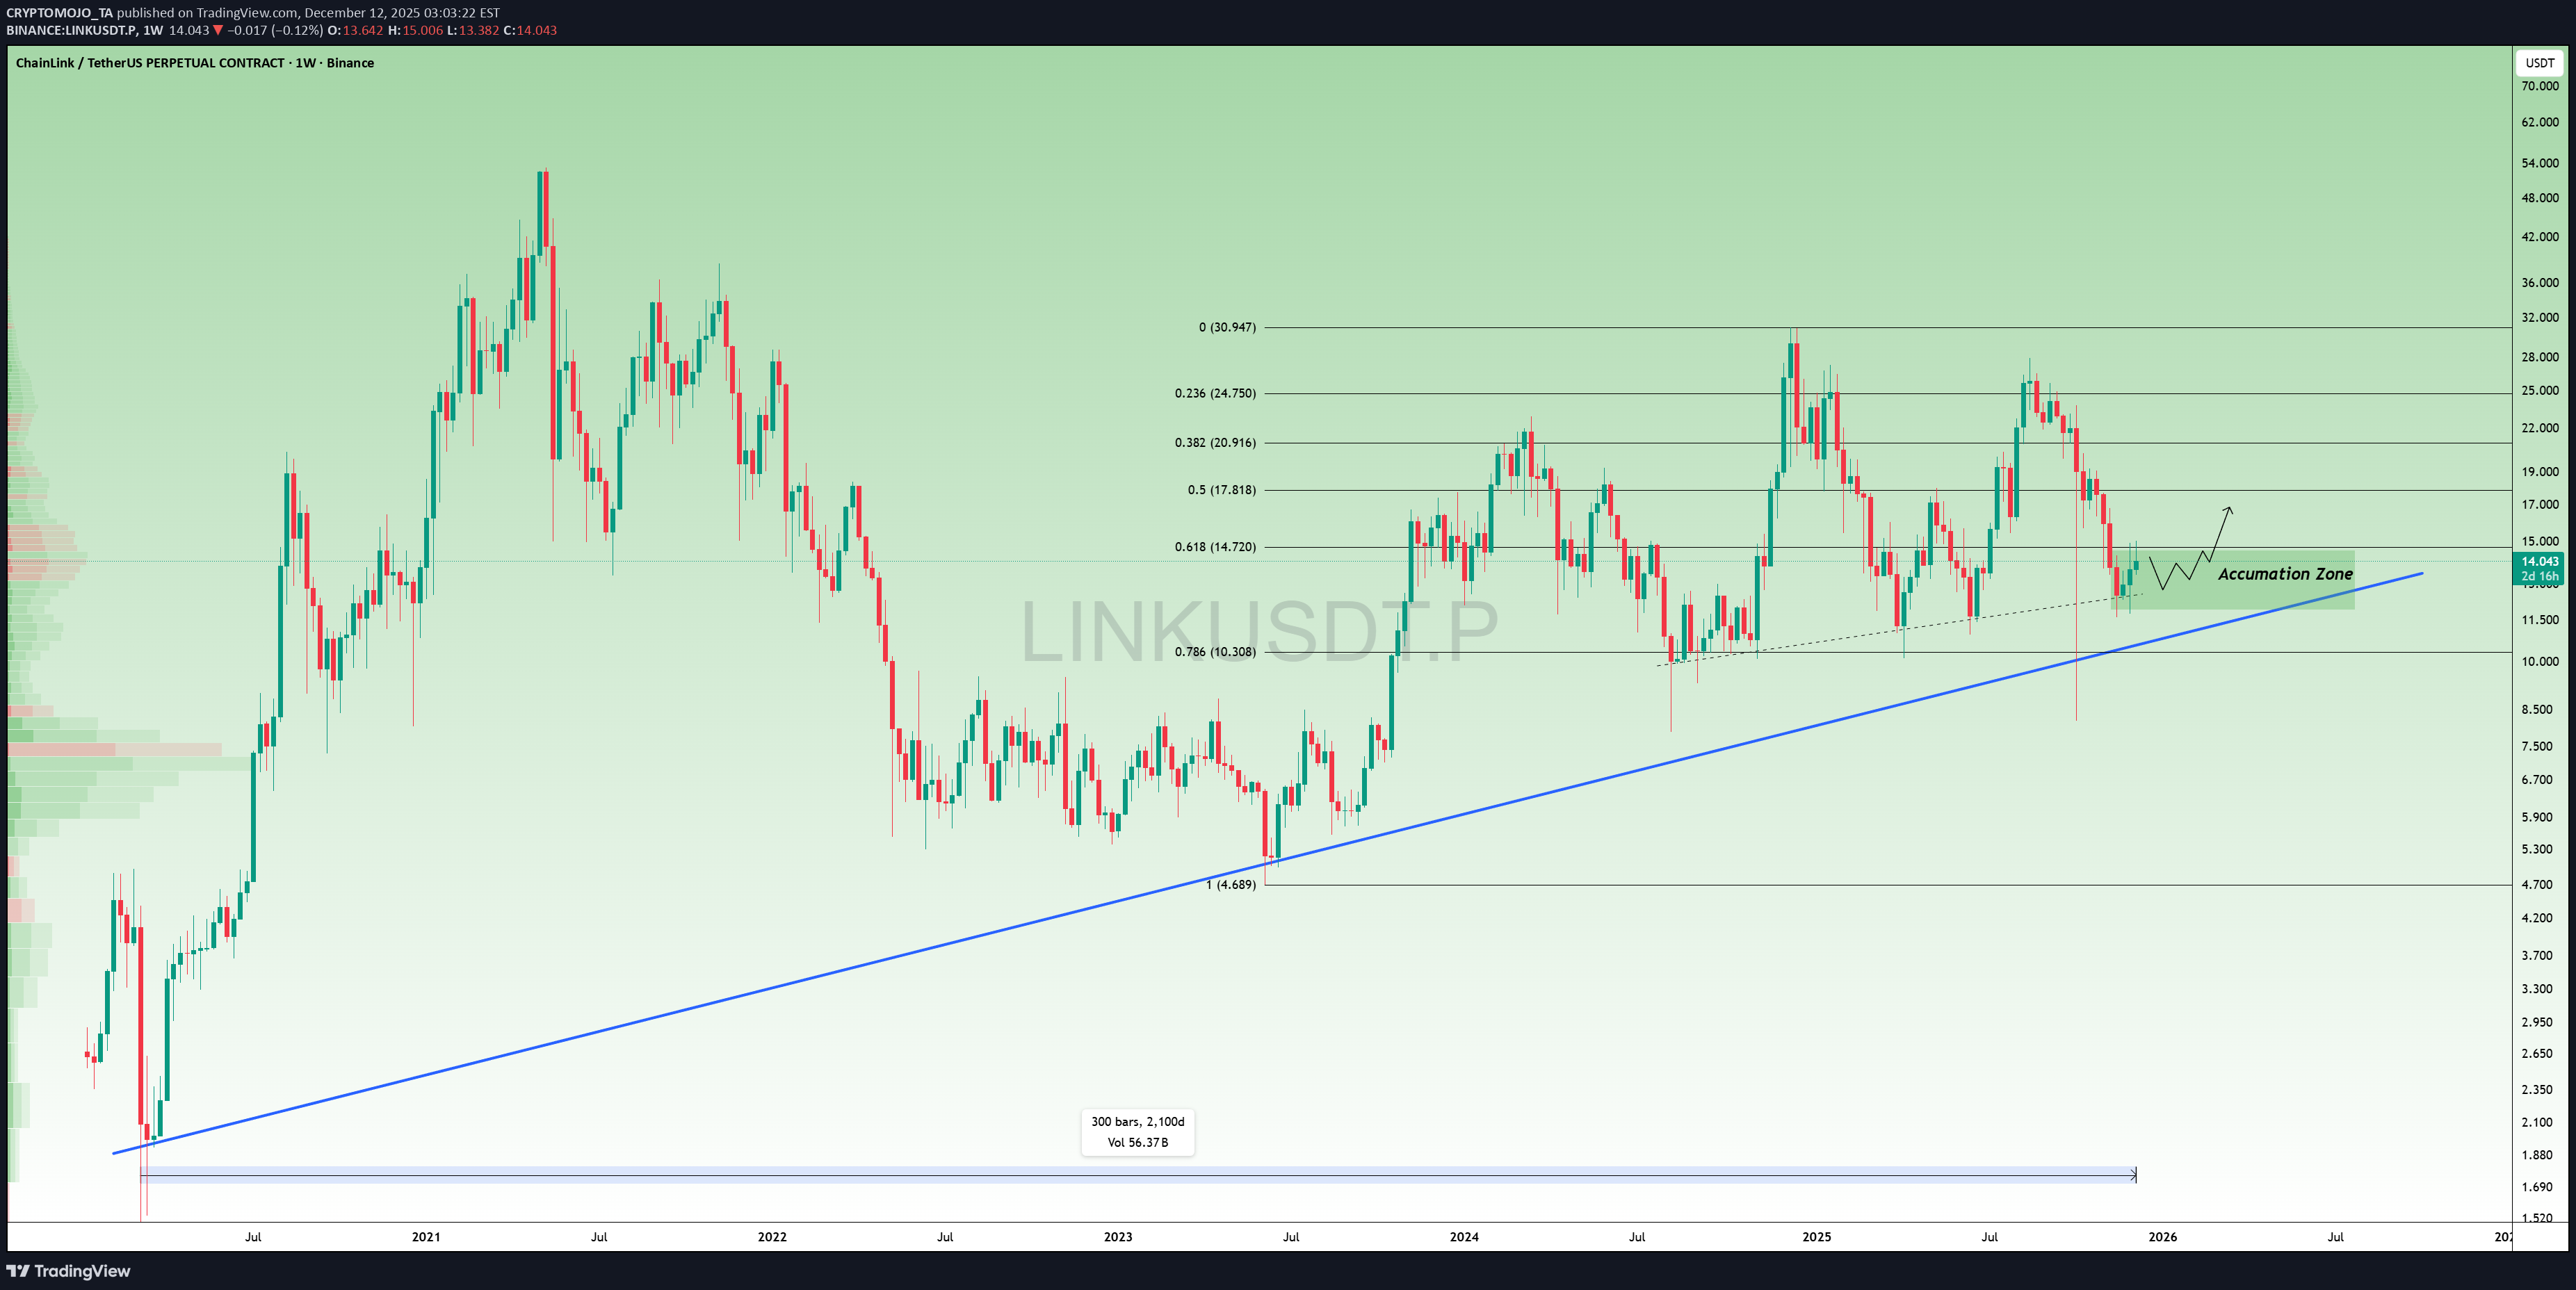
LINK is back inside one of the strongest accumulation zones on the chart. This trendline has held for almost 5 years, and every touch has led to a major move up. Price is now sitting right on support and the 0.618/0.786 Fib levels a zone where smart money usually loads. If LINK holds here, a push back toward $17–$21 is on the table. This is the area where big moves often start.
CRYPTOMOJO_TA
CRYPTOMOJO_TA
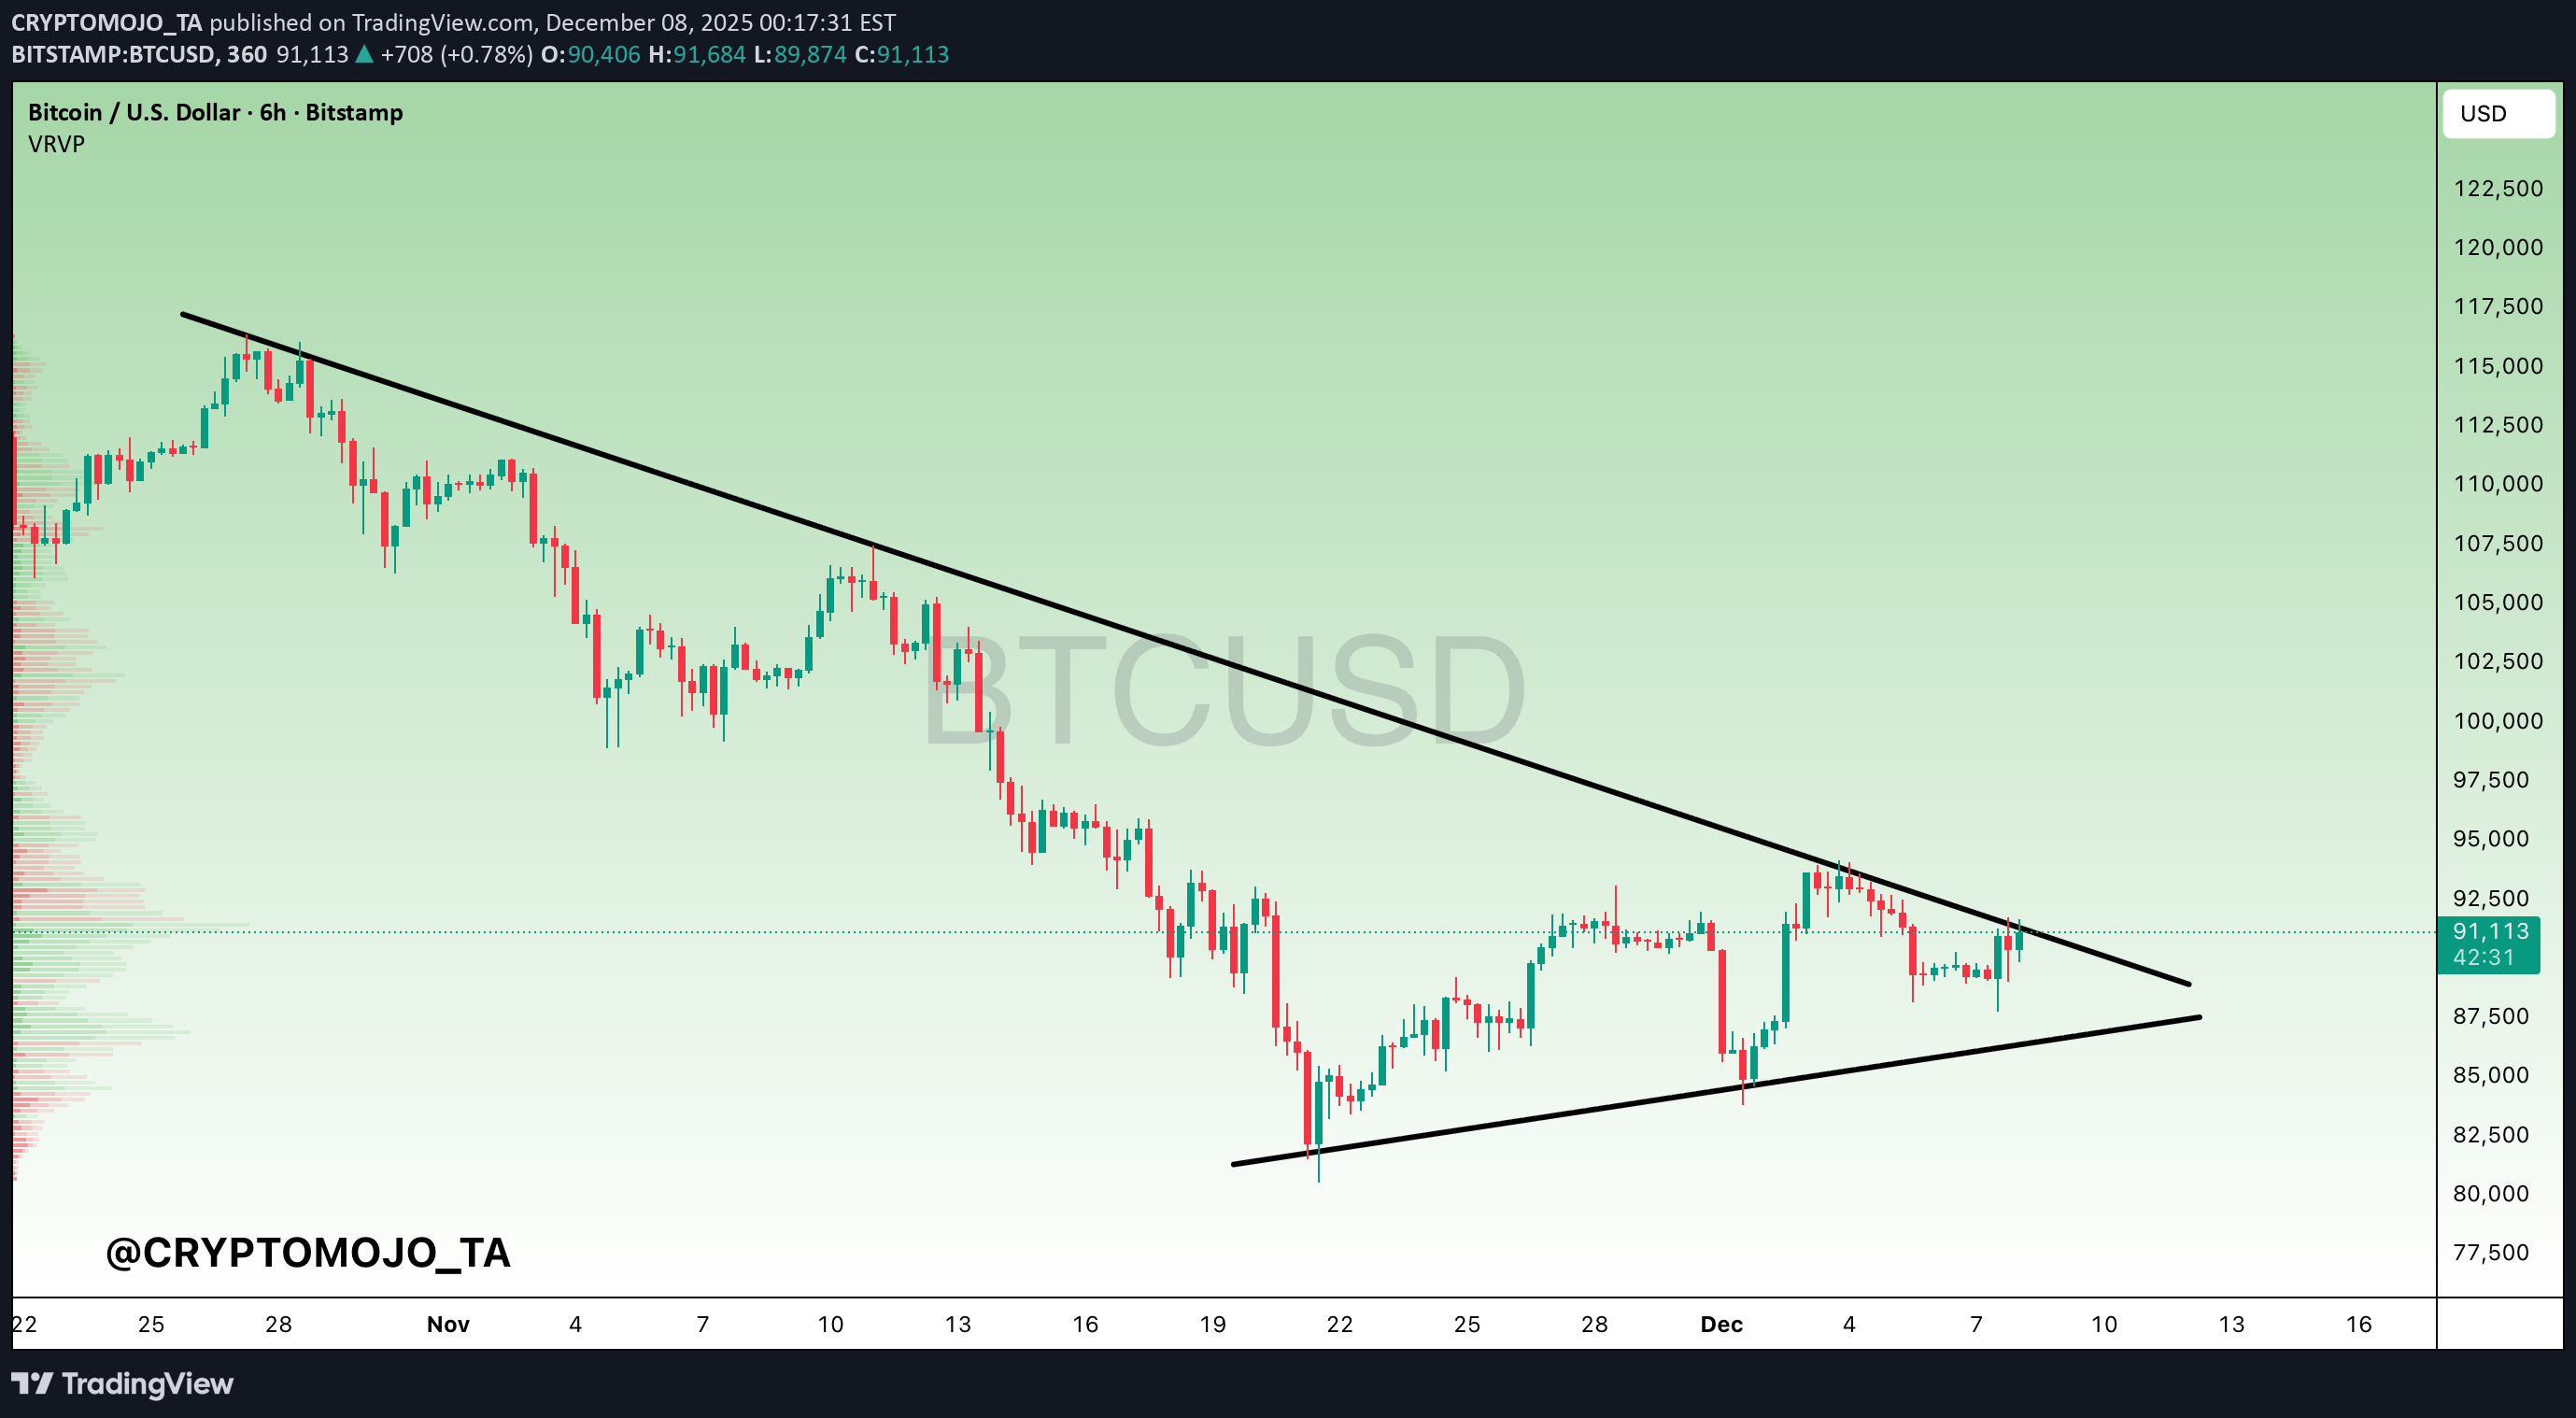
خط قرمز سرنوشتساز بیتکوین (BNB): آیا حمایت تاریخی میشکند یا به قله جدید میرسد؟
CRYPTOMOJO_TA
شکست خط روند بیت کوین: آیا سقوط به ۹۳ هزار یا ۸۵ هزار قطعی است؟
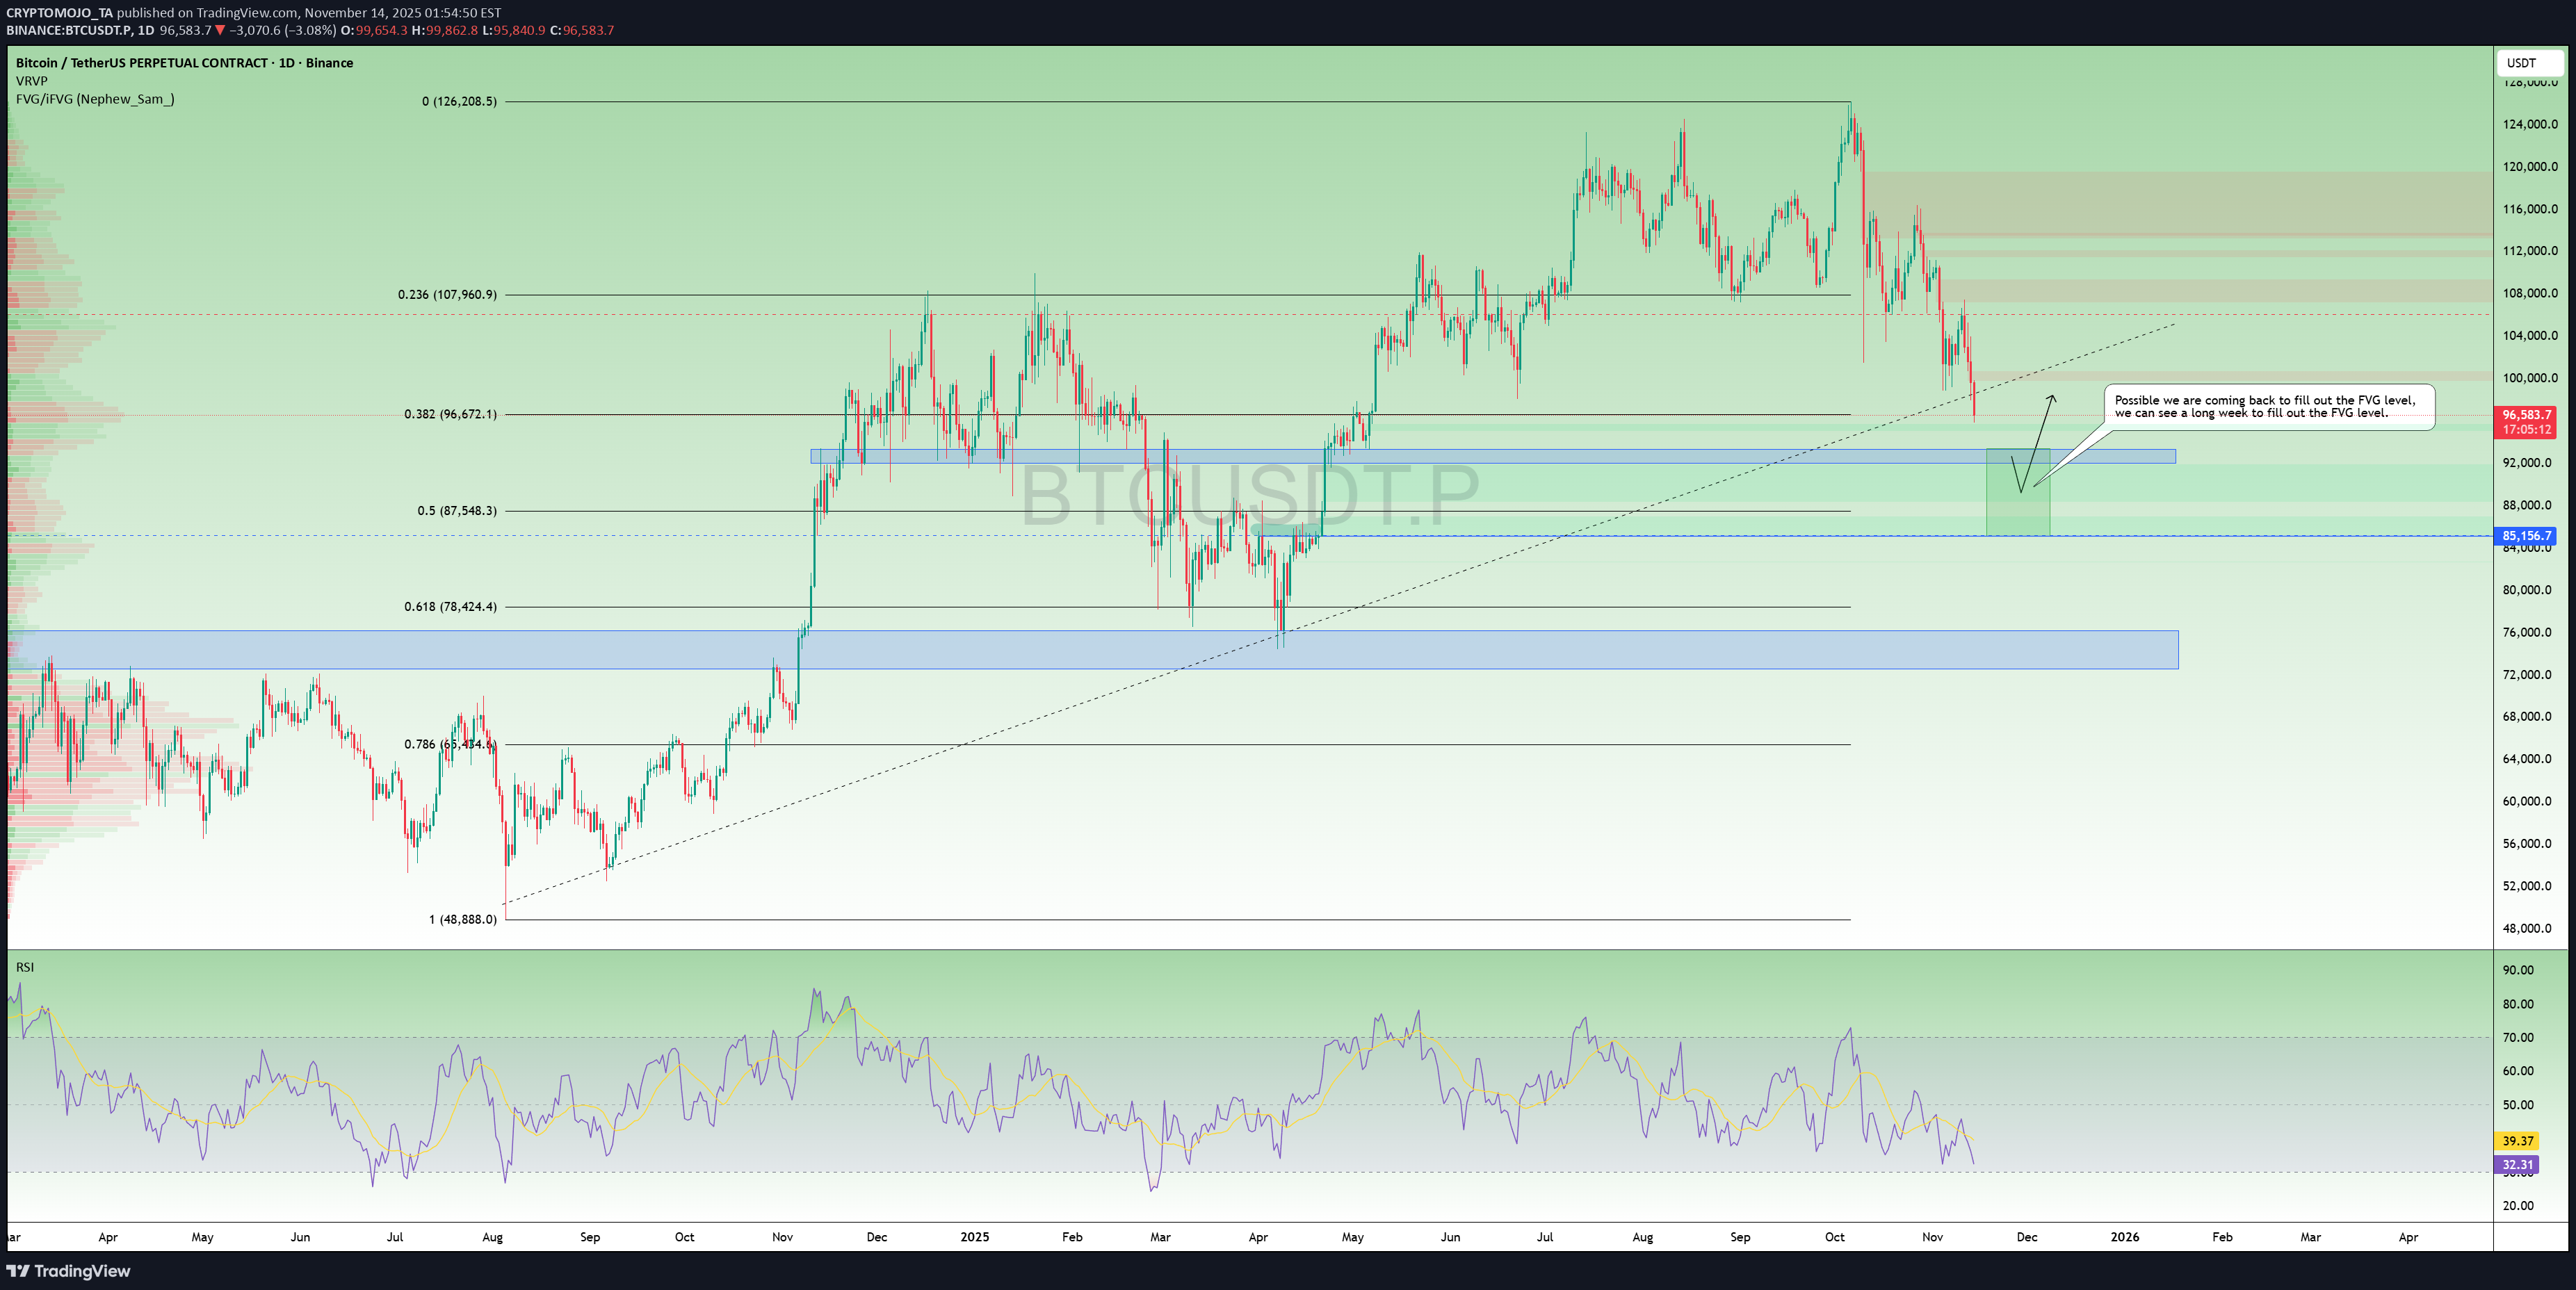
BTC Daily Structure Update – Trendline Lost, Eyes on 92–93K Support! Bitcoin has officially broken below the daily trendline support, confirming a shift toward further weakness in the current market structure. This breakdown increases the probability of deeper retracement levels being tapped before any meaningful bounce. 🔹 Key Levels to Watch ▪️ 92K–93K Support Zone Price is currently heading toward this first major support area. This zone aligns with previous demand and could offer a short-term reaction. ▪️ 0.5 Fibonacci Level (≈87.5K) If 92K–93K fails to hold, the next magnet is the 0.5 FIB retracement zone. Historically, BTC respects the 0.5 retracement during mid-cycle corrections, so this area is significant. ▪️ Fair Value Gap (FVG) – Targeting 85K There’s a visible FVG left below, and structure now suggests a possible return to fill it. A long wick into 85K is absolutely on the table if momentum continues downward. Comment your views and follow for more updates.
Disclaimer
Any content and materials included in Sahmeto's website and official communication channels are a compilation of personal opinions and analyses and are not binding. They do not constitute any recommendation for buying, selling, entering or exiting the stock market and cryptocurrency market. Also, all news and analyses included in the website and channels are merely republished information from official and unofficial domestic and foreign sources, and it is obvious that users of the said content are responsible for following up and ensuring the authenticity and accuracy of the materials. Therefore, while disclaiming responsibility, it is declared that the responsibility for any decision-making, action, and potential profit and loss in the capital market and cryptocurrency market lies with the trader.