c_views
@t_c_views

What symbols does the trader recommend buying?
Purchase History
پیام های تریدر
Filter
c_views
c_views
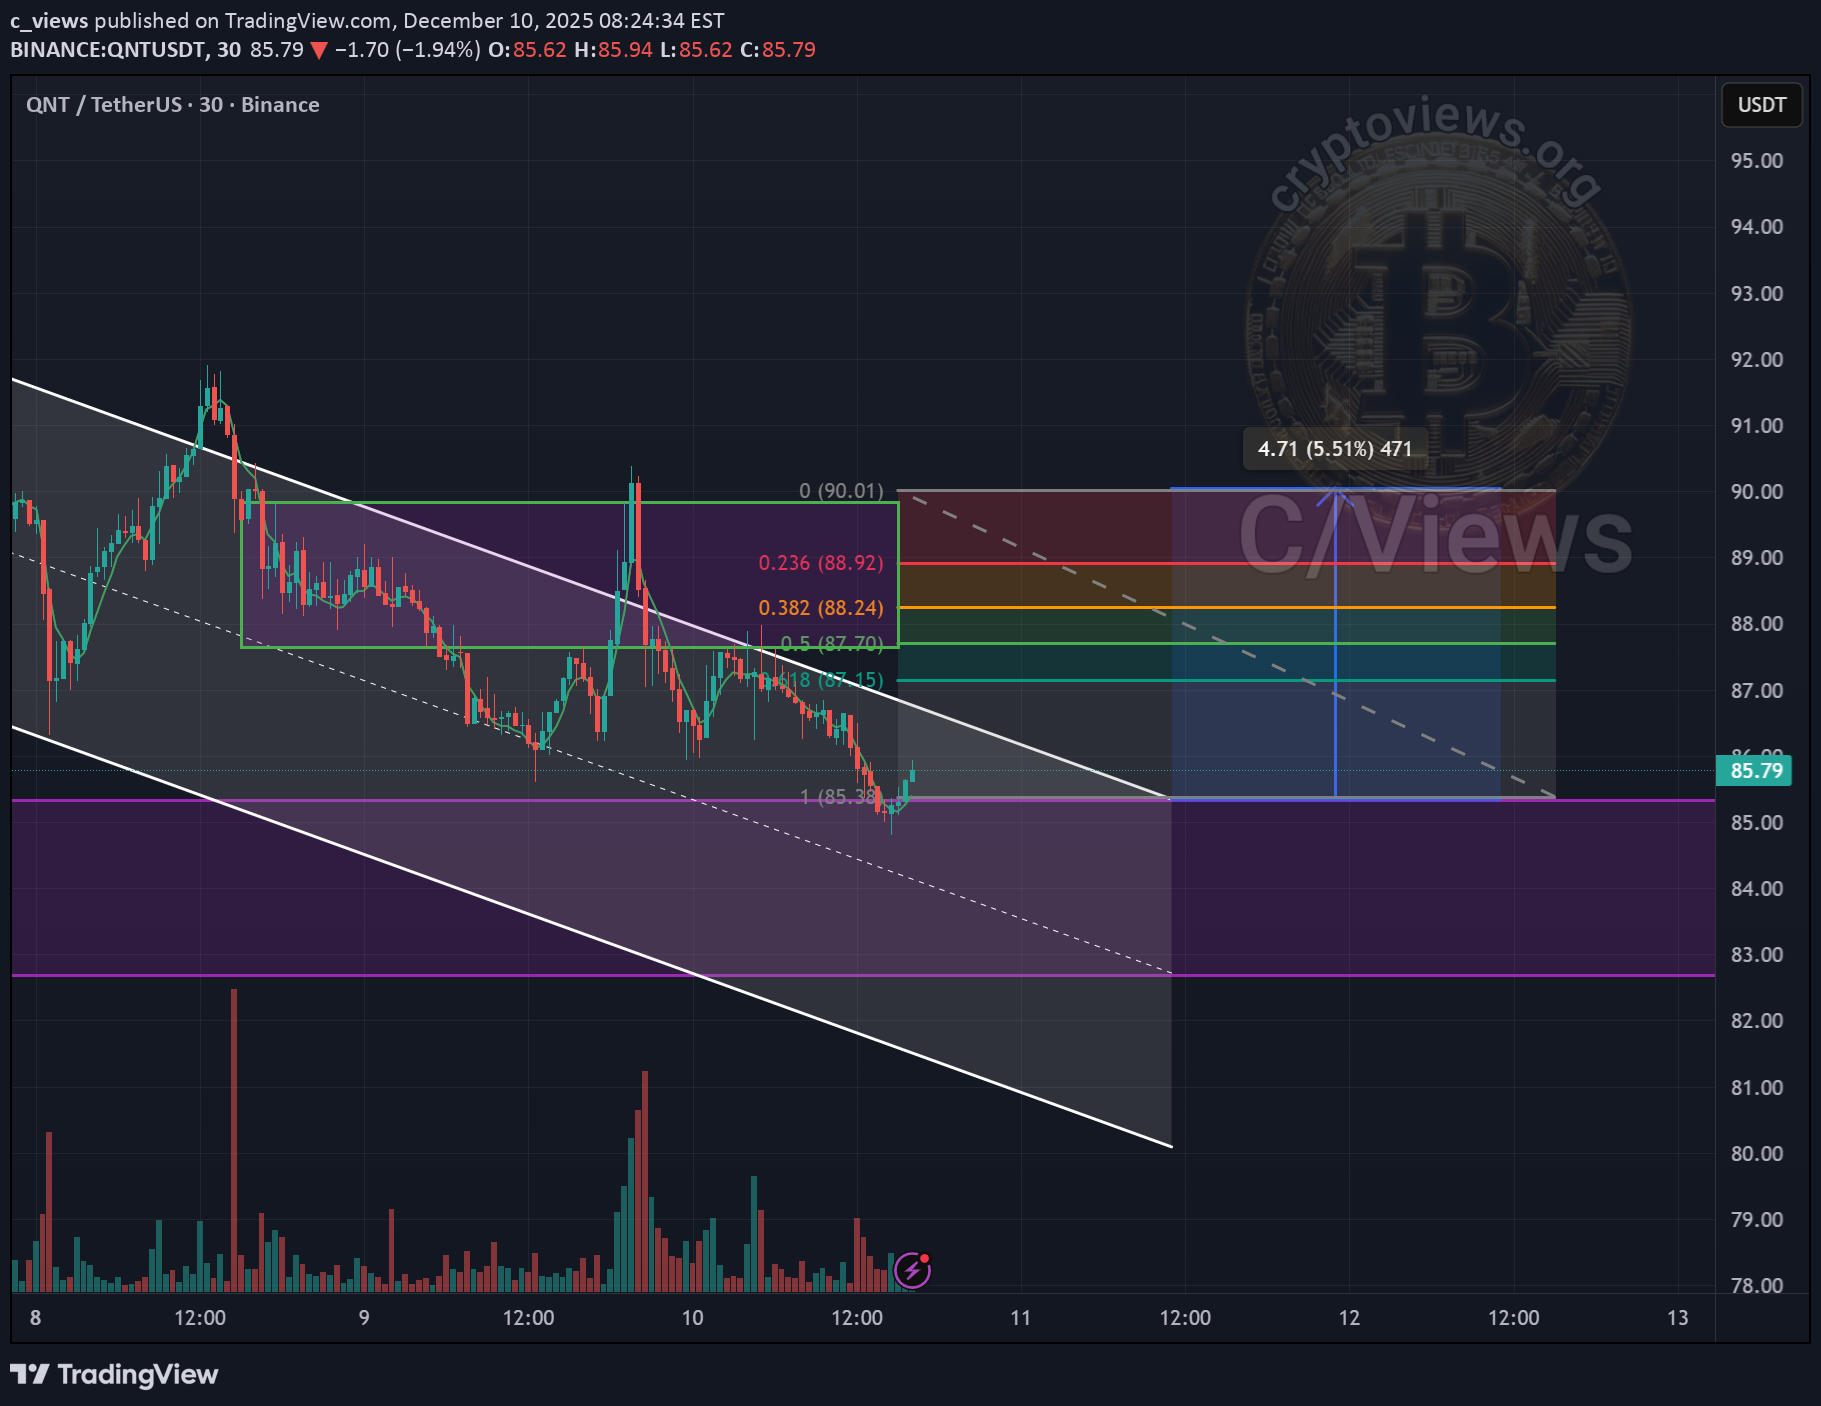
SOL bullish flag
SOL has formed a bullish flag, the movement is still within the pattern Liquidity has formed at the upper level, which the price is more likely to reach At the bottom of the pattern, an upward movement is observed, as each subsequent bottom is higher than the previous one Full breakdown with levels and graphs on the website
c_views
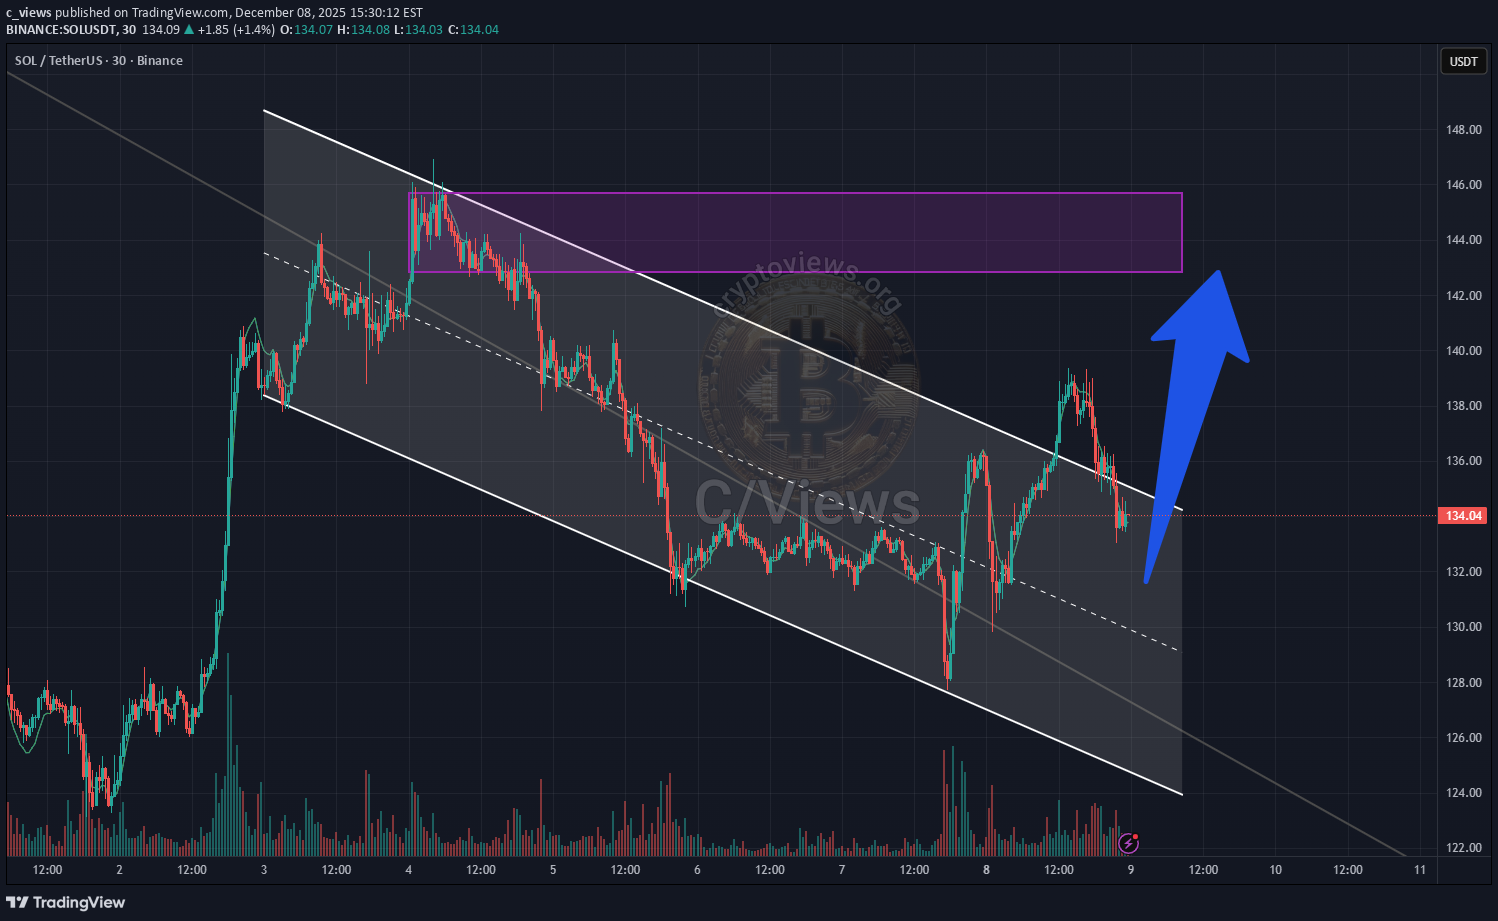
XRP Review With Focus on Trend Shifts
XRP is completing the previously formed bearish butterfly pattern on the global timeframe. At the same time, a large bullish flag is visible in the chart structure, within which the price continues to move. The lower liquidity zone has already been fully engulfed, while the upper liquidity zone remains intact, making it potentially attractive for a subsequent test. Also, each new correction forms a higher bottom, indicating a possible global trend recovery. If the lower boundary of this liquidity zone is broken, the structure could shift to a deeper downward movement. Full breakdown with levels and graphs on the website
c_views
ساختار بازار بیت کوین کش (BCH): الگو "W" و پرچم صعودی؛ آیا اصلاح در راه است؟
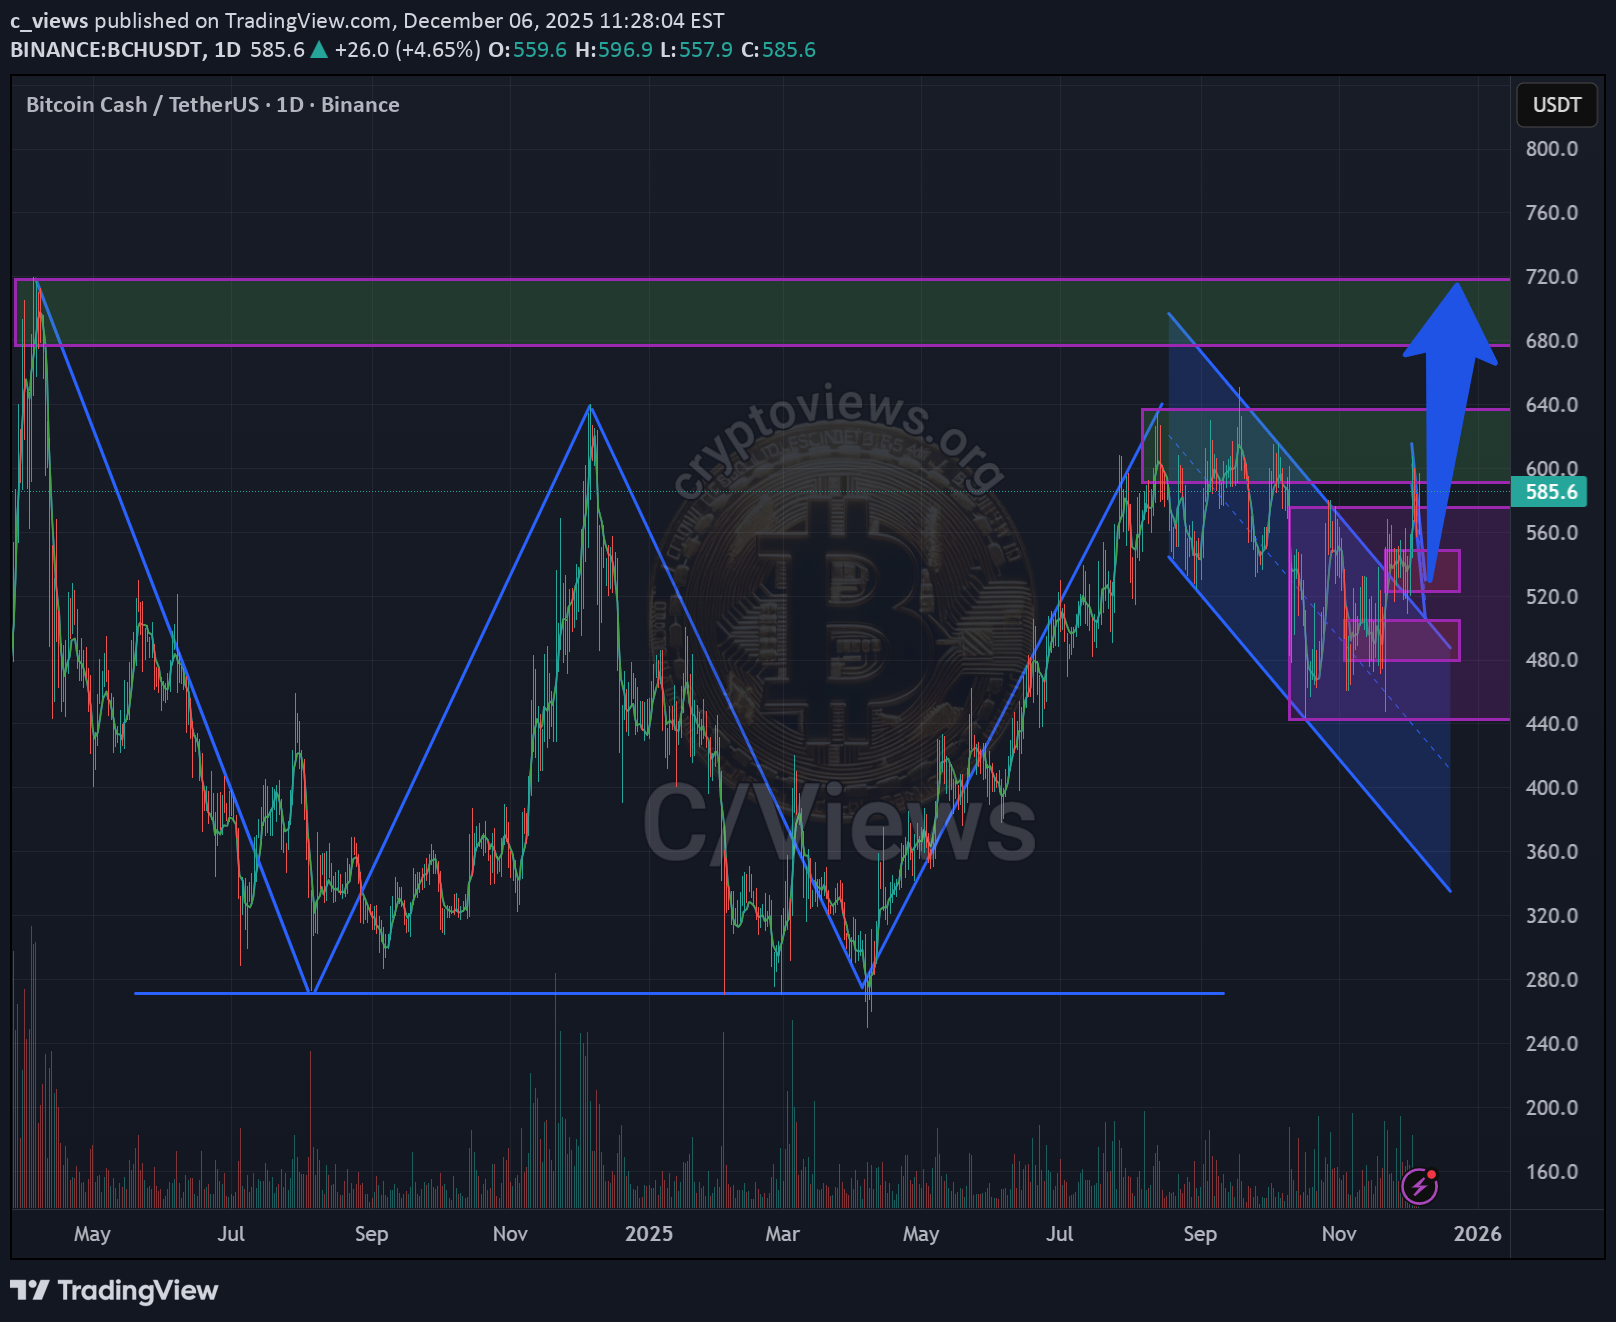
A W-pattern has formed on BCH, but the current breakout is accompanied by a bullish flag with a long flagpole. Key liquidity zones remain below the price, so a pullback and a possible false breakout before the rally are likely. The prolonged accumulation since October 2025 increases the upside potential. If there is no reaction in the coming days, a retest of the 0.5 level of the sideways trend, coinciding with the boundary of the global flag, is possible, the current breakout could be false. Long-term upside potential remains until the upper liquidity zones. Full breakdown on website
c_views
تحلیل ساختار بازار BNB: آیا قیمت به اوج تاریخی میرسد یا سقوط میکند؟
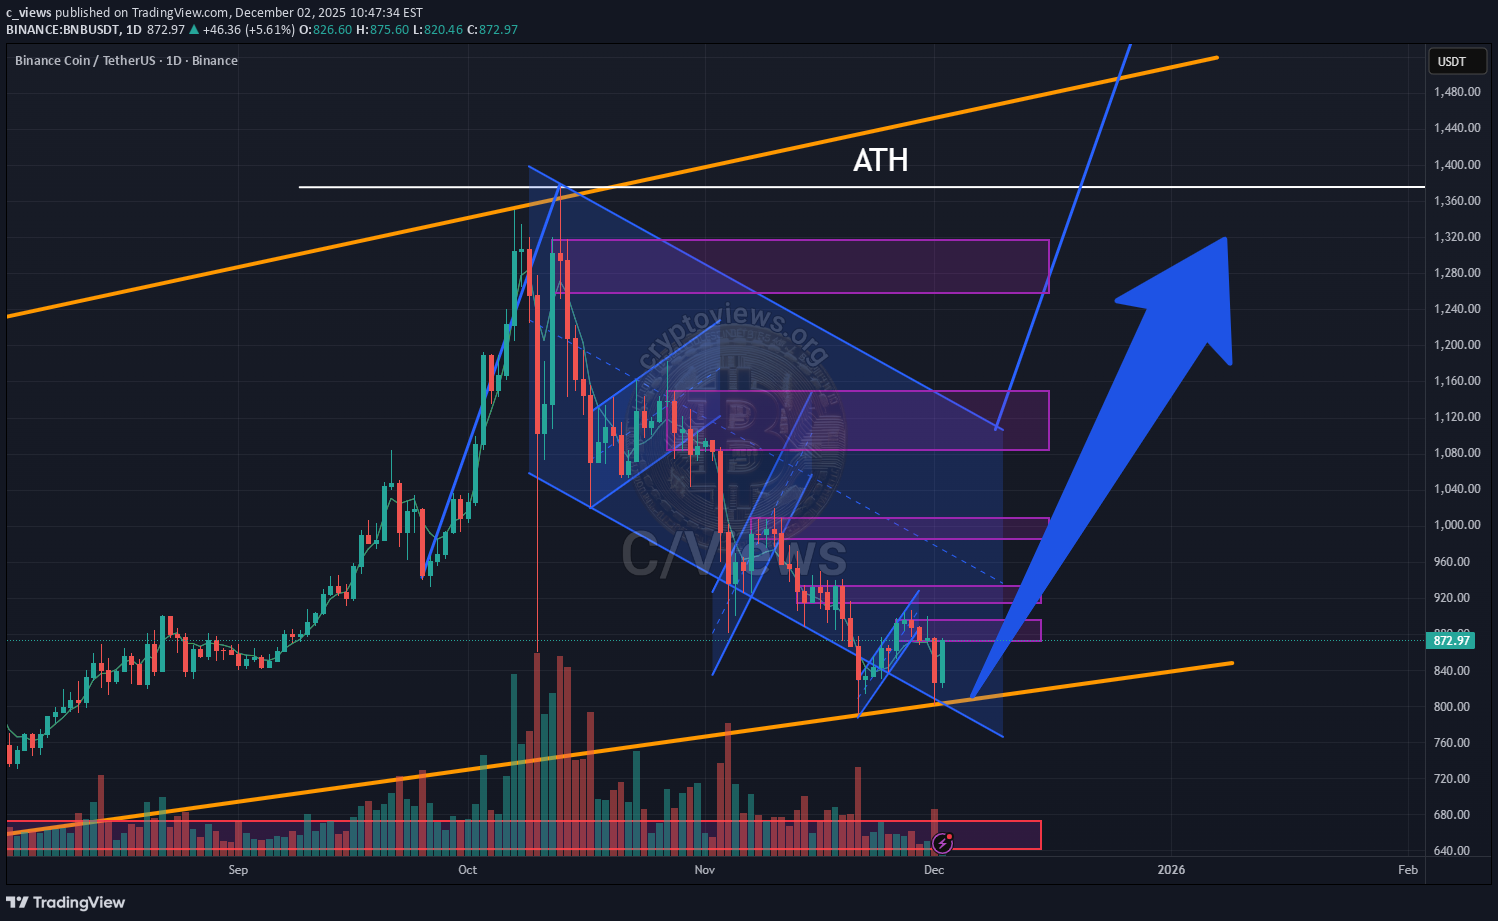
BNB is moving within global patterns, an ascending expanding wedge within which a bullish flag has formed. Five liquidity zones have formed above. Below, two liquidity zones have formed, the first from January 2025 and the second from February 2024. Given the Fed's rate tightening plan, the movement is more likely to be upward. Globally, it could reach the previous ATH or even the upper boundary of the wedge. Also, on the longs and shorts map, it appears that longs are currently in excess. The liquidity map shows that the enormous liquidity is forming at the top, not the bottom. According to the media, the indicator is positive, in response to CZ's comment regarding the Fed. Also, given that BTC is being prevented from breaking the lower boundary of the pattern we discussed in our previous review, BNB's movement against BTC is more likely to be upward along the designated liquidity zones. If the lower boundary of the pattern is broken, and the candlestick forms deeper than the previous candlestick, the movement is more likely to be upward. downward, with a false breakout to the liquidity area highlighted in red
c_views
هفته سرنوشتساز بیت کوین: پرچم گاوی HYPE در آستانه انفجار صعودی!
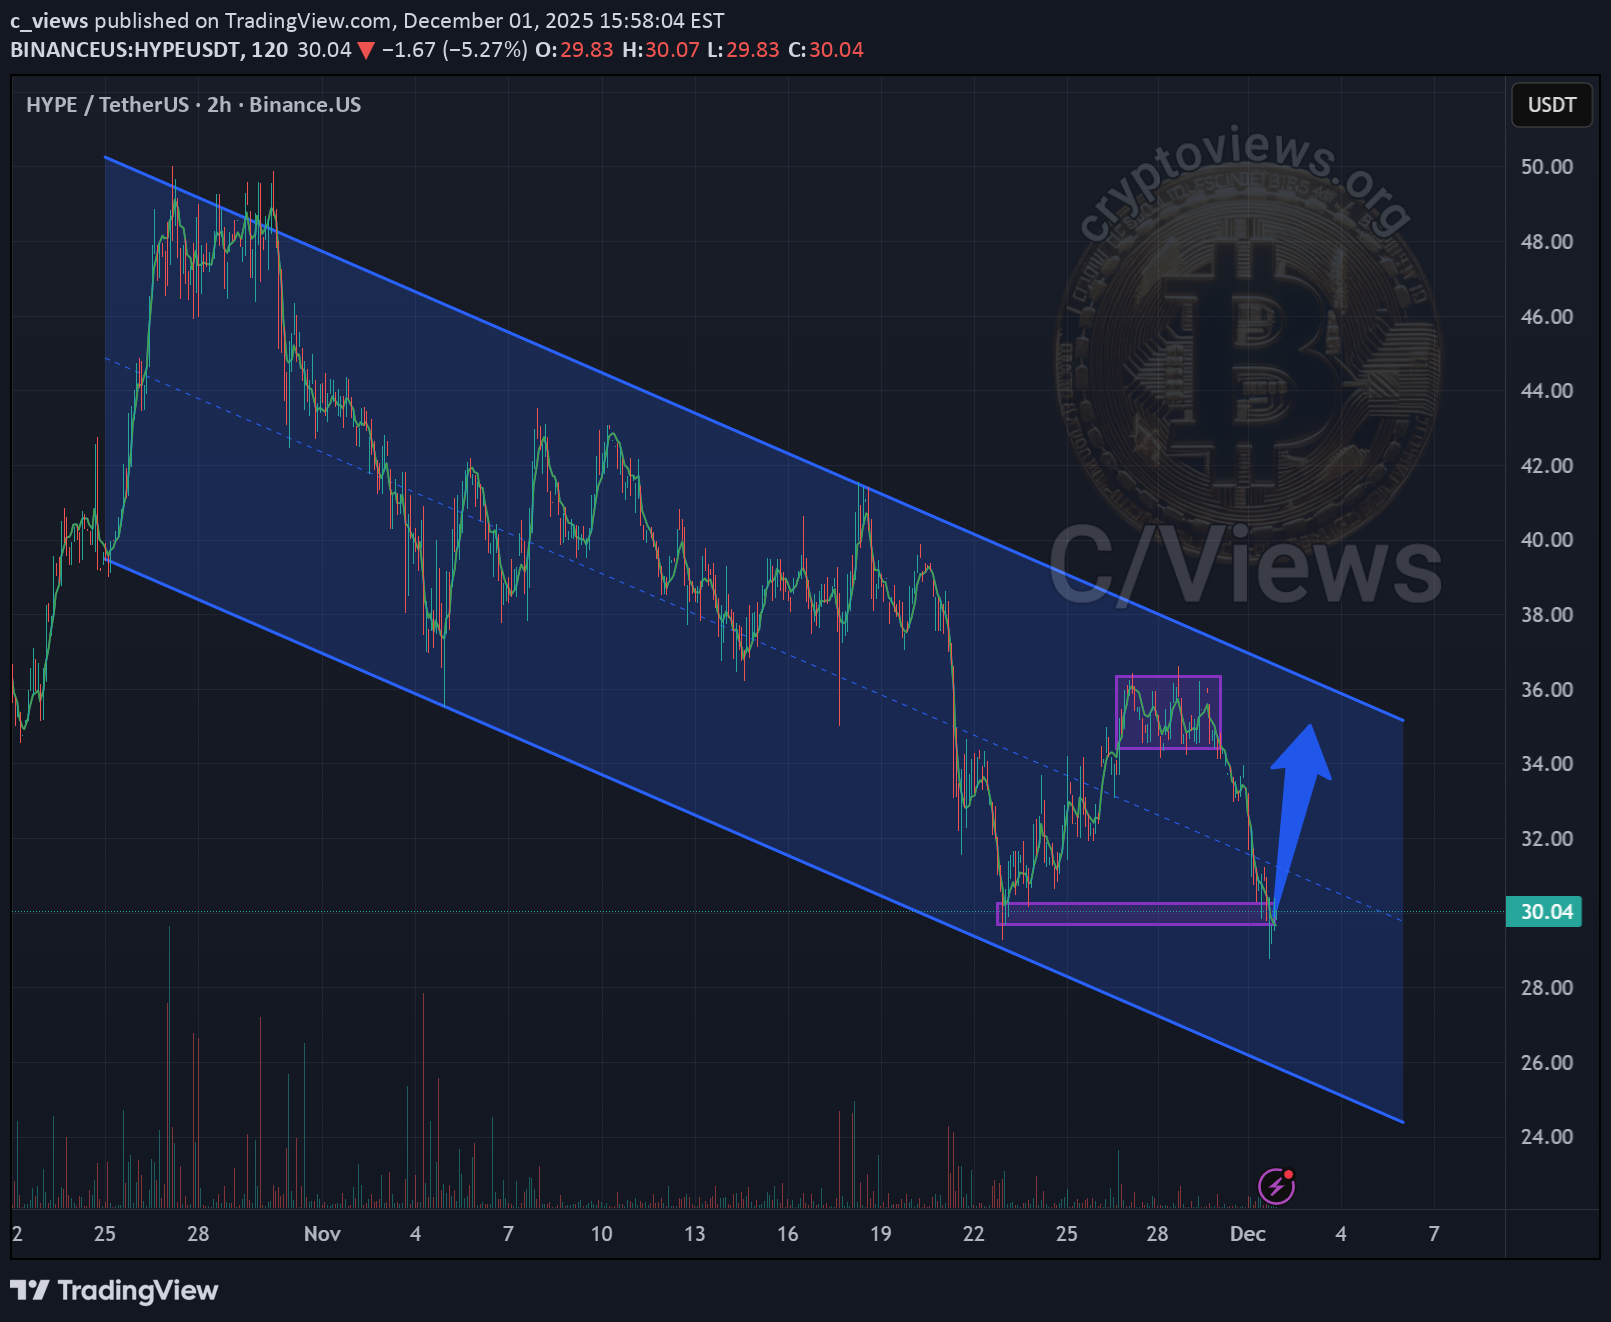
HYPE continues to move within a global bull flag pattern Currently, the price is declining to the liquidation zone (lower purple area) The price is consolidating at this level A liquidity zone has formed above, which is more likely to be taken The movement will likely continue to its upper boundaries Current price: $28.86
c_views
تحلیل تکنیکال تسلا (TSLA): موج پنجم صعودی یا سقوط قریبالوقوع؟
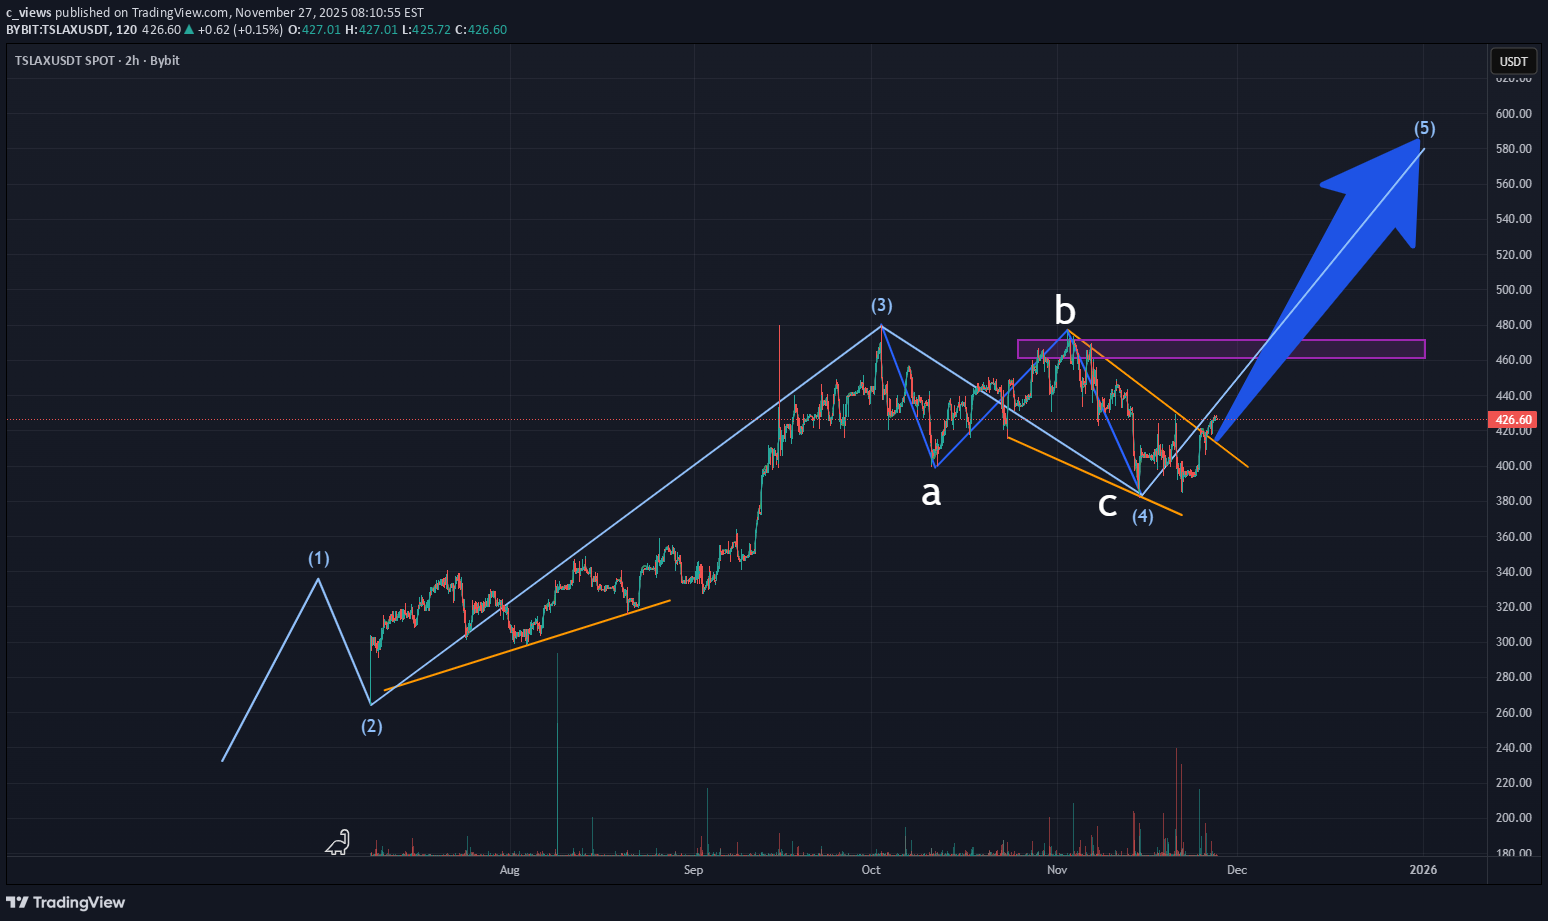
Tesla (TSLAX, TSLA) is forming its 5th full wave of growth according to Elliott Wave Theory. Unfortunately, the chart on TradingView is incomplete; it was created based on other sources and then transferred to TV. ABC corrective waves (marked in blue) were most likely formed. Above, we also see an area of liquidity that is more likely to be taken. According to wave 3, we can predict the length of wave 5 to be around 20%. As is well known, stock movements last somewhat longer than cryptocurrencies, and this should be kept in mind. If the price forms a low lower than the start of wave 4, this wave structure will be considered broken, and the price may move downward. Full breakdown on website
c_views
خیزش بزرگ FET: پرچم گاوی آماده شکستن ناحیه نقدینگی!
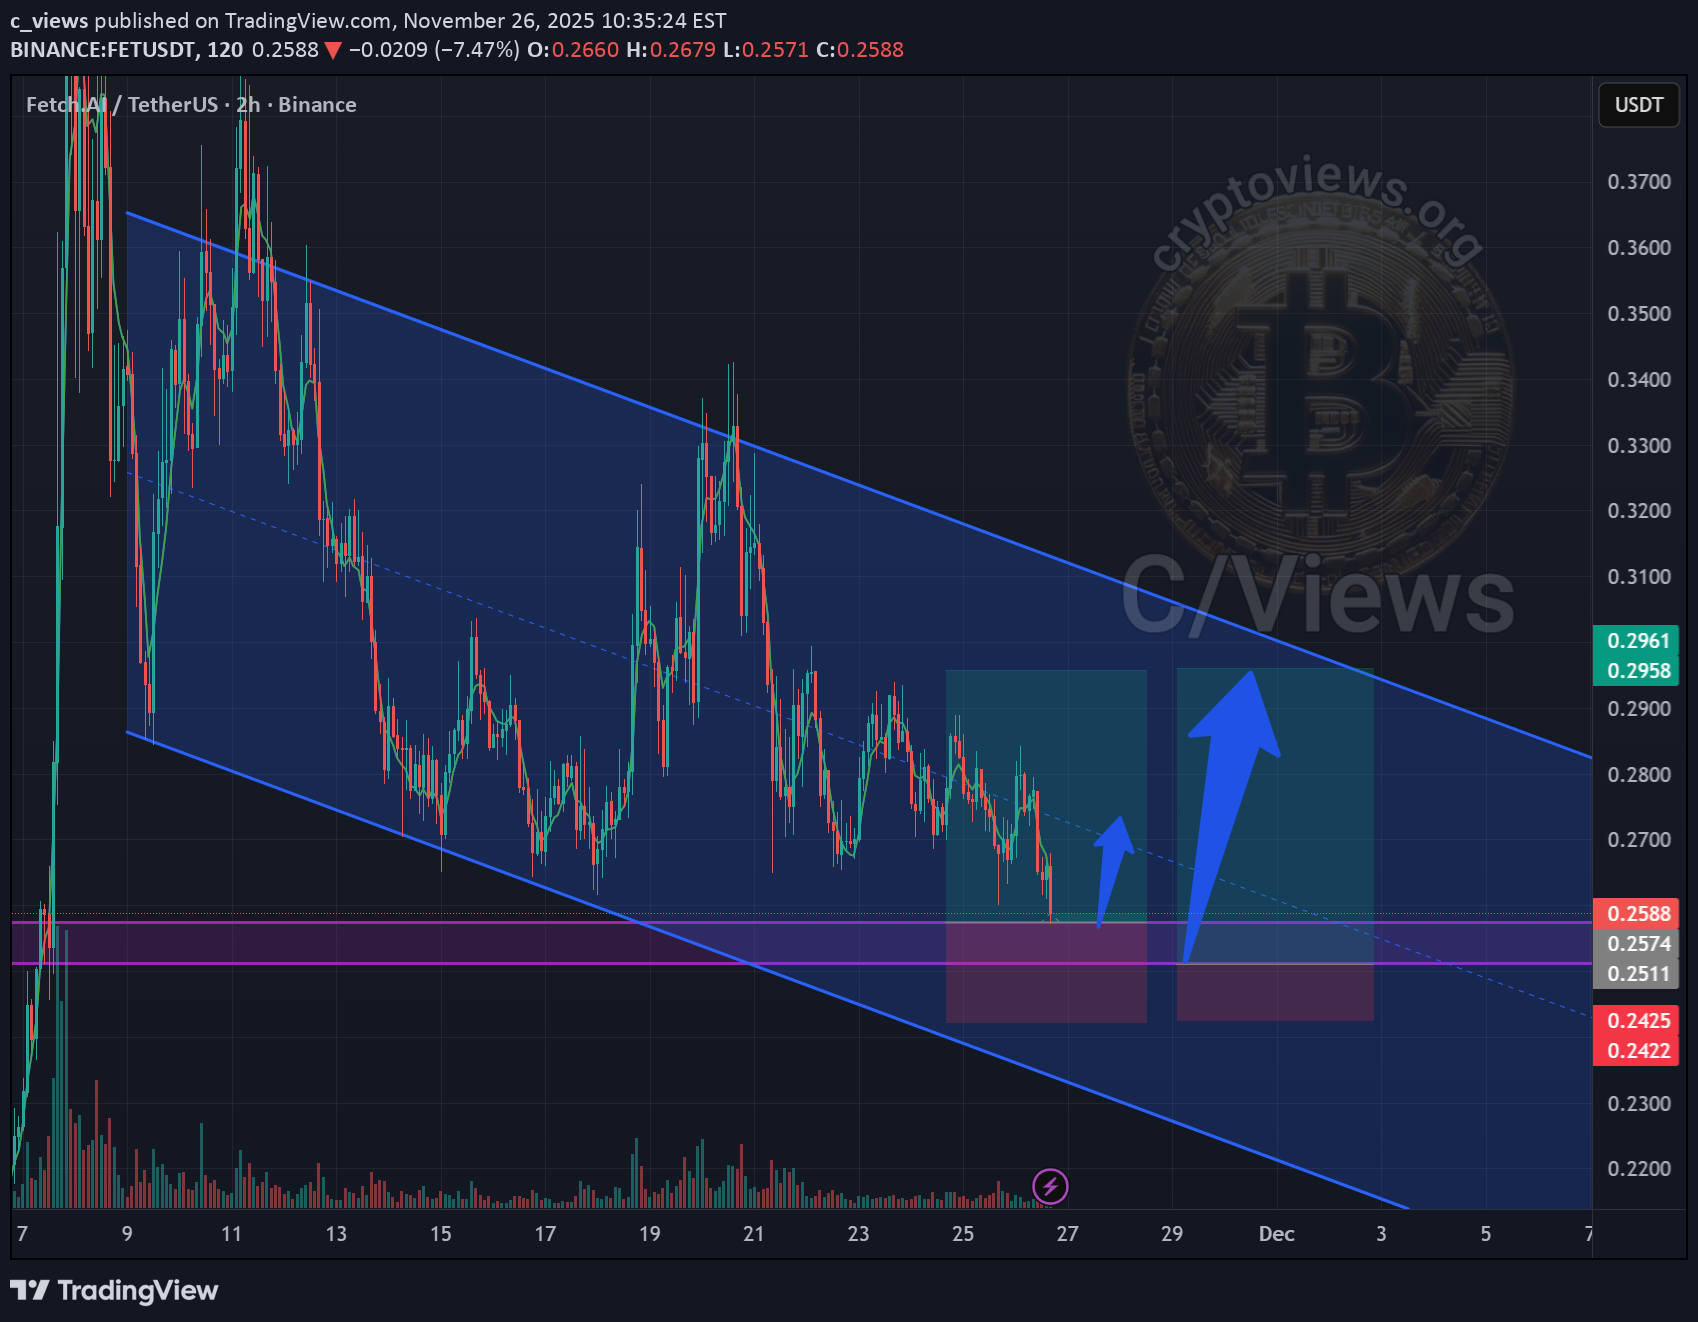
FET - the price has reached the liquidity zone marked in purple, moving within a bullish flag pattern. It is more likely that the movement will continue toward the upper boundary of the pattern. Current price: $0.2608 If the price reaches below the purple area, it is more likely that the price will continue its downward movement without rebounding upward. Full breakdown on website
c_views
الگوی دوقلو در SPX: آیا سقوط نهایی آغاز میشود؟
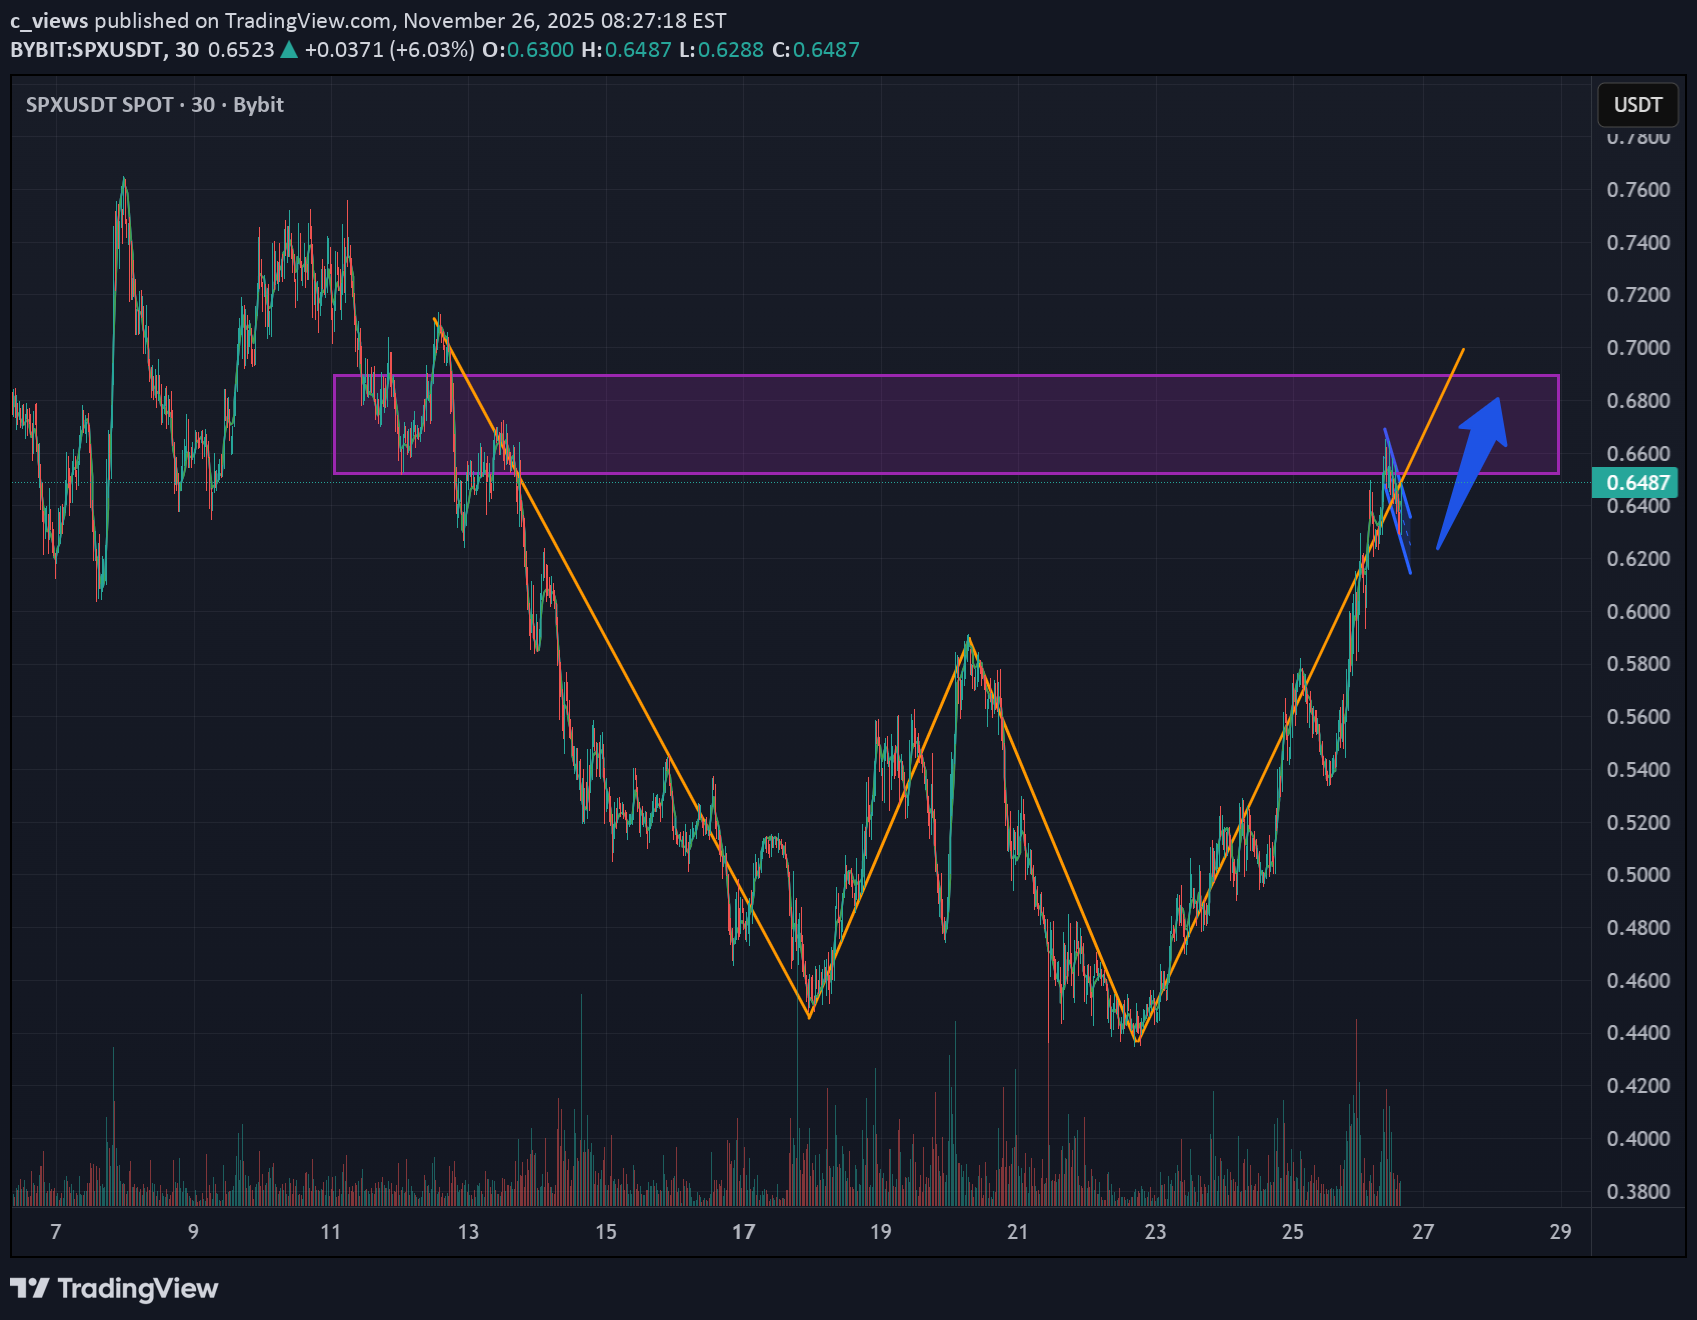
The SPX has formed a global W pattern, or double bottom , and is currently in the final phase of the formation, which is likely to reach the liquidation zone highlighted in purple. Current price: $0.6333 If the price breaks the level where the previous peak bottomed, the ascending structure is more likely to be broken, and the movement may continue downward. Full breakdown on website
c_views
الگوی پرچم صعودی تون (TON): آیا قیمت به زودی رکورد میزند؟
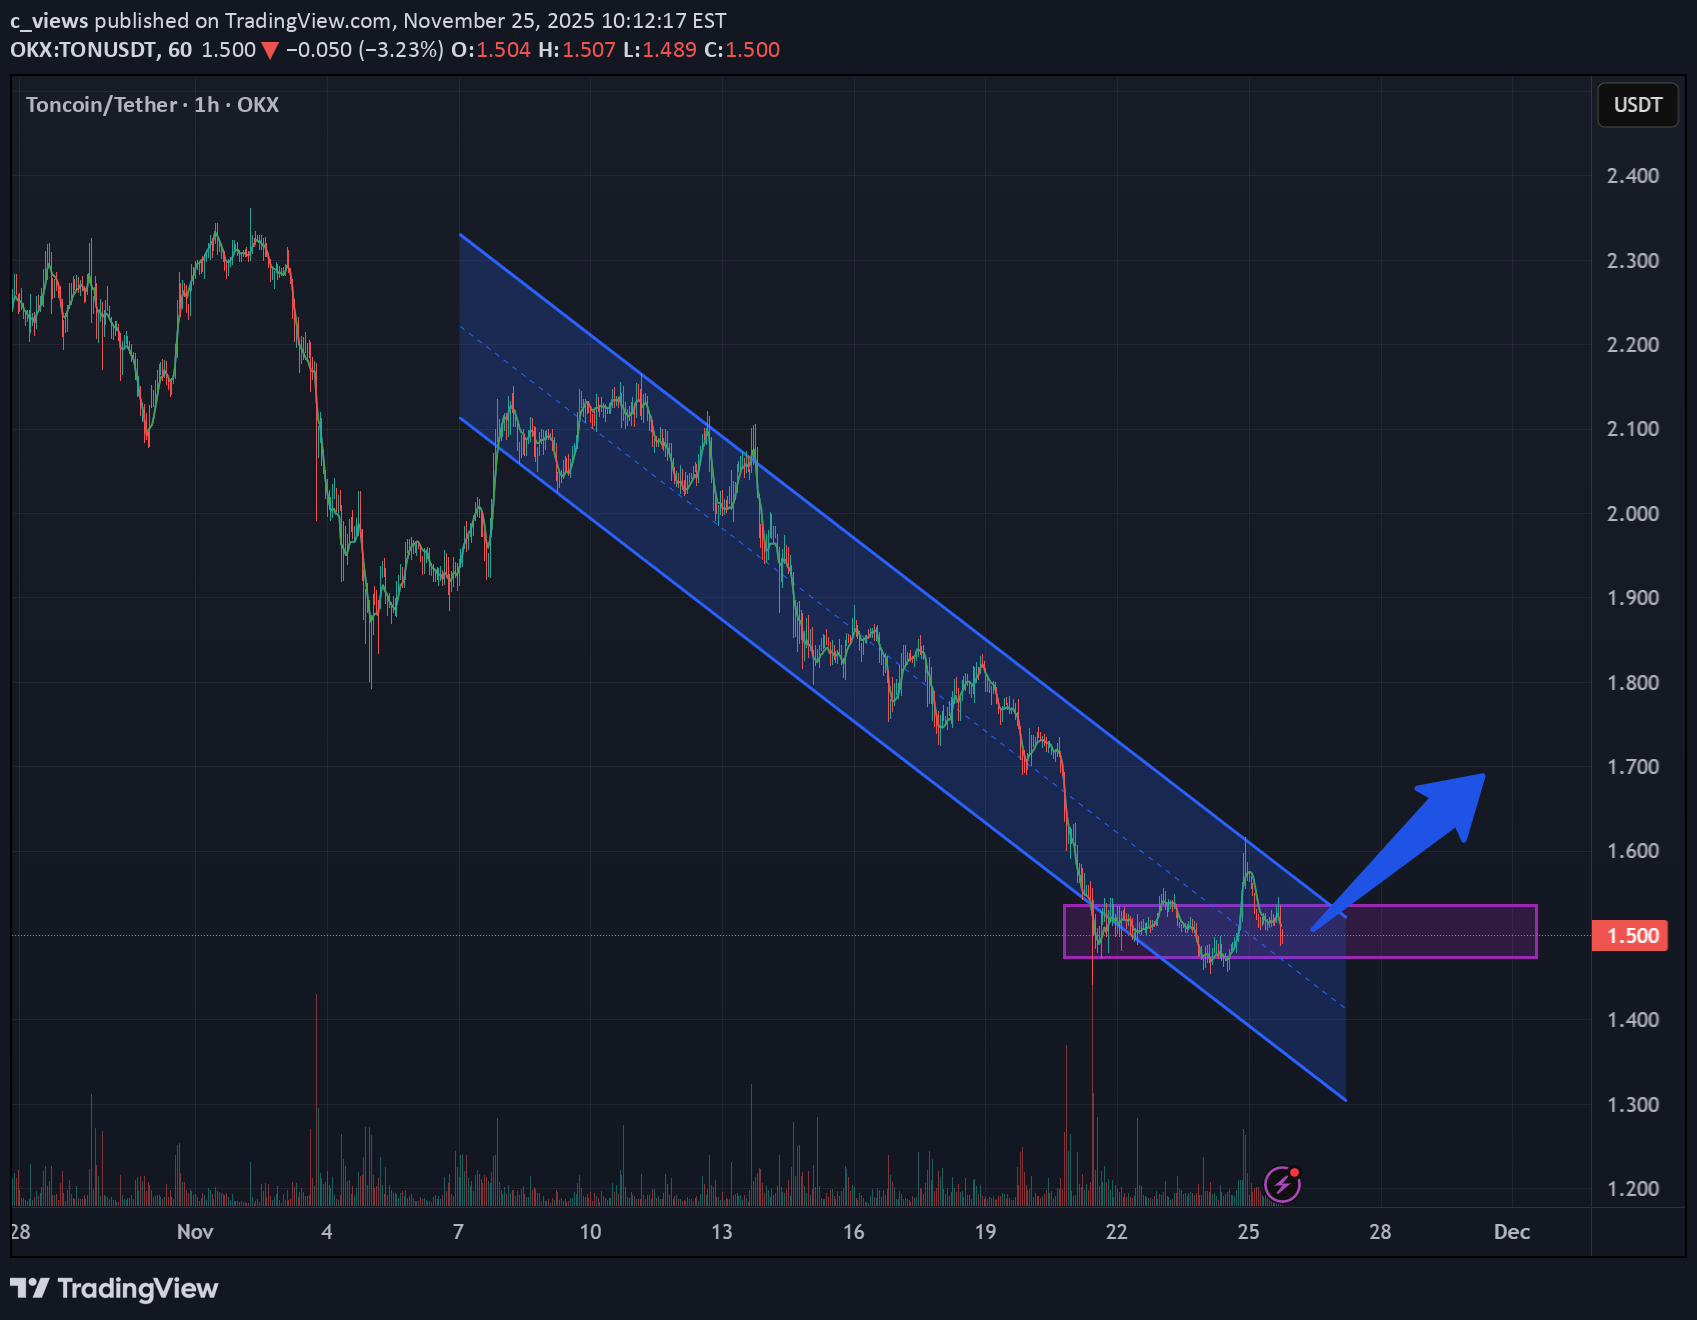
TON has formed a bullish flag pattern, and we've also reached the local liquidity zone we've collected According to the pattern, an upward rebound is expected Current price: $1.492 If the price falls below the zone of interest and consolidates below, the movement will continue in a downward corridor within the pattern
Disclaimer
Any content and materials included in Sahmeto's website and official communication channels are a compilation of personal opinions and analyses and are not binding. They do not constitute any recommendation for buying, selling, entering or exiting the stock market and cryptocurrency market. Also, all news and analyses included in the website and channels are merely republished information from official and unofficial domestic and foreign sources, and it is obvious that users of the said content are responsible for following up and ensuring the authenticity and accuracy of the materials. Therefore, while disclaiming responsibility, it is declared that the responsibility for any decision-making, action, and potential profit and loss in the capital market and cryptocurrency market lies with the trader.