Technical analysis by c_views about Symbol BNB: Buy recommendation (12/2/2025)

c_views
تحلیل ساختار بازار BNB: آیا قیمت به اوج تاریخی میرسد یا سقوط میکند؟
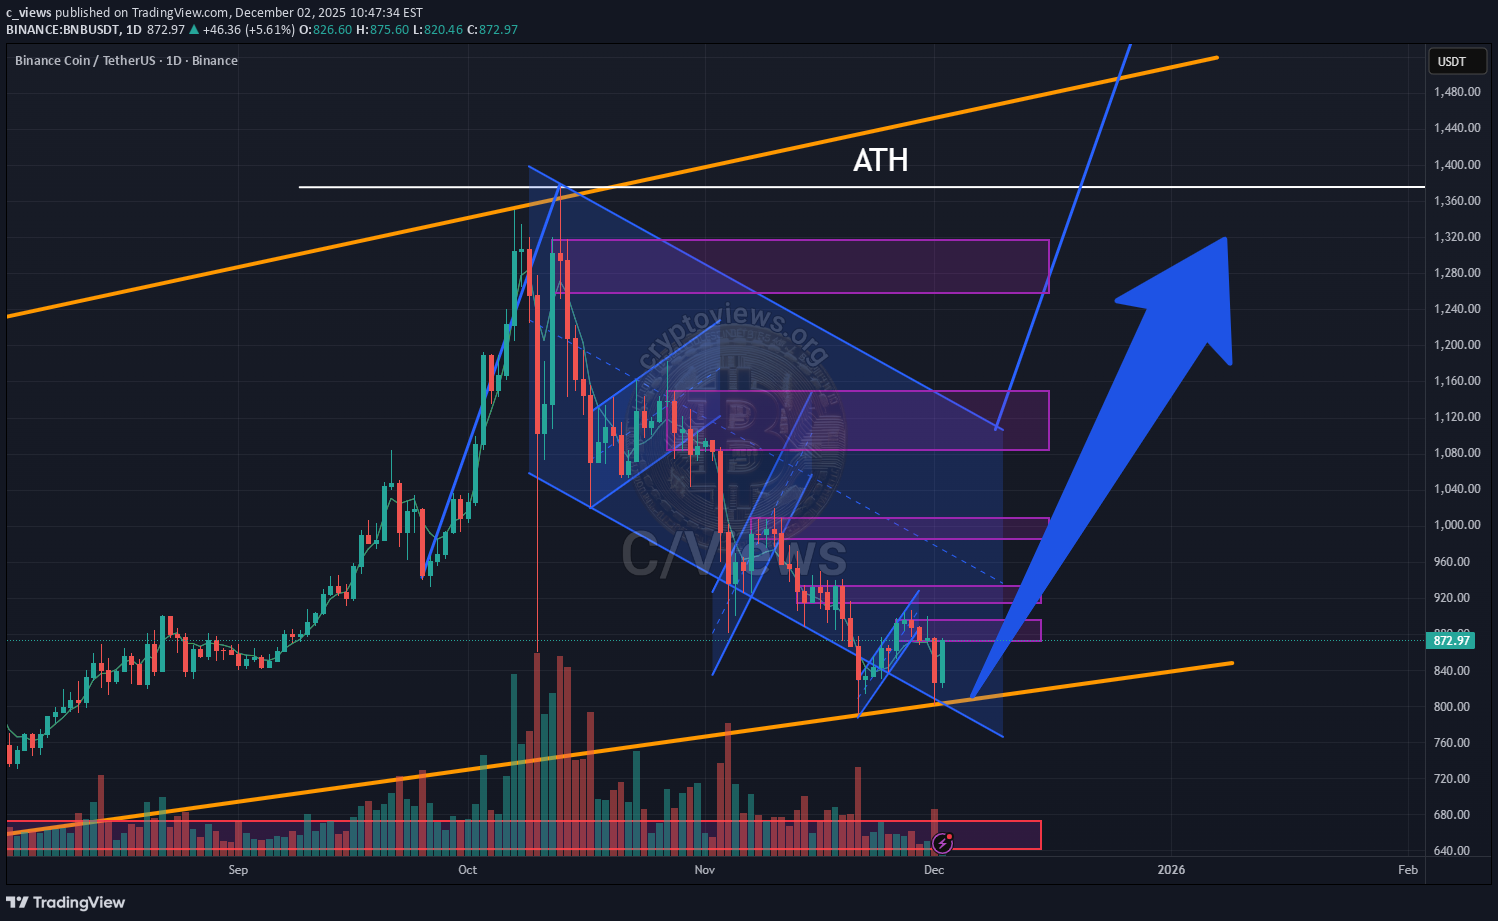
BNB is moving within global patterns, an ascending expanding wedge within which a bullish flag has formed. Five liquidity zones have formed above. Below, two liquidity zones have formed, the first from January 2025 and the second from February 2024. Given the Fed's rate tightening plan, the movement is more likely to be upward. Globally, it could reach the previous ATH or even the upper boundary of the wedge. Also, on the longs and shorts map, it appears that longs are currently in excess. The liquidity map shows that the enormous liquidity is forming at the top, not the bottom. According to the media, the indicator is positive, in response to CZ's comment regarding the Fed. Also, given that BTC is being prevented from breaking the lower boundary of the pattern we discussed in our previous review, BNB's movement against BTC is more likely to be upward along the designated liquidity zones. If the lower boundary of the pattern is broken, and the candlestick forms deeper than the previous candlestick, the movement is more likely to be upward. downward, with a false breakout to the liquidity area highlighted in red